

Abstract
Gait symmetry is one of the most informative aspects describing the quality of gait. Many indices have been proposed to quantify gait symmetry. Among them, indices focusing on the comparison of the two body sides (e.g., Symmetry Angle, SA) and indices based on the analysis of the locomotor act as a whole, dealing with the body center of mass (e.g., Symmetry Index, SIBCoM) or lower trunk accelerometry (e.g., improved Harmonic Ratio, iHR) have been proposed. Remarkably, the relationship between these indices has received little attention so far, as well as the influence of gait speed on their values. The aim of this study is to investigate this relationship by comparing the SA, SIBCoM, and iHR, and to explore the effect of walking speed on these indices. Ten healthy adults walked for 60 s on a treadmill at seven different speeds (from 0.28 to 1.95 m s−1) and simulate an asymmetric gait (ASYM) at 0.83 m s−1. Marker-based trajectories were recorded, and the body center of mass 3D trajectory was obtained. Simultaneously, lower trunk 3D linear accelerations were collected using a triaxial accelerometer. SIBCoM, iHR, and SA were calculated for each stride, each anatomical direction, and each condition. Perfect symmetry was never displayed in any axes and any indices. Significant differences existed between SIBCoM, and iHR in all anatomical directions (p < 0.0001). The walking speed significantly affected SIBCoM and iHR values in anteroposterior and craniocaudal directions, but not in mediolateral. Conversely, no walking speed effect was found for SA (p = 0.28). All three indices significantly discriminated between ASYM and the corresponding walking condition (p < 0.05). Gait symmetry may differ significantly according to the data source, mathematical approach, and walking speed. Healthy individuals display an asymmetrical gait and acknowledging this aspect is crucial when establishing rehabilitation objectives and assessing the quality of gait in the clinical setting.
Subject terms: Biomedical engineering, Bone quality and biomechanics, Biomechanics
Introduction
Locomotion is accomplished through complex and timely interactions among the nervous, muscular, and skeletal systems. The quantitative assessment and description of these functions is the objective of gait analysis1. Effectively answering the question “how a given individual walks” is one of the primary goals of gait analysis1.
The quality of gait can be assessed considering different aspects. Among them, gait symmetry has been widely acknowledged as one of the most informative, along with the maintenance of balance, mechanical loads on tissues, and energy expenditure1,2. In general, gait symmetry refers to a perfect agreement between the actions of the left and right sides of the body, with specific reference to the lower limbs action3,4. From a functional point of view, asymmetry in gait has been associated with an increased metabolic cost during locomotion5, with reduced bone density and osteoporosis in the affected limb, as well as an increased joint load and a consequent higher risk of osteoarthritis in the opposite limb6. For these reasons, quantifying gait symmetry provides crucial information to identify underlying deficits, guide clinical decisions, and monitor rehabilitation outcomes4,7.
A vast number of indices have been proposed in the literature to quantify gait symmetry, based on different data sources and approaches4. Discrete approaches based on equations to calculate symmetry from discrete values of gait features, e.g. spatiotemporal parameters (like the Symmetry Ratio 8, the Symmetry Index9, or the Symmetry Angle10) are widely adopted. On the other hand, non-linear or statistical approaches based on the comparison of series of data describing the behaviour/mechanics of the two sides of the body over a complete gait cycle (like ground reaction forces, joint kinematics, or kinetics [for a detailed description please refer to Viteckova et al.4]) have been proposed. Ultimately, a third approach is used based on the analysis of the body centre of mass (BCoM), being the point that better represents the whole-body movement. This approach diverges from the preceding ones as it does not compare the behaviour of the right and left sides of the body, but rather focuses on the assessment of the locomotor act in its entirety and aims at providing a global metric describing the symmetry of gait. In this context, an index based on the trajectory of the BCoM have been proposed (SIBCoM)11 and applied12–15. With a similar intent and leveraging the widespread use of wearable accelerometers located on the lower trunk, near the BCoM, other symmetry indices based on the signal frequency content have been devised. Among them, the Harmonic Ratio (HR)16, and its modified version, i.e., the improved Harmonic Ratio (iHR)17, have gained extensive popularity in recent years17–20.
Remarkably, the relationship between indices comparing the behavior of the two body sides Vs those focusing on the BCoM (or a point closed to the BCoM) has received very little attention so far. Only one study compared the SIBCoM with the Symmetry Angle10 and found no significant correlation between them13. Furthermore, highly controversial results have been reported about the influence of gait speed on these different indices, thus raising questions on their interpretation in pathological and healthy cohorts characterized by extremely different walking speeds21–25.
The aim of the present study is thus twofold: (1) to investigate the relationship among different approaches to quantify gait symmetry by comparing three different indices, i.e., the SIBCoM, iHR, and Symmetry Angle, obtained respectively from the BCoM trajectory, the lower trunk acceleration, and a temporal parameter of gait; (2) to investigate the effect of walking speed on these three indices. Comparative evaluation was conducted in healthy adults walking on a treadmill at seven different walking speeds.
Material and methods
Participants and experimental protocol design
Ten healthy adults (4 women, 1.71 ± 0.08 m height, 68.2 ± 10.2 kg body mass, 34.5 ± 8.5 years old (mean ± standard deviation)) participated in the study approved by the University of Rome “Foro Italico” Ethics Committee (CAR 101/2021). This sample size complied with the minimum number of participants recommended by an a priori power analysis purposely performed (α = 0.05; power (1 − β) = 0.95, effect size f: 0.3) for a two-way repeated measure ANOVA (within and between interaction)26. Participants signed informed consent in accordance with the Declaration of Helsinki. They walked for 60 s on a treadmill at seven different speeds: 0.28, 0.56, 0.83, 1.11, 1.39, 1.67, and 1.95 m s−1 (namely from 1 to 7 km h−1 with steps of 1 km h−1), whose order was randomized. Each participant was also asked to simulate an asymmetric gait at 0.83 m s−1, and a 60-s walk was also registered for this condition (ASYM). No indication was provided about the kind of asymmetry to be simulated or the affected side. A 6-min treadmill acclimatization protocol was performed by each participant before data acquisition27. Participants were first asked to stay still for 5 s and then start walking at the speed selected by the operator. Measurements started when the treadmill was at a constant speed. The accuracy of the treadmill was verified before the experiments to ensure it maintained the required belt speed which was monitored during the steady speed using one of the markers placed on the participants' shoes.
Data acquisition
The 3D trajectories of 18 reflective markers located on the main joint centres according to Pavei et al.28–30 were recorded using a 6-camera stereophotogrammetric system (Vicon Vero, Oxford Metrics, UK, 200 Hz). Simultaneously, lower trunk 3D proper linear accelerations were collected using a triaxial accelerometer (Inertial Measurement Unit - IMU) (APDM Opal, Portland, OR, USA, 200 Hz, 25 g, ± 16 g) located at the L1–L2 level. The two systems were electronically synchronized through a trigger box. Marker and accelerometer positioning was performed by the same expert operator. Markers were attached to the participants’ skin using double-sided tape, whereas the accelerometer was firmly fixed using an elastic belt. The accelerometer axes were carefully aligned with the anteroposterior (AP), mediolateral (ML), and craniocaudal (CC) anatomical axes.
Data analysis
Marker positions were filtered through a zero-lag 2nd-order Butterworth low-pass filter with a cut-off frequency identified by a residual analysis on each marker coordinate31. The time course of the BCoM 3D position was estimated as the weighted mean of an 11‐segment model based on Dempster's inertial parameters of body segments28,29. Left and right foot strike events were identified from markers positions according to the method proposed by O’Connor et al.32. These events were considered to segment stride and step cycles and to calculate all symmetry indices listed below. For each considered stride, the BCoM trajectory was represented by a closed 3D loop (Lissajous contours), describing its displacement with respect to its average position11.
The following gait symmetry indices were then computed.
Symmetry Index (SIBCoM)
SIBCoM was calculated for each stride from the marker-based BCoM trajectory based on its harmonic content, as proposed by11 (detailed procedures are reported in the Supplementary Material of Minetti et al.11). Briefly, the 3D trajectory of the BCoM is mathematically defined by 10-harmonic Fourier series, whose coefficients are used to calculate the Symmetry Index (SIBCoM) for each anatomical axis11. A perfectly symmetrical gait would yield only even harmonics along the AP and CC axes, and only odd harmonics in the ML direction11,33. These harmonics are considered intrinsic to the phenomenon, whereas the harmonics which lead to deviations from the ideal gait are named extrinsic. The terms intrinsic and extrinsic refer to the interpretation proposed by Cappozzo34 where the locomotor act is seen as composed of an intrinsic pure form of movement pattern, eventually deformed by extrinsic causes. Based on this terminology, SIBCoM was defined as follows:
| 1 |
where cIj and cEj are, respectively, the amplitude of the jth intrinsic and extrinsic harmonics for each BCoM trajectory component k11 (Fig. 1). SIBCoM was expressed in percentage so that it ranged from 0% (total asymmetry) to 100% (perfect symmetry).
Figure 1.

Body centre of mass (BCoM) trajectory and acceleration signals with the relevant amplitude spectra in the anteroposterior (AP), mediolateral (ML) and craniocaudal (CC) directions over one randomly chosen stride of a participant walking at 1.39 m s−1.
Improved Harmonic Ratio (iHR)
The 3D proper acceleration measured by the trunk mounted IMU was considered. To guarantee identical starting conditions for all participants, the accelerometer was verticalized through a rigid transformation computed in the static phase at the beginning of each trial which corrected for both the pitch and roll angles35. This transformation was applied to the measured acceleration in each sampled instant of time. The resulting local axes were considered to approximate anatomical axes (AP, ML, CC). After removing the mean value from each acceleration component, the iHR was obtained for each stride as follows17:
| 2 |
where PIj and PEj are, respectively, the power (amplitude squared) of the jth intrinsic and extrinsic harmonics for each acceleration component k (Fig. 1). The first 20 harmonics were considered. The iHR relies on the same concept and harmonic analysis as the SIBCoM, with the difference that acceleration signals and the power of each harmonic are considered. Exactly like SIBCoM, iHR ranges from 0% (total asymmetry) to 100% (perfect symmetry).
Symmetry Angle (SA)
Finally, from foot strike events, left and right step durations (dL and dR) were calculated and the Symmetry Angle (SA)10 was computed for each stride as follow:
| 3 |
If dL > dR, the ratio between the step durations was inverted so that each deviation from perfect symmetry had the same direction, regardless the “affected” body side. An SA value of 0% indicates perfect symmetry, whereas ± 100% indicates that the two values are equal and opposite in magnitude. This index was selected among many others based on discrete approaches because it has been demonstrated that it overcomes most limitations of the latter (normalization to reference values, artificial inflation)4,10.
For each participant and each condition, SIBCoM, iHR, and SA were obtained for each stride performed at a steady state. Data were analysed with purposely written LabVIEW (v13, National Instrument, USA) and Matlab® (R2016a, The MathWorks Inc., USA) scripts.
Statistics
For each index value, a preliminary outlier analysis was performed based on a threshold of ± 3 on the z-score to remove outliers from the data set. For each participant and each condition, the mean (μ) and standard deviation (σ) values of SIBCoM, iHR, and SA over the analysed strides were calculated for each walking speed after checking for normality and were considered for further analysis. The normal distribution of μ and σ was then verified using the Shapiro–Wilk test of normality. To investigate whether significant differences existed between SIBCoM and iHR and to assess the effect of walking speed on both parameters, a two-way repeated measure ANOVA was performed both on μ and σ. When a significant “index” or “speed” effect was found, pairwise comparisons were analysed through post hoc tests using the Bonferroni correction. Similarly, to investigate the effect of walking speed on SA values and its variability, a one-way repeated measure ANOVA was performed both on μ and σ followed by post hoc comparison with the Bonferroni correction. Finally, the presence of significant differences between the ASYM condition and walking at the same speed (0.83 m s−1) was investigated in SIBCoM, iHR, and SA using a paired t-test. Statistical analysis was performed using the GraphPad software (version 8.4.2, California, USA, α = 0.05).
Results
A total number of 3383 strides was analysed, with a minimum and a maximum of 208 and 627 strides for the slowest (0.28 m s−1) and the fastest (1.95 m s−1) walking conditions, respectively. Excluding the ASYM condition, SIBCoM values ranged from 36.0% (at 0.28 m s−1) to 83.5% (at 1.39 m s−1), from 84.9% (at 1.95 m s−1) to 97.3% (at 0.55 m s−1), and from 51.2% (at 0.28 m s−1) to 90.0% (at 1.67 m s−1), in the AP, ML, and CC directions, respectively (Fig. 2); whereas iHR values ranged from 61.8% (at 0.28 m s−1) to 97.2% (at 1.11 m s−1), 59.1% (at 1.39 m s−1) to 94.4% (at 1.95 m s−1), and 64.4% (at 0.28 m s−1) to 98.1% (at 1.67 m s−1), in the AP, ML, and CC directions, respectively (Fig. 2). SA values ranged from 0.6% (at 1.39 m s−1) to 5.7% (at 0.28 m s−1) (Fig. 2).
Figure 2.

Box plots of the mean (μ) values over strides of Symmetry Index (SIBCoM), the improved Harmonic Ratio (iHR), and the Symmetry Angle (SA) in the anteroposterior (AP), mediolateral (ML) and craniocaudal (CC) directions over each considered walking speed as well as when simulating asymmetrical walking (ASYM condition). The box height and whiskers represent the variability of the symmetry indices over participants.
The variability of the symmetry indices ranged from 0.8 to 17.2% for SIBCoM, from 1.1 to 18.5% for iHR, and from 0.6 to 3.9% for SA (Fig. 3). The highest variation in standard deviation was observed when walking at slower speeds (0.28 and 0.55 m s−1) for all indices. Furthermore, the SIBCoM exhibited its greatest variability in the AP direction, while the iHR in the CC direction. Notably, the iHR index displayed substantial between-subject variability in the ML component, irrespective of walking speed (Fig. 3).
Figure 3.

Box plots of the standard deviation (σ) values over strides of Symmetry Index (SIBCoM), the improved Harmonic Ratio (iHR), and the Symmetry Angle (SA) in the anteroposterior (AP), mediolateral (ML) and craniocaudal (CC) directions over each considered walking speed as well as when simulating asymmetrical walking (ASYM condition). The box height and whiskers represent how the standard deviation of each index over strides changes among participants.
Effect of index and walking speed on gait symmetry
The two-way repeated measure ANOVA showed a significant effect of the “index” factor in all three directions (Table 1). The walking speed was found to significantly affect SIBCoM and iHR values in AP and CC directions, but not in ML, whereas a significant “index × speed” interaction was obtained for all components (Table 1).
Table 1.
ANOVA results for the mean values of SIBCoM and iHR symmetry indices.
| SS | DF | MS | F (DFn, DFd) | p value | |
|---|---|---|---|---|---|
| AP | |||||
| Index | 13,139 | 1 | 13,139 | F (1, 18) = 114.0 | < 0.0001 |
| Speed | 6756 | 6 | 1126 | F (2.31, 41.6) = 66.2 | < 0.0001 |
| Index × speed | 470 | 6 | 78.4 | F (6, 108) = 4.6 | < 0.001 |
| ML | |||||
| Index | 4513 | 1 | 4513 | F (1, 18) = 30.7 | < 0.0001 |
| Speed | 154 | 6 | 25.6 | F (1.55, 27.8) = 1.1 | 0.326 |
| Index × speed | 393 | 6 | 65.5 | F (6, 108) = 2.9 | < 0.05 |
| CC | |||||
| Index | 2919 | 1 | 2919 | F (1, 18) = 56.3 | < 0.0001 |
| Speed | 8397 | 6 | 1400 | F (1.99, 35.8) = 143.0 | < 0.0001 |
| Index × speed | 155 | 6 | 25.8 | F (6, 108) = 2.6 | < 0.05 |
Results of the two-way repeated measure ANOVA results for the mean values of the symmetry indices.
SS sum of squares, DF degrees of freedom, MS mean squares, F F-ratio, DFn degree of freedom for the numerator of the F-ratio, DFd degree of freedom for the denominator of the F-ratio.
Significant values are in bold.
Post hoc analyses for the “index” factor indicated that SIBCoM and iHR mean values significantly differed in all walking speeds in the AP direction (p < 0.01). In ML and CC directions, significant differences were found, respectively, at low and high walking speeds. Specifically, SIBCoM and iHR were significantly different from 0.28 to 1.11 m s−1 for the ML component (p < 0.05), whereas, in the CC direction, they differed significantly from 0.83 to 1.95 m s−1 (p < 0.001).
As for the influence of walking speed on gait symmetry values, several significant differences were displayed by the post hoc analyses for both SIBCoM and iHR, particularly in AP and CC directions (detailed results are reported in the Supplementary Material). Overall, both SIBCoM and iHR values increased with speed until they reach a plateau in AP and CC directions, whereas in the ML direction, they displayed a rather constant trend with only SIBCoM values significantly decreasing from 0.83 to 1.67 m s−1 (p < 0.05).
When considering the effect of walking speed on gait symmetry as assessed using SA, the one-way ANOVA analysis showed no significant speed effect (F(6, 62) = 1.26, p = 0.28).
For what concerns the effect of index and walking speed on the variability of SIBCoM and iHR, stride-to-stride symmetry variability significantly changed according to the index in all directions except CC, and according to the walking speed in all directions except ML (Table 2). Similarly, a significant speed effect was found for the SA variability (F(6, 62) = 4.22, p < 0.01). Detailed results about post hoc analyses are reported in the Supplementary Material.
Table 2.
ANOVA results for the standard deviations of the SIBCoM and iHR symmetry indices.
| SS | DF | MS | F (DFn, DFd) | p value | |
|---|---|---|---|---|---|
| AP | |||||
| Index | 597 | 1 | 597 | F (1, 18) = 57.2 | < 0.0001 |
| Speed | 743 | 6 | 124 | F (3.41, 61.50) = 54.1 | < 0.0001 |
| Index × speed | 78 | 6 | 13 | F (6, 108) = 5.7 | < 0.0001 |
| ML | |||||
| Index | 819 | 1 | 819 | F (1, 18) = 60.1 | < 0.0001 |
| Speed | 36 | 6 | 6 | F (1.76, 31.64) = 1.6 | 0.209 |
| Index × speed | 67 | 6 | 11 | F (6, 108) = 3.0 | < 0.01 |
| CC | |||||
| Index | 2 | 1 | 2 | F (1, 18) = 0.2 | 0.642 |
| Speed | 856 | 6 | 143 | F (2.86, 51.47) = 60.6 | < 0.0001 |
| Index × speed | 236 | 6 | 39 | F (6, 108) = 16.7 | < 0.0001 |
Results of the two-way repeated measure ANOVA results for the standard deviations of the symmetry indices.
SS sum of squares, DF degrees of freedom, MS mean squares, F F-ratio, DFn degree of freedom for the numerator of the F-ratio, DFd degree of freedom for the denominator of the F-ratio.
Significant values are in bold.
Comparison with the ASYM condition
Both SIBCoM and iHR significantly discriminated between ASYM and the corresponding walking condition (0.83 m s−1) in all three directions (SIBCoM: t = 9.51, df = 9, p < 0.0001; t = 3.58, df = 9, p < 0.01; t = 9.71, df = 9, p < 0.0001 for AP, ML, and CC directions respectively; iHR: t = 8.28, df = 9, p < 0.0001; t = 7.38, df = 9, p < 0.0001; t = 6.85, df = 9, p < 0.0001 for AP, ML, and CC respectively). Similarly, a significant difference existed between ASYM and walking at 0.83 m s−1 for SA (t = 2.96, df = 9, p = 0.016).
In terms of stride-to-stride symmetry variability, significant differences were found between ASYM and walking at 0.83 m s−1 for both SIBCoM and iHR in AP (SI: t = 3.23, df = 9, p < 0.05; iHR: t = 5.02, df = 9, p < 0.001), as well as for SA (t = 2.97, df = 9, p < 0.05). Conversely, no difference was found for the ML and CC direction for both SIBCoM and iHR.
Discussion
The present study focuses on the quantification of gait symmetry and on the influence of walking speed on this aspect. Specifically, three different symmetry indices were extracted from the trajectory of the body center of mass, the acceleration measured at the lower trunk, and step duration during walking on a treadmill at seven different speeds.
Gait symmetry values in terms of SIBCoM, iHR, and SA are in agreement with the existing literature for the walking speeds already investigated, either on treadmill11,13 or overground14,17,36. Participants exhibited peak values of gait symmetry for both SIBCoM and iHR across the entire spectrum of walking speeds they covered. This supports the idea that individuals may not achieve their maximum symmetry when they walk at their self-selected pace. Furthermore, the speed at which gait symmetry was maximum varied depending on the specific anatomical axis and index being considered. A similar pattern was observed for SA, where peak values were achieved within a range of walking speeds spanning from 0.28 to 1.95 m s−1. Interestingly, perfect symmetry was not displayed in any axes and any indices. This aligns with previous studies reporting that a certain degree of asymmetry is present even in healthy people, reflecting natural functional differences between the two body sides3,11,37–40. This degree of asymmetry changes according to the considered index and anatomical axis and should be taken into account when comparing healthy and pathological populations. Similarly, variability in stride-to-stride gait symmetry changes based on the chosen index, direction, and speed, spanning from 1 to 18% (Fig. 3). Specifically, a greater standard deviation was found for low walking speeds for all three indices (especially in the AP and CC directions for SIBCoM and iHR). The iHR index displayed a significant greater variability with respect to SIBCoM in the ML direction. This agrees with previous research, which observed that the variability of the iHR was twice as pronounced in the ML direction compared to the other two directions, in young and elderly people as well as in amputees walking at self-selected speed17. These varying degrees of variability need to be taken into account when determining the required sample size in future studies.
When comparing gait symmetry obtained from the BCoM trajectory and from accelerometric signals, the results revealed significant differences in all three anatomical directions (Fig. 2). Essentially, SIBCoM and iHR can provide distinct information about the symmetry of gait. This may be due to several factors: first the considered data source, both in terms of location and type of signal. The BCoM trajectory is derived using a weighted segmental approach, while acceleration is measured at the lower trunk, approximately at L1–L2 level. The fact that these two “points” do provide different information has been widely demonstrated28,30. Furthermore, a prior study conducted by Navvab Motlagh and Arshi13 used SIBCoM to quantify gait symmetry from both the BCoM and a single marker on the sacrum: their findings indicated discrepancies between the two approaches, especially in the AP direction. This is consistent with the results of the present study, which further expand this difference to the other directions. Second, SIBCoM relies on the amplitude of the harmonics, whereas iHR considers the power of these harmonics. This distinction might account for the higher values observed with iHR in the AP and CC directions compared to SIBCoM (Fig. 4). However, it does not explain the opposite trend observed in the ML direction, where SIBCoM consistently demonstrated average values exceeding 90% across all walking speeds, including the ASYM condition. These findings suggest that when analyzing the BCoM trajectory, the ML component is less affected by asymmetrical characteristics when compared to the AP and CC components11. This is not the case when considering the acceleration measured at lower trunk level and might be explained by the different frequency content of the two signals: whereas the ML component of the BCoM trajectory is essentially characterized by a “pure” sinusoidal wave (first harmonic), the Fourier spectrum of the ML acceleration measured at the lower trunk displays peaks across nearly all odd harmonics (Fig. 1). Interestingly, this applies to the ASYM condition as well.
Figure 4.
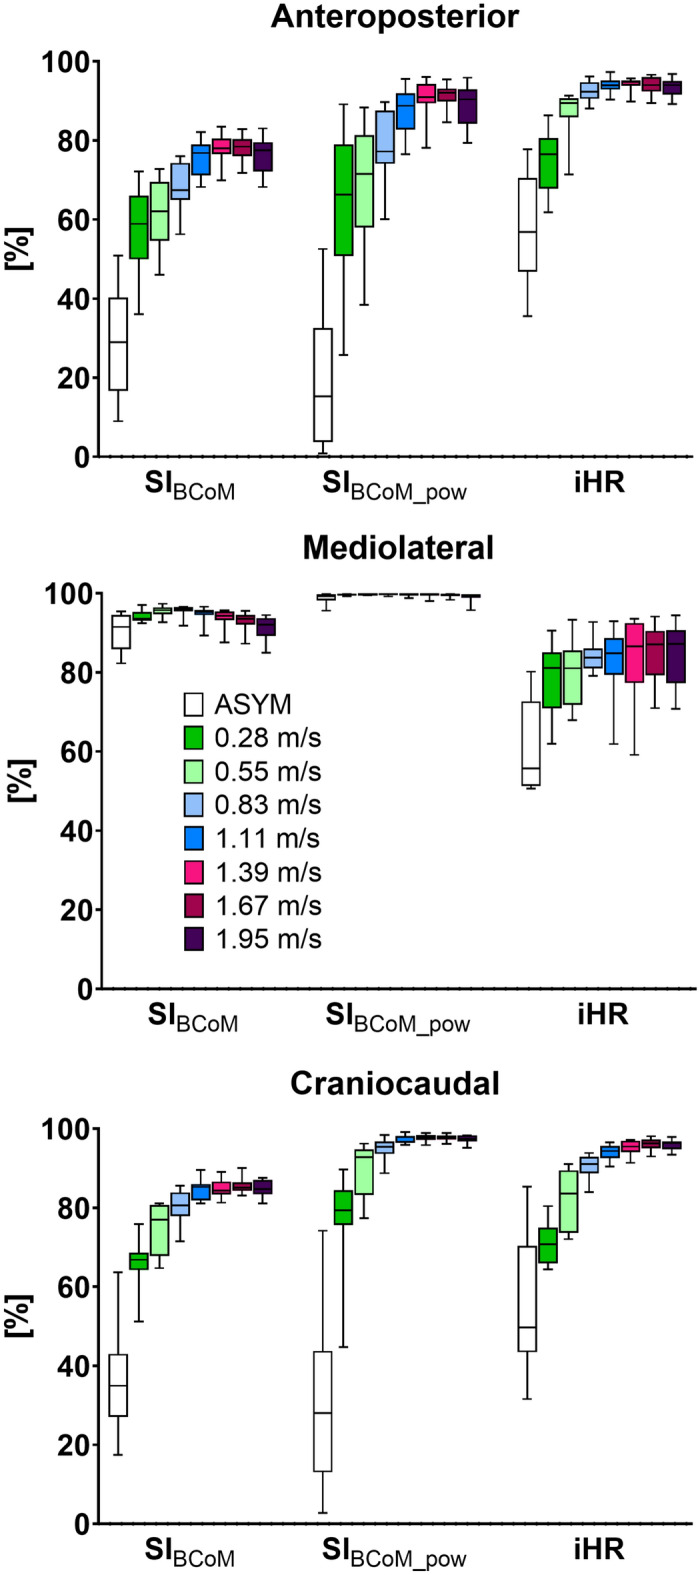
Box plots of the mean values over strides of Symmetry Index (SIBCoM), the SI obtained using the power of each harmonic instead of the amplitude (SIBCoM_pow), and the improved Harmonic Ratio (iHR) in the anteroposterior (AP), mediolateral (ML) and craniocaudal (CC) directions over each considered walking speed as well as when simulating asymmetrical walking (ASYM condition).
The effect of walking speed on gait symmetry has been investigated in previous studies, with no unanimous consensus emerging on this matter. The outcomes vary depending on the data source, the mathematical approach used to quantify symmetry and the range of walking speed considered24. In the present study, SA does not exhibit any speed-related effect, whereas both SIBCoM and iHR do show a speed-dependent effect, displaying significantly smaller values at low walking speed. These values reach their maximum and remain relatively constant between 1.11 and 1.39 m s−1. This trend aligns with findings from previous studies, even though they might not necessarily employ the same data sources or mathematical approaches as the present study11,13,15,23,33,41. The different behavior of SA, when compared to the other indices, suggests that a spatiotemporal parameter like step duration may not adequately capture the complex dynamic of the whole body. It is worth noting that this study is the first to investigate seven different walking speeds, ranging from 0.28 to 1.95 m s−1. This comprehensive analysis allows for a thorough characterization of a wide range of speeds commonly encountered in various contexts of human walking, including those involving pathological populations. Consequently, our findings underscore the importance of considering the effect of walking speed when assessing gait symmetry in clinical settings where pathological and control populations may walk at significantly different speeds22,41,42.
All three indices effectively discriminate simulated asymmetrical gait from typical gait at the same speed. While there was considerable variability among individuals in all indices for the ASYM condition, it is noteworthy that the stride-to-stride variability in this condition was actually less than that observed across all walking speeds, especially for SIBCoM in the AP and CC directions. This indicates a high level of within-subject consistency in replicating an asymmetrical gait pattern (Fig. 3).
The present study considers exclusively young, healthy participants. Future research should encompass a wider range of age groups and diverse anthropometric profiles as well as individuals with pathological conditions characterized by asymmetrical gait.
Conclusions
This study demonstrates that gait symmetry, as assessed from the body centre of mass trajectory, can differ significantly compared to symmetry obtained from lower trunk acceleration or temporal parameters of gait. It is crucial to be meticulous about the specific aspect under consideration when quantifying gait symmetry, as the interpretation of the results can significantly hinge on the data source and mathematical approach employed. Importantly, current findings support the idea that gait is asymmetrical in the healthy population. Acknowledging this aspect is crucial when establishing rehabilitation objectives and assessing the quality of gait in patients with pronounced walking asymmetry. Additionally, it is important to note that frequency-based symmetry metrics can be influenced by gait speed. This highlights the need for caution when comparing individuals walking at different speeds.
Supplementary Information
Acknowledgements
The authors would like to thank all the volunteers who kindly participated to the data acquisition.
Author contributions
E. B. contributed to the conception and design of the work, to the acquisition, analysis, and interpretation of data. E.B. wrote the main manuscript text and prepared figures and tables. A.C. contributed to the design of the work. G.P. contributed to the conception and design of the work, to the acquisition, analysis, and interpretation of data. All authors substantively revise the manuscript and approved the submitted version of the manuscript.
Funding
This study was funded by the Eurepean Union - NextGenerationEU - M4, C2, 1.1, under the project PRIN 2022 (DD MUR n.104 del 02.02.2022) entitled “CARAMELLA - Contactless And ReliAble MovEment anaLysis with miLlimeter-waves rAdars” – CUP H53D23000550006, Project Code: BERG_E_24_RN_PRIN_CARAMELLA_01 (2022TLSWHM).
Data availability
The datasets generated during and/or analysed during the current study are available from the corresponding author on reasonable request.
Competing interests
The authors declare no competing interests.
Footnotes
Publisher's note
Springer Nature remains neutral with regard to jurisdictional claims in published maps and institutional affiliations.
Supplementary Information
The online version contains supplementary material available at 10.1038/s41598-024-69461-w.
References
- 1.Cappozzo, A. Considerations on clinical gait evaluation. J. Biomech.16, 302 (1983). 10.1016/0021-9290(83)90202-6 [DOI] [PubMed] [Google Scholar]
- 2.Cappozzo, A. Gait analysis methodology. Hum. Mov. Sci.3, 27–50 (1984). 10.1016/0167-9457(84)90004-6 [DOI] [Google Scholar]
- 3.Sadeghi, H., Allard, P., Prince, F. & Labelle, H. Symmetry and limb dominance in able-bodied gait: A review. Gait Posture12, 34–45 (2000). 10.1016/S0966-6362(00)00070-9 [DOI] [PubMed] [Google Scholar]
- 4.Viteckova, S. et al. Gait symmetry measures: A review of current and prospective methods. Biomed. Signal Process. Control42, 89–100 (2018). 10.1016/j.bspc.2018.01.013 [DOI] [Google Scholar]
- 5.Browne, M. G., Smock, C. S. & Roemmich, R. T. The human preference for symmetric walking often disappears when one leg is constrained. J. Physiol.599, 1243–1260 (2021). 10.1113/JP280509 [DOI] [PMC free article] [PubMed] [Google Scholar]
- 6.Jørgensen, L., Crabtree, N. J., Reeve, J. & Jacobsen, B. K. Ambulatory level and asymmetrical weight bearing after stroke affects bone loss in the upper and lower part of the femoral neck differently: Bone adaptation after decreased mechanical loading. Bone27(5), 701–707 (2000). 10.1016/S8756-3282(00)00374-4 [DOI] [PubMed] [Google Scholar]
- 7.Cutti, A. G., Verni, G., Migliore, G. L., Amoresano, A. & Raggi, M. Reference values for gait temporal and loading symmetry of lower-limb amputees can help in refocusing rehabilitation targets. J. Neuroeng. Rehabil.15, 29–40 (2018). 10.1186/s12984-018-0403-x [DOI] [PMC free article] [PubMed] [Google Scholar]
- 8.Seliktar, R. & Mizrahi, J. Some gait characteristics of below-knee amputees and their reflection on the ground reaction forces. Eng. Med.15, 27–34 (1986). 10.1243/EMED_JOUR_1986_015_009_02 [DOI] [PubMed] [Google Scholar]
- 9.Robinson, R. O., Herzog, W. & Nigg, B. M. Use of force platform variables to quantify the effects of chiropractic manipulation on gait symmetry. J. Manipulative Physiol. Ther.10, 172–176 (1987). [PubMed] [Google Scholar]
- 10.Zifchock, R. A., Davis, I., Higginson, J. & Royer, T. The symmetry angle: A novel, robust method of quantifying asymmetry. Gait Posture27, 622–627 (2008). 10.1016/j.gaitpost.2007.08.006 [DOI] [PubMed] [Google Scholar]
- 11.Minetti, A. E., Cisotti, C. & Mian, O. S. The mathematical description of the body centre of mass 3D path in human and animal locomotion. J. Biomech.44, 1471–1477 (2011). 10.1016/j.jbiomech.2011.03.014 [DOI] [PubMed] [Google Scholar]
- 12.Seminati, E. et al. Anatomically asymmetrical runners move more asymmetrically at the same metabolic cost. PLoS One8(9), e74134 (2013). 10.1371/journal.pone.0074134 [DOI] [PMC free article] [PubMed] [Google Scholar]
- 13.Navvab Motlagh, F. & Arshi, A. R. Symmetry comparison between sacrum and center of mass during walking. Proc. Inst. Mech. Eng. H.230, 682–689 (2016). 10.1177/0954411916646402 [DOI] [PubMed] [Google Scholar]
- 14.Ochoa-Diaz, C. & Bó, A. P. L. Symmetry analysis of amputee gait based on body center of mass trajectory and discrete fourier transform. Sensors (Switzerland).20, 2392 (2020). 10.3390/s20082392 [DOI] [PMC free article] [PubMed] [Google Scholar]
- 15.Ruggiero, L., Carpi, M. & Minetti, A. E. Rocker-profile design shoes improve pendular energy recovery in walking with no effects on total mechanical work. J. Biomech.144, 111345 (2022). 10.1016/j.jbiomech.2022.111345 [DOI] [PubMed] [Google Scholar]
- 16.Gage, H. Accelerographic analysis of human gait in Biomechanics Monograph (ed. ASME United Engineering Center) 137–152 (New York (US), 1967).
- 17.Pasciuto, I., Bergamini, E., Iosa, M., Vannozzi, G. & Cappozzo, A. Overcoming the limitations of the Harmonic Ratio for the reliable assessment of gait symmetry. J. Biomech.53, 84–89 (2017). 10.1016/j.jbiomech.2017.01.005 [DOI] [PubMed] [Google Scholar]
- 18.Bellanca, J. L., Lowry, K. A., VanSwearingen, J. M., Brach, J. S. & Redfern, M. S. Harmonic ratios: A quantification of step to step symmetry. J. Biomech.46, 828–831 (2013). 10.1016/j.jbiomech.2012.12.008 [DOI] [PMC free article] [PubMed] [Google Scholar]
- 19.Carpinella, I. et al. Instrumentally assessed gait quality is more relevant than gait endurance and velocity to explain patient-reported walking ability in early-stage multiple sclerosis. Eur. J. Neurol.28, 2259–2268 (2021). 10.1111/ene.14866 [DOI] [PubMed] [Google Scholar]
- 20.Castiglia, S. F. et al. Harmonic ratio is the most responsive trunk-acceleration derived gait index to rehabilitation in people with Parkinson’s disease at moderate disease stages. Gait Posture97, 152–158 (2022). 10.1016/j.gaitpost.2022.07.235 [DOI] [PubMed] [Google Scholar]
- 21.Goble, D. J., Marino, G. W. & Potvin, J. R. The influence of horizontal velocity on interlimb symmetry in normal walking. Hum. Mov. Sci.22, 271–283 (2003). 10.1016/S0167-9457(03)00047-2 [DOI] [PubMed] [Google Scholar]
- 22.Patterson, K. K., Nadkarni, N. K., Black, S. E. & McIlroy, W. E. Gait symmetry and velocity differ in their relationship to age. Gait Posture35, 590–594 (2012). 10.1016/j.gaitpost.2011.11.030 [DOI] [PMC free article] [PubMed] [Google Scholar]
- 23.Plotnik, M., Bartsch, R. P., Zeev, A., Giladi, N. & Hausdorff, J. M. Effects of walking speed on asymmetry and bilateral coordination of gait. Gait Posture38, 864–869 (2013). 10.1016/j.gaitpost.2013.04.011 [DOI] [PMC free article] [PubMed] [Google Scholar]
- 24.Nasirzade, A., Sadeghi, H., Mokhtarinia, H. R. & Rahimi, A. A review of selected factors affecting gait symmetry. Phys. Treatments Specific Phys. Therapy7, 3–12 (2017). 10.29252/nrip.ptj.7.1.3 [DOI] [Google Scholar]
- 25.Hagoort, I., Vuillerme, N., Hortobágyi, T. & Lamoth, C. J. Outcome-dependent effects of walking speed and age on quantitative and qualitative gait measures. Gait Posture93, 39–46 (2022). 10.1016/j.gaitpost.2022.01.001 [DOI] [PubMed] [Google Scholar]
- 26.Faul, F., Erdfelder, E., Lang, A.-G. & Buchner, A. G*Power 3: A flexible statistical power analysis program for the social, behavioral, and biomedical sciences. Behav. Res. Methods39, 175–191 (2007). 10.3758/BF03193146 [DOI] [PubMed] [Google Scholar]
- 27.Meyer, C. et al. Familiarization with treadmill walking: How much is enough?. Sci. Rep.9(1), 5232 (2019). 10.1038/s41598-019-41721-0 [DOI] [PMC free article] [PubMed] [Google Scholar]
- 28.Pavei, G., Seminati, E., Cazzola, D. & Minetti, A. E. On the estimation accuracy of the 3D body center of mass trajectory during human locomotion: Inverse vs forward dynamics. Front. Physiol.8, 129 (2017). 10.3389/fphys.2017.00129 [DOI] [PMC free article] [PubMed] [Google Scholar]
- 29.Minetti, A. E., Ardigò, L. P. & Saibene, F. Mechanical determinants of gradient walking energetics in man. J. Physiol.472, 725–735 (1993). 10.1113/jphysiol.1993.sp019969 [DOI] [PMC free article] [PubMed] [Google Scholar]
- 30.Pavei, G., Salis, F., Cereatti, A. & Bergamini, E. Body center of mass trajectory and mechanical energy using inertial sensors: A feasible stride?. Gait Posture80, 199–205 (2020). 10.1016/j.gaitpost.2020.04.012 [DOI] [PubMed] [Google Scholar]
- 31.Winter, D. A. Biomechanics of Human Movement (Wiley, 1979). [Google Scholar]
- 32.O’Connor, C. M., Thorpe, S. K., O’Malley, M. J. & Vaughan, C. L. Automatic detection of gait events using kinematic data. Gait Posture25, 469–474 (2007). 10.1016/j.gaitpost.2006.05.016 [DOI] [PubMed] [Google Scholar]
- 33.Crowe, A., Samson, M. M., Hoitsma, M. J. & Van Ginkel, A. A. The influence of walking speed on parameters of gait symmetry determined from ground reaction forces. Hum. Mov. Sci.5, 347–367 (1996). 10.1016/0167-9457(96)00005-X [DOI] [Google Scholar]
- 34.Cappozzo, A. Analysis of the linear displacement of the head and trunk during walking at different speeds. J. Biomech.14(6), 411–425 (1981). 10.1016/0021-9290(81)90059-2 [DOI] [PubMed] [Google Scholar]
- 35.Bergamini, E. et al. Estimating orientation using magnetic and inertial sensors and different sensor fusion approaches: Accuracy assessment in manual and locomotion tasks. Sensors (Switzerland)14, 18625–18649 (2014). 10.3390/s141018625 [DOI] [PMC free article] [PubMed] [Google Scholar]
- 36.Patterson, K. K., Gage, W. H., Brooks, D., Black, S. E. & McIlroy, W. E. Evaluation of gait symmetry after stroke: A comparison of current methods and recommendations for standardization. Gait Posture31, 241–246 (2010). 10.1016/j.gaitpost.2009.10.014 [DOI] [PubMed] [Google Scholar]
- 37.Ankarali, M. M. et al. Walking dynamics are symmetric (enough). J. R. Soc. Interface12, 20150209 (2015). [DOI] [PMC free article] [PubMed]
- 38.Luciano, F., Ruggiero, L., Minetti, A. & Pavei, G. Comparison of three-dimensional body centre of mass trajectories during locomotion through zero- and one-dimensional statistics. Sci. Rep.12(1), 17777 (2022). 10.1038/s41598-022-22635-w [DOI] [PMC free article] [PubMed] [Google Scholar]
- 39.Siebers, H. L. et al. Comparison of different symmetry indices for the quantification of dynamic joint angles. BMC Sports Sci. Med. Rehabil.13(1), 130 (2021). 10.1186/s13102-021-00355-4 [DOI] [PMC free article] [PubMed] [Google Scholar]
- 40.Sadeghi, H., Allard Able-Bodied, P. & Duhaime, M. Functional gait asymmetry in able-bodied subjects. Hum. Movement Sci.16, 243–245 (1997). 10.1016/S0167-9457(96)00054-1 [DOI] [Google Scholar]
- 41.Latt, M. D., Menz, H. B., Fung, V. S. & Lord, S. R. Walking speed, cadence and step length are selected to optimize the stability of head and pelvis accelerations. Exp. Brain Res.184, 201–209 (2008). 10.1007/s00221-007-1094-x [DOI] [PubMed] [Google Scholar]
- 42.Patoz, A., Malatesta, D. & Burtscher, J. Isolating the speed factor is crucial in gait analysis for Parkinson’s disease. Front. Neurosci.17, 1119390 (2023). 10.3389/fnins.2023.1119390 [DOI] [PMC free article] [PubMed] [Google Scholar]
Associated Data
This section collects any data citations, data availability statements, or supplementary materials included in this article.
Supplementary Materials
Data Availability Statement
The datasets generated during and/or analysed during the current study are available from the corresponding author on reasonable request.