

Highlights
-
•
U50A transcriptionally downregulates mTOR through c-Myc.
-
•
U50A-mediated mTOR suppression leads to loss of drug target effect.
-
•
Everolimus response is predictable by U50A expression.
-
•
U50A is induced by everolimus.
-
•
U50A expression is able to monitor everolimus efficacy.
Keywords: Breast cancer, mTOR, Everolimus, snoRNAs, U50A, Drug resistance
Abstract
Breast cancer remains the most prevalent cancer in women globally, posing significant challenges in treatment due to the inevitable development of resistance to targeted therapies like everolimus, an mTOR inhibitor. While several mechanisms of resistance have been proposed, the role of snoRNAs in this context remains inadequately explored. Our study unveils a novel connection between snoRNAs and everolimus resistance, focusing on the snoRNA U50A. We discovered that U50A negatively regulates mTOR signaling by transcriptionally downregulating mTOR gene expression, which consequently leads to decreased sensitivity to everolimus treatment. Through RNA sequencing, gene set enrichment analyses, and experimental validations, we established that U50A overexpression in breast cancer cells results in mTOR downregulation and subsequently, everolimus desensitization. Clinical results further supported our findings, showing a higher prevalence of everolimus resistance in tumors with elevated U50A expression. Moreover, our results suggest that U50A's effect on mTOR is mediated through the suppression of the transcription factors c-Myc, with a notable impact on cancer cell viability under everolimus treatment. This study not only highlights the complex role of snoRNAs in cancer drug resistance but also proposes U50A as a potential biomarker for predicting everolimus efficacy in breast cancer treatment.
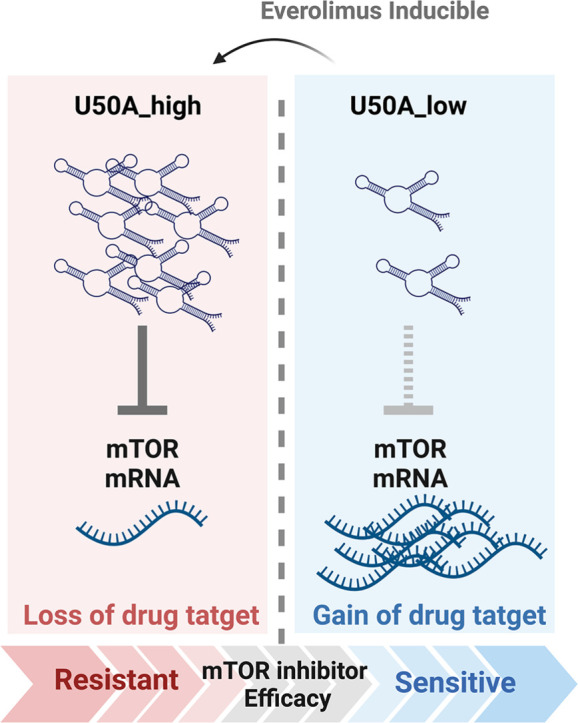
Graphical abstract
Introduction
The most frequent cancer type in women is breast cancer, which is divided into several types according to hormone receptors (estrogen receptor, ER and progesterone receptor, PR), and erb-b2 receptor tyrosine kinase 2 (HER2) expression. Hormone receptor (HR)-positive breast cancer are tumors with ER and PR-positive, which account for 70–80 % of the majority in women [1]. Activated ER signal pathway is crucial for breast cancer development, which transcriptionally promotes target genes to enhance tumor proliferation, migration and invasion [[2], [3], [4]]. Therefore, hormone therapy is the first-line strategy for HR-positive breast cancer treatment, by using estrogen modulators or antagonists to target ER, which often showed good responses [5]. However, resistance happens after long-term therapy. Numerous cellular pathways were reported to be activated in resistant tumors, such as re-activated ER by insulin-like growth factor (IGF) pathway or HER2 receptor-dependent signal, leading to escape from hormone therapy [6,7]. Among the activated signals in tamoxifen-resistant breast cancer, mammalian target of rapamycin (mTOR) pathway activation plays an important role in mediating the hormone therapy resistance through growth factor receptors [8]. mTOR is a pivotal threonine and serine kinase, that transduces signal pathways for cellular homeostasis and metabolism [9]. By integrating extracellular signals, such as growth factors, nutrients, and energy supply, mTOR pathway is essential for cell growth, survival, immunity, autophagy, and metabolism [10]. The mTOR pathway has been reported involved in several intracellular signaling cascades like AKT, PI3K, TSC1/TSC2, Rheb, and LKB/AMPK, with its downstream effectors, such as S6K1, 4EBP1, and eIF4 which play important roles in protein synthesis, cell survival, and growth. As multifaced role of mTOR signaling, dysregulation of mTOR is related to various diseases, including cancers. Upregulated mTOR promotes tumor growth through translation and cellular processes. Therefore, mTOR becomes a promising drug target for a therapeutic strategy for human malignancies. As mentioned above, the activated mTOR pathway in tamoxifen-resistant breast cancer makes it a drug target, and mTOR inhibitors, including everolimus, sirolimus, temsirolimus and ridaforolimus [11,12] are used as second-line medication in patients with resistance to hormone therapy [13,14]. Though the great effectiveness of mTOR inhibitors was observed at the beginning, breast tumors inevitably developed recurrence after a period of treatment [15,16]. However, there are absence of useful indicators for monitoring mTOR inhibitor efficacy.
Small nucleolar RNAs (snoRNAs) are often considered as housekeeping genes that exist in nucleolus for maintaining essential cellular function [17]. Ranged about 60–300 nucleotides and belonging to the small non-coding RNAs, snoRNAs exert their function through base pairing and site-specific post-modification (methylation or pseudouridylation) of rRNAs [18]. SnoRNAs are classified into two classes, the C/D box and H/ACA box, according to their structures, specific sequences and different small nucleolar RNA-protein complexes (snoRNPs) [19,20]. Though indispensable from basic cellular processes, the dysregulated expression of snoRNAs has been reported recently and associated with human diseases and cancers [21,22]. In non-small cell lung cancer (NSCLC), SNORA42 was found to be overexpressed and correlates with poor outcomes [23]; on the other hand, SNORD76 is downregulated in advance glioblastoma which may function as a tumor suppressor [24]. SNORD50A (U50A) is found globally downregulated in multiple human cancers with tumor-suppressive properties by inhibiting KRAS activity [25]. In our previous study, U50A is associated with favorable prognosis of breast cancer and prolonged the mitosis [26]. Though the role of U50A in cancers has been revealed, the relation between U50A and intracellular signaling remains unclear.
In this study, we found that U50A functions as a negative regulator of mTOR that transcriptionally downregulates mTOR mRNA and protein expression. The U50A-mediated mTOR inhibition, however, causes the loss of drug target effect, leading to the unexpected result of mTOR resistance in U50A-overexpressing cells. Furthermore, the elevated U50A was observed in everolimus-resistant cells accompanied with decreased mTOR expression. The clinical evidence also supports the mechanism that we observed the U50Ahigh tumors showed higher possibility to develop mTOR inhibitor resistance. In addition, the U50A expression is also inducible by mTOR inhibitor that eventually results in loss of mTOR target. Taken together, we found that U50A expression is an indicator for mTOR inhibitor efficacy that U50A higher expression correlates with poor mTOR inhibitor response.
Materials and methods
Total RNA extraction
We extracted total RNA by TRIzol (Invitrogen) according to the manufacturer's protocol. Chloroform was added into TRIzol with cell mixture and homogenized sample was centrifugated at 14,000 rpm for 30 min. The upper aqueous layer was collected and precipitated by the same volume of isopropanol. The mixture was incubated in the −20 oC refrigerator overnight and centrifugate at 14,000 rpm for 30 min. The supernatant was discarded and wash the pellet with 75 % ethanol. Pellet was dissolved in nuclear-free water and preserved in nuclease-free water at −80 °C. Total RNA concentration was measured by spectrophotometer (NanoDrop Lite Microlitre Spectrophotometer).
Reverse transcription
Total RNA was performed reverse transcription using M-MLV Reverse Transcriptase (Promega) according to the manufacturer's protocol. Mixture containing 200 ng RNA, random hexamer and dNTP was subjected to denature at 65 °C for 5 mins. RT enzyme and RNase inhibitor were added into mixture and performed reverse transcription at 25 °C for 5 mins, followed by 37 °C for 60 mins and terminated the reaction at 70 °C for 5 mins. cDNA product was preserved in −20 °C refrigerator.
Real-time PCR
The PCR mixture was prepared on ice in 96 well optical plates containing 2x sybr green mix (ORA™ qPCR Green ROX L Mix) and gene specific primer. The real-time PCR program was followed according to the manufacturer's protocol using 95 °C for 20 s to activate the polymerase, 40 cycles of 95 °C for 3 s and 60 °C for 30 s.
RNA sequencing
Purified total RNA samples from everolimus resistant cells (EVR cells) and control were prepared for sequencing library by TruSeq Stranded mRNA Library Prep Kit (Illumina, San Diego, CA, USA) following the manufacturer's recommendations. Briefly, Messenger RNA was purified from 1 ug total RNA by oligo(dT) and fragmented into small fraction. Reverse transcription was performed using random primer. Adaptors were ligated and purified with MPure XP system (Beckman Coulter, Beverly, USA) and check the quality using Agilent Bioanalyzer 2100 system. The qualified library was sequenced on an Illumina NovaSeq 6000 platform with 150 bp paired-end reads generated by Genomics, BioSci & Tech Co., New Taipei City, Taiwan. Gene set enrichment analysis (GSEA) is a computational method. Using GSEA software, RNA sequencing data were determined whether a group of genes in a specific set is statistically significant. The RNA sequencing data of U50A overexpressing were from previous study [26].
Western blot
Cells were harvested and lysed by NETN and applied to SDS-PAGE for fractionation. Protein was then transferred to PVDF (GE Healthcare, Uppsala, Sweden) and using 5 % nonfat milk in TBST for one hour and incubated with primary antibodies, p2448-mTOR (GTX132803), mTOR (GTX101577), c-Myc (GTX103436), c-FOS (sc-447), p-4EBP1 (GTX133182), 4EBP1 (GTX109162), p-AKT (cell signaling #9271), AKT (GTX121937) for overnight at 4 °C. Membrane were washed for 3 times by TBST and secondary antibody with specific host were incubated at room temperature for one hour. Protein expression was detected by ECL (PerkinElmer, Waltham, MA, USA).
In situ hybridization (ISH) and immunofluorescence (IF)
Breast cancer tissue array (Pantomics) was used for in situ hybridization (ISH) staining and immunofluorescence (IF) staining. Tissue sections were stained with Dig-labeled U50A probe (sequence 5′-AGT TCA GGT TCG GGA TAA GAT CAT CAC AGA-3′) synthesized by BioTnA. U50A signals were detected by Biospot ISH detection kit (TASH01D, BioTnA, Kaohsiung, Taiwan). The results were presented in DAB chromogen and observed in microscope. All glass slides were digitized with an Motic Easyscan Digital Slide Scanner (Motic Hong Kong Limited, Hong Kong, China) at x40 (0.26 μm/pixel) with High precision (High precision autofocus). Motic Easyscan whole-slide images were viewed with DSAssistant and EasyScanner software. All tissue sections were analyzed and scored by pathologist. Tissue sections were blocking at room temperature for an hour and stained with primary antibody (mTOR: GTX101557; P2448-MTOR: GTX132803) in 200x dilution at room temperature for an hour. Secondary antibodies were incubated with sample at room temperature for 30 min and use DAPI as nuclear stain.
Statistical analysis
Student t-test was used to compare two groups, pLUX and pLUX-U50A. To perform contingency analysis, Fisher's exact test was used to analyze U50Alow and U50Ahigh tumors. For multiple-group analysis, one-way ANOVA with Tukey's multiple comparisons test was used.
Colony formation assay
2000 cells were resuspended and seeded into 6 well plates. Colonies were developed after one to two weeks, and fixed with 3.7 % paraformaldehyde at room temperature for 30 mins and stained by 0.05 % Coomassie blue for 15 mins at room temperature. Colonies number in every well was calculated using ImageJ software.
MTT assay
We used MTT (3,(4,5-dimethylthiazol-2-yl-) diphenyltetrazolium bromide, 5 mg/mL) to analyze cell viability. Cells were seeded into 96 well plates and indicated drug doses were applied to incubation for five days. MTT was added into 96 wells and incubated for 1 hour at 37 °C and purple crystals were dissolved in DMSO (Dimethyl sulfoxide). Measure the absorbance at wavelength of 570 nm.
Patient specimens
We analyzed 76 paired tissues from 38 patients who received hormone and everolimus therapy. Everolimus response was defined by the patient outcome; if the tumor recurrence after everolimus therapy, patients were defined as everolimus resistant and if tumor didn't recurrence after everolimus therapy, patients were defined as everolimus sensitive. Specimens were collected from the National Cheng Kung University Hospital (Tainan, Taiwan). Waivers of informed consent are approved by IRB B-ER-110-520 from NCKU Hospital.
Results
SnoRNA U50A suppresses mTOR protein expression in human breast cancer
We analyzed RNA sequencing results from MCF-7 cells transiently expressing ectopic U50 by Gene Set Enrichment Analysis (GSEA), and found that the mammalian target of rapamycin (mTOR) signaling pathway is downregulated as expression of U50A had a similar molecular impact on gene regulation observed in cells with mTOR inhibitor treatment (Fig. 1a). Moreover, we established the stable cells that sustained expressing U50A in MCF-7 cells (Fig. 1b) and validated the change of molecules involved in mTOR pathway including mTOR itself, the phosphorylation form of mTOR, and the downstream 4EBP1. The decreased Ser2448 phosphorylation residue of mTOR (p2448-mTOR) was observed in U50A-overexpressing cells, suggesting the downregulated mTOR activity (Fig. 1c). Suppressed phospho-4EBP2 was also observed as a consequence resulting from U50A-attenuated mTOR activation (Fig. 1c). Surprisingly, we found the total mTOR protein expression was significantly downregulated by U50A, suggesting that U50A not only inhibits mTOR activity but also the expression level of its non-phosphorylated status (Fig. 1c). To investigate the clinical correlations among U50A, mTOR, and p2448-mTOR, in situ hybridization of U50A and immunostaining of either mTOR or p2448-mTOR were performed using tissue sections from human breast cancer. The representative images showed that U50Alow breast tumors (B10 and F12) have higher expression of both mTOR (green) and p2448-mTOR (red), whereas U50Ahigh breast tumors (E06 and F01) have relatively low expression level of mTOR (green) and p2448-mTOR (red) (Fig. 1d). Percentage of tumors expressing lower mTOR level (mTORlow) was greatly increased from 37 % in U50Alow to 71 % in U50Ahigh tumors (Fig. 1e), and a similar trend was also observed in the correlation between U50A and p2448-mTOR (Fig. 1f). These results suggested that U50A downregulated mTOR, leading to suppressed mTOR expression and activation in human breast cancer.
Fig. 1.

U50A downregulates mTOR expression in human breast cancer.
(a) Gene set enrichment analysis (GSEA) of RNA sequencing data. Differential expression genes were analyzed by Genes Enrichment plot of GSEA in the oncogenic signature gene set. (**P = 0.002; FDR=0.23). (b) U50A expression was validated in U50A-overexpressing cells. RNA was isolated and U50A RNA expression was analyzed by qPCR. (c) mTOR pathway was investigated in U50A-overexpressing cells. (d) Breast cancer patient tissue array (BRC1021) was applied for in situ hybridization (ISH) of U50A and immunofluorescence (IF) of mTOR and p2448-mTOR. Representative images of U50A ISH and mTOR/p2448-mTOR IF. The top and bottom panels, respectively, show the U50A-low/mTOR-high/p2448-mTOR-high section (breast cancer patient B10 and F12) and U50A-high/mTOR-low/p2448-mTOR-low section (breast cancer patient E06 and F01) in the same breast cancer patients. Quantitated result of correlation between U50A and mTOR (e), p2448-mTOR (f) from ISH and IF images. Fisher's exact test was used. *P < 0.05, **P < 0.01.
Expression of U50A induces primary and acquired resistance to everolimus
mTOR pathway is generally considered to be elevated in human malignancies, which also makes mTOR inhibitor, everolimus, a therapeutic choice for human breast cancer. Considering that U50A is a negative regulator of mTOR, we performed an MTT assay to investigate the alternation of everolimus sensitivity. Interestingly, our results showed that the cell viability is higher in U50A-expressing cells compared to control cells under gradually-increased everolimus concentrations, indicating that expression of U50A leads to the decrease of drug sensitivity toward everolimus (Fig. 2a). The phenomenon of U50A-mediated everolimus desensitization was owing to the loss of target effect; that is, the drug target mTOR is lost in U50A-expressing cells which makes the cells become mTOR untargetable. Besides the considerable therapeutic benefit, patients resistant to hormone therapy may receive everolimus but eventually develop drug resistance. To mimic this clinical situation, we established the everolimus resistant cell line (EVR) from tamoxifen resistant (TR) breast cancer cells. EVR cells have higher cell viability compared to TR cells with increased everolimus concentration, indicating the successful establishment of everolimus resistance (Fig. 2b). As our previous data suggested that expression of U50A leads to the downregulation of mTOR and causes everolimus desensitization, we determined the U50A level in EVR cells. Consistently, the U50A level is elevated in EVR cells compared to TR cells (Fig. 2c) accompanied with decreased mTOR and p2448-mTOR expression (Fig. 2d). To verify the phenomena using clinical specimens, we collected a cohort that consisted of 37 breast cancer patients who received everolimus therapy. These patients were defined according to their outcome after everolimus treatment to be dissected into everolimus sensitive or resistant as described in Methods (Fig. 2e). U50A ISH was performed to detect these breast cancer tumors for dividing into U50Ahigh (Fig. 2f, U50A status, red) and U50Alow (Fig. 2f, U50A status, blue) groups. Among U50Ahigh tumors, 75 % of patients showed poor response to everolimus, whereas only 44 % of patients showed recurrence after everolimus treatment in U50Alow group, (Fig. 2g). The individual everolimus responses of each patient were shown in Fig. 2f (red: everolimus resistant; green: everolimus sensitive). The representative images of everolimus-resistant tumors showed higher expression of U50A expression than everolimus-sensitive tumors (Fig. 2h). Again, U50A level has a negative correlation with mTOR expression in this cohort, as individual staining scores of mTOR and p2448-mTOR shown in Fig. 2i demonstrated a statistical inverse correlation with U50A (Fig. 2i). These results supported that U50A expression correlates with poor response to everolimus owing to the loss of everolimus target mTOR, which makes U50A a potential predictive marker for everolimus response (Fig. 2j).
Fig. 2.

Effects of U50A on everolimus sensitivity.
(a) Effect of U50A on everolimus sensitivity. U50A-overexpressing MCF-7 cells were applied to cell viability assay under the treatment of indicated doses of everolimus. (b) Everolimus sensitivity of TR/MCF-7 and EVR/TR/MCF-7 cells. TR/MCF-7 and EVR/TR/MCF-7 cells were applied to cell viability assay under the treatment of indicated doses of everolimus. (c) U50A expression was validated in TR/MCF-7 and EVR/TR/MCF-7 cells. RNA was isolated and U50A RNA expression was analyzed by qPCR. (d) mTOR and p2448-mTOR expression in TR/MCF-7 and EVR/TR/MCF-7 cells. (e) Criteria of the breast cancer patients cohort collected in study. (f) Individual U50A ISH score with corresponding mTOR and p2448-mTOR IF score in the same patients were presented as heatmap. The everolimus response of the patients were showed in red dot (resistance) or green dot (sensitive). (g) Quantitated result of correlation between U50A and everolimus response. (h) Representative images of ISH staining of U50A in everolimus-resistant (P37 and P3) and everolimus-sensitive patients (P17 and P22). (i) Correlation between quantitated result of U50A ISH score and mTOR IF score in the breast cancer cohort according to the criteria in Fig. 2e. (j) Schematic representation of utilization of U50A as a predictive everolimus response marker. *P < 0.05, **P < 0.01,****P < 0.0001.
U50A transcriptionally downregulates mTOR through c-Myc
To discover the mechanism of U50A-mediated mTOR downregulation, first, we used cycloheximide (CHX) treatment to block de novo protein synthesis for protein stability assay. However, neither the protein stability of mTOR nor p2448-mTOR were changed in U50A-overexpressing cells upon CHX treatment in indicated time points (Fig. 3a-b). Therefore, the regulation in protein level was excluded, prompting us to investigate the messenger RNA (mRNA) alternation of mTOR. We found that mTOR mRNA is decreased in U50A-overexpressing cells (Fig. 3c), which suggested the mechanism of mTOR downregulation beyond unchanged protein stability (Fig. 3a-b and 1c). Based on the elevated U50A level in EVR cells (Fig. 2c), we also validated the mRNA level of mTOR, and the data consistently showed the reduced mTOR mRNA expression in EVR cells (Fig. 3d), suggesting that U50A-mediated mTOR inhibition is transcriptionally dependent.
Fig. 3.

Transcriptional suppression of mTOR by U50A-mediated downregulation of c-Myc.
The stability of mTOR (a) and p2448-mTOR (b) protein expression in U50A-overexpressing MCF-7 cells were collected under cycloheximide treatment at the indicated time points. The western blot results from replicate experiments were quantified and analyzed using two-way ANOVA. mTOR RNA expression was validated in U50A-overexpressing (c) and TR/MCF-7 and EVR/TR/MCF-7 (d) cells. RNA was isolated and mTOR mRNA expression was analyzed by qPCR. (e) Venn diagram showed the overlap of U50A-downregualted genes and predicted transcription factors of mTOR. (f) Gene set enrichment analysis (GSEA) of RNA sequencing data. Differential expression genes were analyzed by Genes Enrichment plot of GSEA in the oncogenic signature gene set. (***P < 0.001; FDR=0.05). Protein expression of c-Myc and c-Fos were investigated in U50A-overexprssing (g) and TR/MCF-7 and EVR/TR/MCF-7 cells (h). (i) C-Myc mRNA level in U50A-overexpressing MCF-7 cells. c-Myc was restored in U50A-overexpressing cells (j) and EVR/TR/MCF-7 cells (k), and mTOR expression was investigated. ***P < 0.001.
To find out the involved transcription factors, we crossed the two groups of genes; one group is U50A downregulated genes in our RNA sequence data, and another one is transcription factors that physically interacted with MTOR gene using ChIP-Atlas (https://chip-atlas.org/) (Fig. 3e). Two transcription factors, c-Myc and c-Fos, were selected as potential candidates for promoting mTOR mRNA which may be downregulated by U50A (Fig. 3e). Consistently, the c-Myc pathway was also found to be downregulated in RNA sequence data from EVR cells compared to TR cells (Fig. 3f). To investigate whether c-Myc and c-Fos are downstream regulators in U50A-mediated mTOR-inhibition, we determined the protein expression of both transcription factors. In U50A-overexpressing cells, decreased c-Myc and unchanged c-Fos were observed, indicating the involvement of c-Myc in U50A-suppressed mTOR expression (Fig. 3g). Moreover, a similar phenomenon was also observed in EVR cells that c-Myc expression is decreased along with unchanged c-Fos (Fig. 3h). We also observed a reduction in c-Myc mRNA expression in cells overexpressing U50A, indicating that U50A may transcriptionally downregulate c-Myc (Fig. 3i). The reverse mTOR expression was observed in c-Myc-restored U50A-overpexpressing cells, which indicates U50A downregulates mTOR through suppressing c-Myc expression and the same phenomena were also observed in EVR cells (Fig. 3j-k). Together with the clinical findings demonstrated in Fig. 1, Fig. 2, here we uncovered a U50A-suppressed transcriptional regulation on mTOR expression as well as its activity.
U50A mediates AKT activation and desensitization of EVR cells toward PI3K inhibitor
We investigated AKT activity as the well-known upstream activator of mTOR signaling. Surprisingly, unlike attenuated mTOR pathway, p-AKT is upregulated in U50A-overexpressing and EVR cells (Fig. 4a-b), which may be a compensatory effect caused by inhibited mTOR activity to reinforce the survival signal, or activated by independent upstream signal transducer bypass mTOR pathway. Considering that PI3K is the canonical activator of p-AKT, we treated the selective PI3Kα inhibitor alpelisib (BYL-719) to inhibit PI3K and investigated the effects of U50A on p-AKT. Still, the elevated p-AKT was observed in U50A-overexpressing cells in the presence of the FDA-approved PI3Kα inhibitor alpelisib (BYL-719), which indicates that U50A bypasses the PI3K pathway to sustain AKT activity (Fig. 4c). Moreover, BYL-719 resistance was observed in EVR cells as the colony forming ability of EVR cells was higher compared to TR cells (Fig. 4d-e).
Fig. 4.

U50A promotes AKT activation and leads to insensitivity of EVR cells to PI3K inhibitor treatment.
AKT activity was investigated in U50A-overexpressing (a) and TR/MCF-7 and EVR/TR/MCF-7 (b) cells. (c) AKT activity was investigated in U50A-overexpressing cells with BYL719 treatment. (d) Colony-forming assay were performed in TR/MCF-7 and EVR/TR/MCF-7 cells with indicated dose of BYL719. (e) Quantitated result of colony images in TR/MCF-7 and EVR/TR/MCF-7 cells. ****P < 0.0001.
U50A is everolimus-inducible in human breast cancer
In our study, we found that higher expression of U50A in primary tumors correlates with poor response to everolimus in patients (Fig. 2f-h) and directly contributes to everolimus insensitivity of cancer cells (Fig. 2a). In addition, we considered the possibility of U50A-mediated acquired resistance by investigating whether U50A expression is changed upon everolimus treatment. Interestingly, we observed that U50A is slightly induced after 24 h everolimus treatment with a more significant induction at 48 h, indicating the inducibility of U50A expression in cancer cell under everolimus stimulation (Fig. 5a). Meanwhile, mTOR mRNA, as well as mTOR and c-Myc protein expression were decreased, suggesting the acquired mechanism of U50A-mediated mTOR suppression stimulated by everolimus (Fig. 5b-c). To further investigate these phenomena in human breast cancer, we collected 7 paired tumors before or after everolimus therapy from the same patients. U50A ISH score was elevated after everolimus therapy in 5 out of 7 patients as the representative images were shown (Fig. 5d-e). Among the 5 paired tumors with elevated U50A expression (Fig. 5d-e, Patient Number P18, P2, P8, P10 and P23), there were patients with decreased mTOR expression (3 out of 5 patients, Fig. 5f, Patient Number P18, P8 and P23) and p2448-mTOR expression (4 out of 5 patients, (Fig. 5g, Patient Number P2, P8, P10 and P23). As for the two paired tumors with unchanged U50A expression (Fig. 5d-e, Patient Number P27 and P3), neither decreased mTOR expression (Fig. 5f, Patient Number P27 and P3) nor decreased p2448-mTOR expression (Fig. 5g, Patient Number P27 and P3) were observed. Taken together, this study showed that either the endogenous or the everolimus-induced U50A expression may contribute to mTOR inhibition and leads to everolimus resistance due to the loss of drug target in human breast cancer. (Fig. 6).
Fig. 5.

U50A is induced by everolimus treatment in human breast cancer.
U50A (a) and mTOR (b) RNA expression were investigated in everolimus (500uM)-treated MCF-7 cells for 24 and 48 h. (c) mTOR and c-Myc protein expression were investigated in everolimus (250 μM and 500 μM)-treated MCF-7 cells. (d) U50A ISH score in patients before and after receiving everolimus therapy (paired sample from the same patient) showed in heatmap. Paired t-test was used. (e) Individual images of U50A ISH in paired patient samples were shown. mTOR (f) and p2448-mTOR (g) IF score in patients before and after receiving everolimus therapy (paired sample from the same patient) shown in heatmap. *P < 0.05.
Fig. 6.

Schematic representation of U50A-mediated mTOR inhibitor resistance.
Discussion
Everolimus, the mTOR inhibitor, is the rapamycin derivative developed last decades to inhibit mTOR and mTORC1 activities, which are applied in different human malignancies, including advanced breast cancers [9]. Though mTOR inhibitors shed the light on hormone therapy-resistant patients, during the medication course, poor response or development of resistance to mTOR inhibitors is inevitable. Common resistant mechanism is the reactivation of upstream or downstream signal cascade of mTOR pathway. Higher Akt phosphorylation has been observed in tumors with everolimus medication [27]. On the other hand, other proliferative pathways, such as PI3K or RAS/RAF/MEK/MAPK, are alternatively overactivated as a compensatory effect of inhibited mTOR signal [28]. Since hypoxia inhibits mTORC1 activity, hypoxic region of tumors with low mTOR activity also showed resistance properties to mTOR inhibitors [28]. In our study, we found that U50A-overexpressing cells showed resistance to everolimus (Fig. 2a), in reason that the mTOR is downregulated by U50A as a loss of drug effect (Fig. 1c). In fact, inverse correlation between U50A and mTOR expression was also observed in breast tumors (Fig. 1d). Furthermore, the U50A inhibits mTOR through the transcriptional level by downregulating c-Myc, the transcriptional factor of mTOR (Fig. 3g). Meanwhile, the U50A expression is elevated in everolimus-resistant cells and breast tumors (Fig. 2g) with downregulated mTOR expression (Fig. 2d, f, i). As a common mechanism, phosphorylated Akt in these cells is indeed activated but through a PI3K-independent manner which causes the resistance to PI3K inhibitor, BYL719 (Fig. 4f). In view of the urgency of breast cancer patients to receive medication after hormone therapy resistance, it is crucial to predict the efficiency of drug. Hence, the U50A expression may be a potential marker in breast tumors for everolimus effectiveness. 75 % of patients with U50Ahigh expression eventually showed resistance to everolimus. On the other hand, U50A is also inducible by everolimus. Therefore, monitoring the U50A expression in patients after receiving everolimus therapy is another potential supervising way to consider the everolimus effectiveness.
SnoRNAs, are a type of inconspicuous but essential non-coding RNAs within cells to maintain basic cellular function [29]. Though they execute their normal function, aberrant expression is found in numerous diseases, including malignancy. For example, SNORA42 showed the oncogenic property in lung cancer tumorigenesis [30]; SNORD76, on the other hand, acts as tumor suppressor in glioblastoma [24]. Plenty of dysregulated expression of snoRNAs has been reported in cancers which associated with cancer properties. However, the impact of snoRNA in cellular signaling is relatively unclear. In our finding, U50A induced AKT activation in everolimus resistance mechanism, which adds different aspect of snoRNA influence in signal transduction. Overall, our research not only showed the potential benefit in clinical but also explored the new function of snoRNAs in cellular mechanism.
Ethics approval and consent to participate
Patient samples are from permitted institute, the Human Biobank of National Cheng Kung University Hospital (NCKUH). Acquirement of patient samples are all followed by NCKUH IRB. Waivers of informed consent are approved by IRB B-ER-110-520 from NCKU Hospital.
Consent for publication
Not applicable.
Availability of data and material
The datasets used and/or analyzed during the current study are available from the corresponding author.
Funding
This study was supported by the Nation Science and Technology Council (111-2314-B-006 -096 -MY3).
Declaration of competing interest
The authors declare that they have no known competing financial interests or personal relationships that could have appeared to influence the work reported in this paper.
Acknowledgements
We are grateful for the support from the Human Biobank, Research Center of Clinical Medicine, and the Cancer Data Bank of NCKU Hospital.
Contributor Information
Jui-Hung Tsai, Email: cych07233@gmail.com, n100128@mail.hosp.ncku.edu.tw.
Pai-Sheng Chen, Email: bio.benson@gmail.com, z10108021@ncku.edu.tw.
References
- 1.Dai X., et al. Breast cancer intrinsic subtype classification, clinical use and future trends. Am. J. Cancer Res. 2015;5(10):2929–2943. [PMC free article] [PubMed] [Google Scholar]
- 2.Clemons M., Goss P. Estrogen and the risk of breast cancer. N. Engl. J. Med. 2001;344(4):276–285. doi: 10.1056/NEJM200101253440407. [DOI] [PubMed] [Google Scholar]
- 3.Liang J., Shang Y. Estrogen and cancer. Annu. Rev. Physiol. 2013;75:225–240. doi: 10.1146/annurev-physiol-030212-183708. [DOI] [PubMed] [Google Scholar]
- 4.Russo J., Russo I.H. The role of estrogen in the initiation of breast cancer. J. Steroid. Biochem. Mol. Biol. 2006;102(1–5):89–96. doi: 10.1016/j.jsbmb.2006.09.004. [DOI] [PMC free article] [PubMed] [Google Scholar]
- 5.Lumachi F., Santeufemia D.A., Basso S.M. Current medical treatment of estrogen receptor-positive breast cancer. World J. Biol. Chem. 2015;6(3):231–239. doi: 10.4331/wjbc.v6.i3.231. [DOI] [PMC free article] [PubMed] [Google Scholar]
- 6.Musgrove E.A., Sutherland R.L. Biological determinants of endocrine resistance in breast cancer. Nat. Rev. Cancer. 2009;9(9):631–643. doi: 10.1038/nrc2713. [DOI] [PubMed] [Google Scholar]
- 7.Riggins R.B., et al. Pathways to tamoxifen resistance. Cancer Lett. 2007;256(1):1–24. doi: 10.1016/j.canlet.2007.03.016. [DOI] [PMC free article] [PubMed] [Google Scholar]
- 8.Boulay A., et al. Dual inhibition of mTOR and estrogen receptor signaling in vitro induces cell death in models of breast cancer. Clin. Cancer Res. 2005;11(14):5319–5328. doi: 10.1158/1078-0432.CCR-04-2402. [DOI] [PubMed] [Google Scholar]
- 9.Li H., et al. Targeting PI3K/AKT/mTOR Signaling Pathway in Breast Cancer. Cancers. 2021;13(14) doi: 10.3390/cancers13143517. [DOI] [PMC free article] [PubMed] [Google Scholar]
- 10.Miricescu D., et al. PI3K/AKT/mTOR Signaling Pathway in Breast Cancer: from Molecular Landscape to Clinical Aspects. Int. J. Mol. Sci. 2020;22(1) doi: 10.3390/ijms22010173. [DOI] [PMC free article] [PubMed] [Google Scholar]
- 11.Bahrami A., et al. The Therapeutic Potential of PI3K/Akt/mTOR Inhibitors in Breast Cancer: rational and Progress. J. Cell Biochem. 2018;119(1):213–222. doi: 10.1002/jcb.26136. [DOI] [PubMed] [Google Scholar]
- 12.Steelman L.S., et al. The therapeutic potential of mTOR inhibitors in breast cancer. Br. J. Clin. Pharmacol. 2016;82(5):1189–1212. doi: 10.1111/bcp.12958. [DOI] [PMC free article] [PubMed] [Google Scholar]
- 13.Vicier C., et al. Clinical development of mTOR inhibitors in breast cancer. Breast. Cancer Res. 2014;16(1):203. doi: 10.1186/bcr3618. [DOI] [PMC free article] [PubMed] [Google Scholar]
- 14.Saxton R.A., Sabatini D.M. mTOR Signaling in Growth, Metabolism, and Disease. Cell. 2017;168(6):960–976. doi: 10.1016/j.cell.2017.02.004. [DOI] [PMC free article] [PubMed] [Google Scholar]
- 15.Zou Z.L., et al. mTOR signaling pathway and mTOR inhibitors in cancer: progress and challenges. Cell Biosci. 2020;10(1) doi: 10.1186/s13578-020-00396-1. [DOI] [PMC free article] [PubMed] [Google Scholar]
- 16.Chiarini F., et al. Advances in understanding the mechanisms of evasive and innate resistance to mTOR inhibition in cancer cells. Biochimica Et Biophysica Acta-Mol. Cell Res. 2019;1866(8):1322–1337. doi: 10.1016/j.bbamcr.2019.03.013. [DOI] [PubMed] [Google Scholar]
- 17.Filipowicz W., Pogacic V. Biogenesis of small nucleolar ribonucleoproteins. Curr. Opin. Cell Biol. 2002;14(3):319–327. doi: 10.1016/s0955-0674(02)00334-4. [DOI] [PubMed] [Google Scholar]
- 18.Dragon, F., V. Lemay, and C. Trahan, snoRNAs: biogenesis, Structure and Function, in eLS. 2006.
- 19.Dragon, F.o., V. Lemay, and C. Trahan, snoRNAs: biogenesis, Structure and Function. 2006.
- 20.Lui L., Lowe T. Small nucleolar RNAs and RNA-guided post-transcriptional modification. Essays Biochem. 2013;54:53–77. doi: 10.1042/bse0540053. [DOI] [PubMed] [Google Scholar]
- 21.Thorenoor N., Slaby O. Small nucleolar RNAs functioning and potential roles in cancer. Tumour. Biol. 2015;36(1):41–53. doi: 10.1007/s13277-014-2818-8. [DOI] [PubMed] [Google Scholar]
- 22.Williams G.T., Farzaneh F. Are snoRNAs and snoRNA host genes new players in cancer? Nat. Rev. Cancer. 2012;12(2):84–88. doi: 10.1038/nrc3195. [DOI] [PubMed] [Google Scholar]
- 23.Mei Y.P., et al. Small nucleolar RNA 42 acts as an oncogene in lung tumorigenesis. Oncogene. 2012;31(22):2794–2804. doi: 10.1038/onc.2011.449. [DOI] [PMC free article] [PubMed] [Google Scholar]
- 24.Chen L., et al. SNORD76, a box C/D snoRNA, acts as a tumor suppressor in glioblastoma. Sci. Rep. 2015;5:8588. doi: 10.1038/srep08588. [DOI] [PMC free article] [PubMed] [Google Scholar]
- 25.Siprashvili Z., et al. The noncoding RNAs SNORD50A and SNORD50B bind K-Ras and are recurrently deleted in human cancer. Nat. Genet. 2016;48(1):53. doi: 10.1038/ng.3452. -+ [DOI] [PMC free article] [PubMed] [Google Scholar]
- 26.Li J.N., et al. Expression of SnoRNA U50A is associated with better prognosis and prolonged mitosis in breast cancer. Cancers. 2021;13(24) doi: 10.3390/cancers13246304. [DOI] [PMC free article] [PubMed] [Google Scholar]
- 27.Skeen J.E., et al. Akt deficiency impairs normal cell proliferation and suppresses oncogenesis in a p53-independent and mTORC1-dependent manner. Cancer Cell. 2006;10(4):269–280. doi: 10.1016/j.ccr.2006.08.022. [DOI] [PubMed] [Google Scholar]
- 28.Faes S., Demartines N., Dormond O. Resistance to mTORC1 Inhibitors in Cancer Therapy: from Kinase Mutations to Intratumoral Heterogeneity of Kinase Activity. Oxid. Med. Cell Longev. 2017;2017 doi: 10.1155/2017/1726078. [DOI] [PMC free article] [PubMed] [Google Scholar]
- 29.Kufel J., Grzechnik P. Small Nucleolar RNAs Tell a Different Tale. Trends Genet. 2019;35(2):104–117. doi: 10.1016/j.tig.2018.11.005. [DOI] [PubMed] [Google Scholar]
- 30.Okugawa Y., et al. SNORA42-an oncogenic small nucleolar RNA, and a promising prognostic biomarker in human colorectal cancer. Gastroenterology. 2015;148(4) S17-S17. [Google Scholar]
Associated Data
This section collects any data citations, data availability statements, or supplementary materials included in this article.
Data Availability Statement
The datasets used and/or analyzed during the current study are available from the corresponding author.