

Abstract
Background:
Traumatic injury is a leading cause of death and disability among US workers. Severe injuries are less subject to systematic ascertainment bias related to factors such as reporting barriers, inpatient admission criteria, and workers’ compensation coverage. A state-based occupational health indicator (OHI #22) was initiated in 2012 to track work-related severe traumatic injury hospitalizations. After 2015, OHI #22 was reformulated to account for the transition from the International Classification of Diseases, 9th Revision, Clinical Modification (ICD-9-CM) to ICD-10-CM. This study describes rates and trends in OHI #22, alongside corresponding metrics for all work-related hospitalizations.
Methods:
Seventeen states used hospital discharge data to calculate estimates for calendar years 2012–2019. State-panel fixed-effects regression was used to model linear trends in annual work-related hospitalization rates, OHI #22 rates, and the proportion of work-related hospitalizations resulting from severe injuries. Models included calendar year and pre- to post-ICD-10-CM transition.
Results:
Work-related hospitalization rates showed a decreasing monotonic trend, with no significant change associated with the ICD-10-CM transition. In contrast, OHI #22 rates showed a monotonic increasing trend from 2012 to 2014, then a significant 50% drop, returning to a near-monotonic increasing trend from 2016 to 2019. On average, OHI #22 accounted for 12.9% of work-related hospitalizations before the ICD-10-CM transition, versus 9.1% post-transition.
Conclusions:
Although hospital discharge data suggest decreasing work-related hospitalizations over time, work-related severe traumatic injury hospitalizations are apparently increasing. OHI #22 contributes meaningfully to state occupational health surveillance efforts by reducing the impact of factors that differentially obscure minor injuries; however, OHI #22 trend estimates must account for the ICD-10-CM transition-associated structural break in 2015.
Keywords: hospital discharge data, injury surveillance, International Classification of Diseases, occupational injuries, trauma severity indices, workers’ compensation
1 |. BACKGROUND
Work-related traumatic injury is a leading cause of death and disability among US workers.1 An estimated 1.8 million workers sustained work-related injuries and were treated in emergency departments during 2020.1 Traumatic injury can lead to long-term pain and disability and is very costly for workers, employers, workers’ compensation (WC) systems, and society as a whole.2–4 The total national medical and productivity cost for fatal and nonfatal occupational injuries has been estimated at $192 billion annually.4
Accurate occupational injury surveillance is needed for understanding patterns in risks to workers, prioritizing safety efforts, evaluating interventions, and measuring the burden of occupational injury over time. Unfortunately, most of the data sources used for tracking work-related injuries have well-documented shortcomings, and many barriers to complete surveillance have been increasing over time. These barriers include constricting WC coverage, changes in the covered workforce, changes in employer reporting requirements, and under-reporting by workers, employers, and health care providers.5–16 Trend estimates based on hospital discharge data are subject to additional bias related to WC billing practices (identifying work-relatedness in hospital discharge data typically relies on WC as payer),12,17–19 as well as temporal changes in hospital admission criteria.15,16,20,21
Prior research suggests that the ascertainment barriers described above differentially inhibit the capture of minor injuries compared to severe injuries.11,22 For example, several studies have shown that decreasing trends in minor traumatic brain injury more likely reflected temporal changes in probability of hospital admission than true decreases in population incidence.15,16,20 Over time, the net result of these barriers to injury ascertainment can be that trend estimates become biased downward, erroneously suggesting a decrease in occupational injuries, when in reality the observed decrease is the product of a systematic failure to capture occupational injuries. The National Center for Health Statistics stated, “The incidence of injury would be better reflected by an indicator of the injury (e.g., injuries meeting a severity threshold) that is ‘free’ of extraneous factors like utilization and service delivery.”23 Accumulating evidence supports severity restriction as an important approach to mitigate the impact of changing health care delivery, utilization, and billing patterns on observed injury trends.9–12,15–22
The Council of State and Territorial Epidemiologists (CSTE) Occupational Health Indicators (OHIs) Workgroup, together with the National Institute for Occupational Safety and Health (NIOSH), maintains a series of OHIs that provide a core set of data for informing state-level workplace injury and illness prevention programs.24,25 State surveillance staff calculate the OHIs from available state-level data using standardized case definitions, which enables comparison of trends in occupational health and risk status both within and across states. Before adopting new OHIs (via consensus recommendation of the CSTE Occupational Health Surveillance Subcommittee), OHIs are validated using data from participating states and undergo expert review by CSTE and NIOSH workgroup members. As of this writing, 29 states report at least some OHI data to CSTE annually; however, states have some flexibility regarding how many and which OHIs they choose to calculate and report.
Several CSTE OHIs are based on hospital discharge data.25 One of these—OHI #2 “Work-Related Hospitalizations”—represents the overall number and rate of work-related (i.e., payer identified as WC) inpatient hospitalizations in a given state each calendar year. This provides a high-level snapshot of occupational injury/illness independent from employer reporting data; however, for the reasons noted above, this OHI may still incorporate several temporal biases. A related indicator—OHI #22 “Work-Related Severe Traumatic Injury Hospitalizations”—was developed by some members of our current research team specifically to avoid some of the temporal ascertainment biases observed in work-related hospitalizations by restricting the new OHI to traumatic injuries and incorporating an injury severity threshold (the previous team included J. M. S. and S. M. B., along with several others not involved in the current study).22 Hospital admissions for severe injuries are less likely than overall admissions to be affected by reluctance to seek care, pressure against reporting work-related injuries, WC billing practices, or changes in admission criteria. Hence, severe injury hospitalizations may provide a more accurate estimate of “true” trends in occupational injuries.11,22
CSTE adopted OHI #22 in 2014, for use with hospital discharge data from 2012 forward.22 OHI #22 was widely implemented; by 2014, data for OHI #22 had been posted on the CSTE website for 26 states—as many as for OHI #2. OHI #22 incorporated a list of severe injury diagnosis codes to use as a case definition. These diagnosis codes were based on the International Classification of Diseases, 9th Revision, Clinical Modification (ICD-9-CM) lexicon—a coding system that standardizes diagnostic and procedure coding for health care utilization and billing purposes.22 In October 2015, US health care systems switched from ICD-9-CM—in use since 1979—to ICD-10-CM.26–28 The number of diagnostic codes increased dramatically, especially for injury diagnoses; injury codes increased from roughly 2600 ICD-9-CM codes to over 43,000 ICD-10-CM codes.26,28 Although methodological assessments suggested that coding discontinuities in 2015 could pose substantial issues for longitudinal research and surveillance, including the possibility of an abrupt change (structural break) in rate and trend estimates,29,30 the ICD-10-CM transition also brought potential for improved surveillance. For example, ICD-10-CM codes contain up to seven characters instead of five digits, which provide newfound ability to distinguish initial from subsequent encounters and sequelae, and additional detail on body part laterality and injury severity.26–28
This transition made OHI #22 unusable as originally developed, and states could not generate OHI #22 beginning with 2015 hospital discharge data. Most importantly, there was not a one-to-one correspondence between ICD-9-CM and ICD-10-CM for many diagnosis codes, and comparable injury severity levels were not consistently retained in publicly available crosswalks.29 Therefore, it was not possible simply to translate the original list of severe injuries from ICD-9-CM to ICD-10-CM codes. OHI #22 needed to be reformulated using a new list of ICD-10-CM severe injury codes. The updated OHI #22 used a modified method for identifying severe injuries (described in detail below) and incorporated a much longer list of injury diagnosis codes.
The objectives of this descriptive study were to: (1) describe the updated ICD-10-CM severe injury list that was formulated for OHI #22, (2) present annual rates and trends for OHI #2 and OHI #22 from 2012 through 2019, and (3) document any abrupt structural break in rates or trends associated with the transition from ICD-9-CM to ICD-10-CM in 2015. The severe injuries captured by OHI #22 represent a subset of the overall work-related hospitalizations captured by OHI #2. We assessed change in the proportion of OHI #2 hospitalizations represented by the subset of OHI #22 hospitalizations before and after the ICD transition, hypothesizing that this proportion would: (1) gradually increase over time, both before and after 2015 as minor injuries increasingly were not captured in hospital discharge records (in contrast to more consistent capture of severe injuries); and (2) abruptly drop in level after 2015 (due to the ICD-10-CM severe injury case definition being both more specific and excluding subsequent encounters and sequelae). A secondary objective was to take advantage of surveillance data collected over an 8-year period to assess whether measuring severe traumatic injuries adds value over simply measuring overall hospitalizations in occupational surveillance programs, and whether OHI #22 data collected following the ICD transition continue to support our initial hypothesis—that an injury severity threshold can improve accuracy of occupational injury trend estimates.
2 |. MATERIALS AND METHODS
2.1 |. Data sources
We used existing annual rates for OHI #2 and OHI #22, generated by state-based surveillance programs. Most of these rates were publicly available on the CSTE OHI website.31 We included calendar years 2012 (when OHI #22 was initiated) through 2019 (most recent available). Data for OHI #22 were not collected for 2015, due to the transition from ICD-9-CM to ICD-10-CM in October 2015. An updated case definition and guidance for OHI #22 were approved by CSTE in 2022, for use with 2019 data. Therefore, states did not submit data to CSTE for this indicator for the years 2016 through 2018. However, we compiled OHI #22 data for 2016 through 2018 from states that voluntarily participated in the validation process for the updated OHI #22 case definition, or that voluntarily submitted data explicitly for this study. We obtained complete data for 17 states (Connecticut, Georgia, Illinois, Kentucky, Louisiana, Massachusetts, Michigan, Minnesota, Montana, New Hampshire, New Jersey, New York, North Carolina, Oregon, Pennsylvania, Texas, Washington). All rates were generated from population-based state hospital discharge databases and calculated by state surveillance staff following OHI guidance.25 This study did not involve any individual-level or individually identifiable data.
2.2 |. OHIs
Both OHI #2 “Work-Related Hospitalizations” and OHI #22 “Work-Related Severe Traumatic Injury Hospitalizations” were calculated by state surveillance staff according to the OHI guidance manual.25 Data were organized by calendar year, and both indicators were calculated using state-based hospital discharge data for in-state hospitalizations with WC listed as primary payer, among state residents aged 16 years or older. OHI #22 incorporates a critical additional criterion—the first-listed diagnosis (i.e., principal diagnosis, primary diagnosis, admitting diagnosis) must be contained in a specified list of severe traumatic injuries (described below). For both OHI #2 and OHI #22, rates per 100,000 employed persons aged 16 years or older are calculated for each corresponding calendar year using employed civilian labor force denominators from the Bureau of Labor Statistics Current Population Survey, specifically Table 14 in the annual Geographic Profiles of Employment and Unemployment.32 Detailed guidance is available in the OHI guidance manual.25
2.3 |. Development of the OHI #22 severe injury lists
The Association for the Advancement of Automotive Medicine (AAAM) developed the Abbreviated Injury Scale (AIS),33 a well-validated approach to injury severity scoring that predicts mortality and work disability.34–41 The AIS is a consensus-driven anatomically based system that scores initial injury severity from 1 (minor) to 6 (maximal) based on threat to life, and is scored independently of comorbidity and other factors influencing hospitalization.42 While trauma registries typically contain AIS scores, state hospital discharge databases used for OHIs typically do not. Therefore, to facilitate implementation by state surveillance programs, OHI #22 necessitated the development of diagnosis-based severe injury lists.
2.3.1 |. ICD-9-CM severe injury list
The original ICD-9-CM-based severe injury list was developed by a previous research team (including J. M. S. and S. M. B.). This team developed a severe injury case definition consisting of a list of ICD-9-CM diagnosis codes for traumatic injuries meeting an identified severity threshold. AIS scores were estimated for traumatic injury ICD-9-CM codes using three independent methods (an expert coder and two distinct computer programs—ICDMAP-9043 and ICDPIC44). The previous team then reviewed all diagnosis codes, discussed discrepancies and likelihood of hospital admission from the diagnoses in question, and classified unscored codes.22 The goal was to identify injuries roughly corresponding to an AIS of 3 (serious) or above. Such injuries carry a high probability of hospital admission, thus systematic ascertainment bias due to temporal trends in hospital admission practices should be minimized for this subset.9 Further details about the development and validation process, as well as a full list of the ICD-9-CM severe injury diagnosis codes, are available elsewhere.22,45
2.3.2 |. ICD-10-CM severe injury list
When ICD-10-CM was implemented, a new severe injury list for OHI #22 was needed. The proliferation of diagnostic codes in the ICD-10-CM lexicon, and the resource-intensive nature of linking diagnostic codes to AIS scores, precluded duplicating the original process for the new list. Instead, severe injuries were identified using a proprietary ICD map developed by AAAM (version 2.0, 2018). The ICD map linked ICD-10-CM Chapter 19 injury diagnoses to AIS scores based on AIS 2005 Update 2008,46 according to consensus recommendations by an expert panel.47 J. M. S. used this ICD map to extract a list of diagnosis codes for severe injuries (defined as those with an AIS score of 3 or above). Only initial encounter diagnosis codes were included (those having a seventh character of A, B, or C). This restriction to initial encounters was not possible using ICD-9-CM codes due to the more limited coding structure. This restriction to initial encounters (vs. subsequent encounters and sequelae) for the updated OHI #22 case definition was expected to improve specificity for surveillance purposes, but also represented a change from the case definitions for both OHI #2 and the ICD-9-CM-based OHI #22, as neither involved excluding subsequent encounters and sequelae. The resulting updated severe injury list was included with updated OHI #22 guidance.25
2.4 |. Data analysis
Descriptive summaries of (1) annual counts and rates for OHI #2 and OHI #22, and (2) annual OHI #22/OHI #2 proportions, were produced separately for each of the 17 participating states; annual rates and proportions were also averaged across the 17 states. Three separate state-panel fixed-effects regression models were used to model linear trends in: (1) annual OHI #2 rates, (2) annual OHI #22 rates, and (3) annual OHI #22/OHI #2 proportions.48–50 All analyses were conducted using Stata/SE 16.1 for Windows.51 The models accounted for state panel structure (using the Stata command -xtreg- with fixed effects for states), and incorporated robust variance estimates. Each model included variables for the calendar year (continuous) and for pre- to post-ICD lexicon transition (binary). In addition to the hypothesized change in level following the lexicon transition, we also tested for a possible change in trend by including an interaction term (year × lexicon version) in each model. All statistical tests were two-tailed, with statistical significance defined as p < 0.05.
3 |. RESULTS
Annual hospitalization counts for OHI #2 “Work-Related Hospitalizations” and OHI #22 “Work-Related Severe Traumatic Injury Hospitalizations” are presented by state in Table 1. The annual state-based proportions of OHI #2 hospitalizations represented by the subset of OHI #22 hospitalizations are presented in Table 2. These proportions ranged from a minimum of 0.042 (Connecticut in 2016) to a maximum of 0.202 (Montana in 2014). Trends in mean annual proportions for the 17 states combined are presented in Figure 1. On average, OHI #22 accounted for 12.9% of all work-related hospitalizations before the ICD-10-CM transition, versus 9.1% post-transition. Annual hospitalization rates per 100,000 employed persons for OHI #2 and OHI #22 are presented in Table 3. State-based trends in these rates are depicted in Figure 2, and trends in rates averaged across the 17 states are depicted in Figure 3.
TABLE 1.
OHI #2 “Work-Related Hospitalizations” and OHI #22 “Work-Related Severe Traumatic Injury Hospitalizations”: Annual counts, by state (2012–2019).
| State | OHI | 2012 | 2013 | 2014 | 2015a | 2016 | 2017 | 2018 | 2019 |
|---|---|---|---|---|---|---|---|---|---|
| Connecticut | OHI #2 | 1951 | 1710 | 1728 | 1566 | 1410 | 1443 | 1283 | 1289 |
| OHI #22 | 145 | 155 | 148 | n/a | 59 | 81 | 63 | 89 | |
|
| |||||||||
| Georgia | OHI #2 | 2717 | 2485 | 2180 | 2182 | 2327 | 2189 | 2246 | 1944 |
| OHI #22 | 340 | 361 | 336 | n/a | 198 | 193 | 183 | 173 | |
|
| |||||||||
| Illinois | OHI #2 | 8991 | 7142 | 10,426 | 4679 | 4562 | 2961 | 4090 | 3541 |
| OHI #22 | 501 | 822 | 803 | n/a | 263 | 276 | 294 | 286 | |
|
| |||||||||
| Kentucky | OHI #2 | 1694 | 1369 | 1640 | 1520 | 1346 | 1416 | 1407 | 1446 |
| OHI #22 | 216 | 166 | 199 | n/a | 111 | 114 | 134 | 131 | |
|
| |||||||||
| Louisiana | OHI #2 | 1598 | 1640 | 1595 | 1502 | 1263 | 1550 | 1475 | 1441 |
| OHI #22 | 200 | 204 | 269 | n/a | 143 | 131 | 143 | 120 | |
|
| |||||||||
| Massachusetts | OHI #2 | 2285 | 2256 | 2128 | 2090 | 2154 | 2075 | 1943 | 1935 |
| OHI #22 | 313 | 325 | 348 | n/a | 179 | 170 | 158 | 174 | |
|
| |||||||||
| Michigan | OHI #2 | 2984 | 2827 | 2557 | 2494 | 2306 | 2377 | 2238 | 2205 |
| OHI #22 | 424 | 479 | 445 | n/a | 238 | 266 | 248 | 294 | |
|
| |||||||||
| Minnesota | OHI #2 | 1023 | 2322 | 1868 | 1760 | 1852 | 1858 | 1822 | 1748 |
| OHI #22 | 132 | 276 | 264 | n/a | 154 | 157 | 156 | 174 | |
|
| |||||||||
| Montana | OHI #2 | 526 | 587 | 534 | 444 | 396 | 391 | 358 | 464 |
| OHI #22 | 98 | 113 | 108 | n/a | 43 | 37 | 34 | 33 | |
|
| |||||||||
| North Carolina | OHI #2 | 2868 | 2892 | 2520 | 2396 | 2457 | 2315 | 2261 | 2318 |
| OHI #22 | 385 | 411 | 417 | n/a | 356 | 376 | 434 | 428 | |
|
| |||||||||
| New Hampshire | OHI #2 | 242 | 263 | 235 | 203 | 242 | 262 | 288 | 253 |
| OHI #22 | 28 | 29 | 25 | n/a | 18 | 31 | 42 | 31 | |
|
| |||||||||
| New Jersey | OHI #2 | 3945 | 3937 | 3900 | 3753 | 3539 | 3178 | 3220 | 4199 |
| OHI #22 | 366 | 423 | 443 | n/a | 220 | 186 | 233 | 232 | |
|
| |||||||||
| New York | OHI #2 | 14,169 | 13,676 | 13,371 | 12,103 | 14,053 | 14,720 | 15,325 | 12,465 |
| OHI #22 | 805 | 936 | 1014 | n/a | 721 | 715 | 751 | 741 | |
|
| |||||||||
| Oregon | OHI #2 | 1472 | 1167 | 1242 | 1191 | 1063 | 1084 | 1010 | 920 |
| OHI #22 | 203 | 187 | 204 | n/a | 110 | 124 | 109 | 140 | |
|
| |||||||||
| Pennsylvania | OHI #2 | 7030 | 6636 | 6170 | 5575 | 4938 | 4570 | 4523 | 4282 |
| OHI #22 | 892 | 842 | 902 | n/a | 365 | 376 | 424 | 405 | |
|
| |||||||||
| Texas | OHI #2 | 7903 | 7816 | 7997 | 7352 | 6974 | 6487 | 6850 | 6308 |
| OHI #22 | 1344 | 1370 | 1403 | n/a | 563 | 602 | 697 | 646 | |
|
| |||||||||
| Washington | OHI #2 | 4747 | 4258 | 3707 | 3367 | 3074 | 3082 | 2754 | 2543 |
| OHI #22 | 434 | 428 | 408 | n/a | 210 | 224 | 218 | 215 | |
Abbreviation: OHI, Occupational Health Indicator.
OHI #22 data were not available for 2015, due to the International Classification of Diseases lexicon transition as of October 1, 2015.
TABLE 2.
OHI #2 “Work-Related Hospitalizations” and OHI #22 “Work-Related Severe Traumatic Injury Hospitalizations”: Annual proportions (OHI #22 count/OHI #2 count), by state (2012–2019).
| State | 2012 | 2013 | 2014 | 2015a | 2016 | 2017 | 2018 | 2019 |
|---|---|---|---|---|---|---|---|---|
| Connecticut | 0.074 | 0.091 | 0.086 | n/a | 0.042 | 0.056 | 0.049 | 0.069 |
| Georgia | 0.125 | 0.145 | 0.154 | n/a | 0.085 | 0.088 | 0.081 | 0.089 |
| Illinois | 0.056 | 0.115 | 0.077 | n/a | 0.058 | 0.093 | 0.072 | 0.081 |
| Kentucky | 0.128 | 0.121 | 0.121 | n/a | 0.082 | 0.081 | 0.095 | 0.091 |
| Louisiana | 0.125 | 0.124 | 0.169 | n/a | 0.113 | 0.085 | 0.097 | 0.083 |
| Massachusetts | 0.137 | 0.144 | 0.164 | n/a | 0.083 | 0.082 | 0.081 | 0.09 |
| Michigan | 0.142 | 0.169 | 0.174 | n/a | 0.103 | 0.112 | 0.111 | 0.133 |
| Minnesota | 0.129 | 0.119 | 0.141 | n/a | 0.083 | 0.084 | 0.086 | 0.100 |
| Montana | 0.186 | 0.193 | 0.202 | n/a | 0.109 | 0.095 | 0.095 | 0.071 |
| North Carolina | 0.134 | 0.142 | 0.165 | n/a | 0.145 | 0.162 | 0.192 | 0.185 |
| New Hampshire | 0.116 | 0.110 | 0.106 | n/a | 0.074 | 0.118 | 0.146 | 0.123 |
| New Jersey | 0.093 | 0.107 | 0.114 | n/a | 0.062 | 0.059 | 0.072 | 0.055 |
| New York | 0.057 | 0.068 | 0.076 | n/a | 0.051 | 0.049 | 0.049 | 0.059 |
| Oregon | 0.138 | 0.160 | 0.164 | n/a | 0.103 | 0.114 | 0.108 | 0.152 |
| Pennsylvania | 0.127 | 0.127 | 0.146 | n/a | 0.074 | 0.082 | 0.094 | 0.095 |
| Texas | 0.170 | 0.175 | 0.175 | n/a | 0.081 | 0.093 | 0.102 | 0.102 |
| Washington | 0.091 | 0.101 | 0.110 | n/a | 0.068 | 0.073 | 0.079 | 0.085 |
Abbreviation: OHI, Occupational Health Indicator.
Proportions for 2015 could not be calculated because OHI #22 data were not available for 2015, due to the International Classification of Diseases lexicon transition as of October 1, 2015.
FIGURE 1.

Annual OHI #22 “Work-Related Severe Traumatic Injury Hospitalizations” (counts) as a proportion of annual OHI #2 “Work-Related Hospitalizations” (counts), averaged across 17 states (2012–2019). OHI #22 data not available for 2015, due to the International Classification of Diseases lexicon transition as of October 1, 2015. OHI, Occupational Health Indicator.
TABLE 3.
OHI #2 “Work-Related Hospitalizations” and OHI #22 “Work-Related Severe Traumatic Injury Hospitalizations”: Annual rates per 100,000 employed persons aged 16 years or older, by state (2012–2019).
| State | OHI | 2012 | 2013 | 2014 | 2015a | 2016 | 2017 | 2018 | 2019 |
|---|---|---|---|---|---|---|---|---|---|
| Mean (17 states) | OHI #2 | 91.73 | 88.20 | 85.96 | 73.58 | 69.91 | 67.78 | 66.83 | 64.78 |
| OHI #22 | 10.21 | 11.09 | 11.15 | n/a | 5.55 | 5.64 | 5.84 | 5.82 | |
|
| |||||||||
| Connecticut | OHI #2 | 113.30 | 100.00 | 98.00 | 87.68 | 78.46 | 78.80 | 70.50 | 70.00 |
| OHI #22 | 8.42 | 9.10 | 8.40 | n/a | 3.28 | 4.40 | 3.46 | 4.89 | |
|
| |||||||||
| Georgia | OHI #2 | 62.00 | 57.00 | 49.60 | 48.60 | 49.80 | 45.30 | 45.70 | 39.60 |
| OHI #22 | 7.80 | 8.30 | 7.70 | n/a | 4.20 | 4.00 | 3.70 | 3.50 | |
|
| |||||||||
| Illinois | OHI #2 | 149.23 | 119.70 | 172.20 | 76.50 | 74.00 | 48.10 | 66.00 | 57.10 |
| OHI #22 | 8.32 | 13.80 | 13.30 | n/a | 4.30 | 4.50 | 4.70 | 4.60 | |
|
| |||||||||
| Kentucky | OHI #2 | 89.16 | 72.01 | 87.00 | 82.65 | 70.70 | 72.00 | 71.00 | 73.29 |
| OHI #22 | 11.37 | 8.70 | 10.60 | n/a | 5.83 | 5.80 | 6.80 | 6.64 | |
|
| |||||||||
| Louisiana | OHI #2 | 82.80 | 84.10 | 78.90 | 73.90 | 63.30 | 77.40 | 73.80 | 72.16 |
| OHI #22 | 10.40 | 10.50 | 13.30 | n/a | 7.17 | 6.54 | 7.15 | 6.01 | |
|
| |||||||||
| Massachusetts | OHI #2 | 70.20 | 69.70 | 63.50 | 61.20 | 62.30 | 58.70 | 50.80 | 52.20 |
| OHI #22 | 9.60 | 10.03 | 10.38 | n/a | 5.18 | 4.81 | 4.28 | 4.70 | |
|
| |||||||||
| Michigan | OHI #2 | 70.30 | 65.50 | 58.00 | 55.42 | 50.00 | 51.10 | 47.60 | 46.40 |
| OHI #22 | 10.00 | 11.10 | 10.10 | n/a | 5.20 | 5.70 | 5.30 | 6.20 | |
|
| |||||||||
| Minnesota | OHI #2 | 36.85 | 82.50 | 65.47 | 60.50 | 64.60 | 61.90 | 61.20 | 58.30 |
| OHI #22 | 4.75 | 9.80 | 9.30 | n/a | 5.40 | 5.20 | 5.20 | 5.80 | |
|
| |||||||||
| Montana | OHI #2 | 110.74 | 121.28 | 106.80 | 88.45 | 79.20 | 78.20 | 70.75 | 89.92 |
| OHI #22 | 20.63 | 23.35 | 21.60 | n/a | 8.60 | 7.40 | 6.72 | 6.40 | |
|
| |||||||||
| North Carolina | OHI #2 | 67.21 | 67.20 | 57.80 | 53.10 | 50.14 | 49.19 | 47.10 | 47.44 |
| OHI #22 | 9.00 | 9.50 | 9.56 | n/a | 7.69 | 7.99 | 9.04 | 8.76 | |
|
| |||||||||
| New Hampshire | OHI #2 | 34.70 | 37.40 | 33.20 | 28.40 | 33.20 | 36.20 | 38.70 | 33.50 |
| OHI #22 | 4.00 | 4.10 | 3.50 | n/a | 2.50 | 4.30 | 5.60 | 4.10 | |
|
| |||||||||
| New Jersey | OHI #2 | 94.90 | 94.80 | 92.40 | 87.90 | 82.20 | 73.80 | 76.10 | 96.30 |
| OHI #22 | 8.80 | 10.19 | 10.50 | n/a | 4.90 | 4.30 | 5.50 | 5.30 | |
|
| |||||||||
| New York | OHI #2 | 162.20 | 153.20 | 149.50 | 132.20 | 154.40 | 158.40 | 167.50 | 136.99 |
| OHI #22 | 9.20 | 10.50 | 11.30 | n/a | 7.92 | 7.69 | 8.21 | 8.13 | |
|
| |||||||||
| Oregon | OHI #2 | 82.50 | 66.70 | 68.70 | 63.00 | 51.40 | 51.20 | 48.40 | 45.50 |
| OHI #22 | 11.40 | 10.70 | 11.30 | n/a | 5.60 | 6.10 | 5.50 | 6.90 | |
|
| |||||||||
| Pennsylvania | OHI #2 | 117.30 | 111.10 | 102.70 | 91.51 | 80.70 | 75.00 | 73.50 | 68.80 |
| OHI #22 | 14.90 | 14.10 | 15.02 | n/a | 6.00 | 6.20 | 6.90 | 6.50 | |
|
| |||||||||
| Texas | OHI #2 | 66.92 | 64.95 | 64.20 | 59.00 | 54.96 | 50.20 | 51.30 | 46.50 |
| OHI #22 | 11.38 | 11.39 | 11.27 | n/a | 4.44 | 4.70 | 5.22 | 4.77 | |
|
| |||||||||
| Washington | OHI #2 | 149.10 | 132.20 | 113.40 | 100.90 | 89.10 | 86.80 | 76.20 | 67.30 |
| OHI #22 | 13.60 | 13.30 | 12.50 | n/a | 6.10 | 6.30 | 6.00 | 5.70 | |
Abbreviation: OHI, Occupational Health Indicator.
OHI #22 data were not available for 2015, due to the International Classification of Diseases lexicon transition as of October 1, 2015.
FIGURE 2.
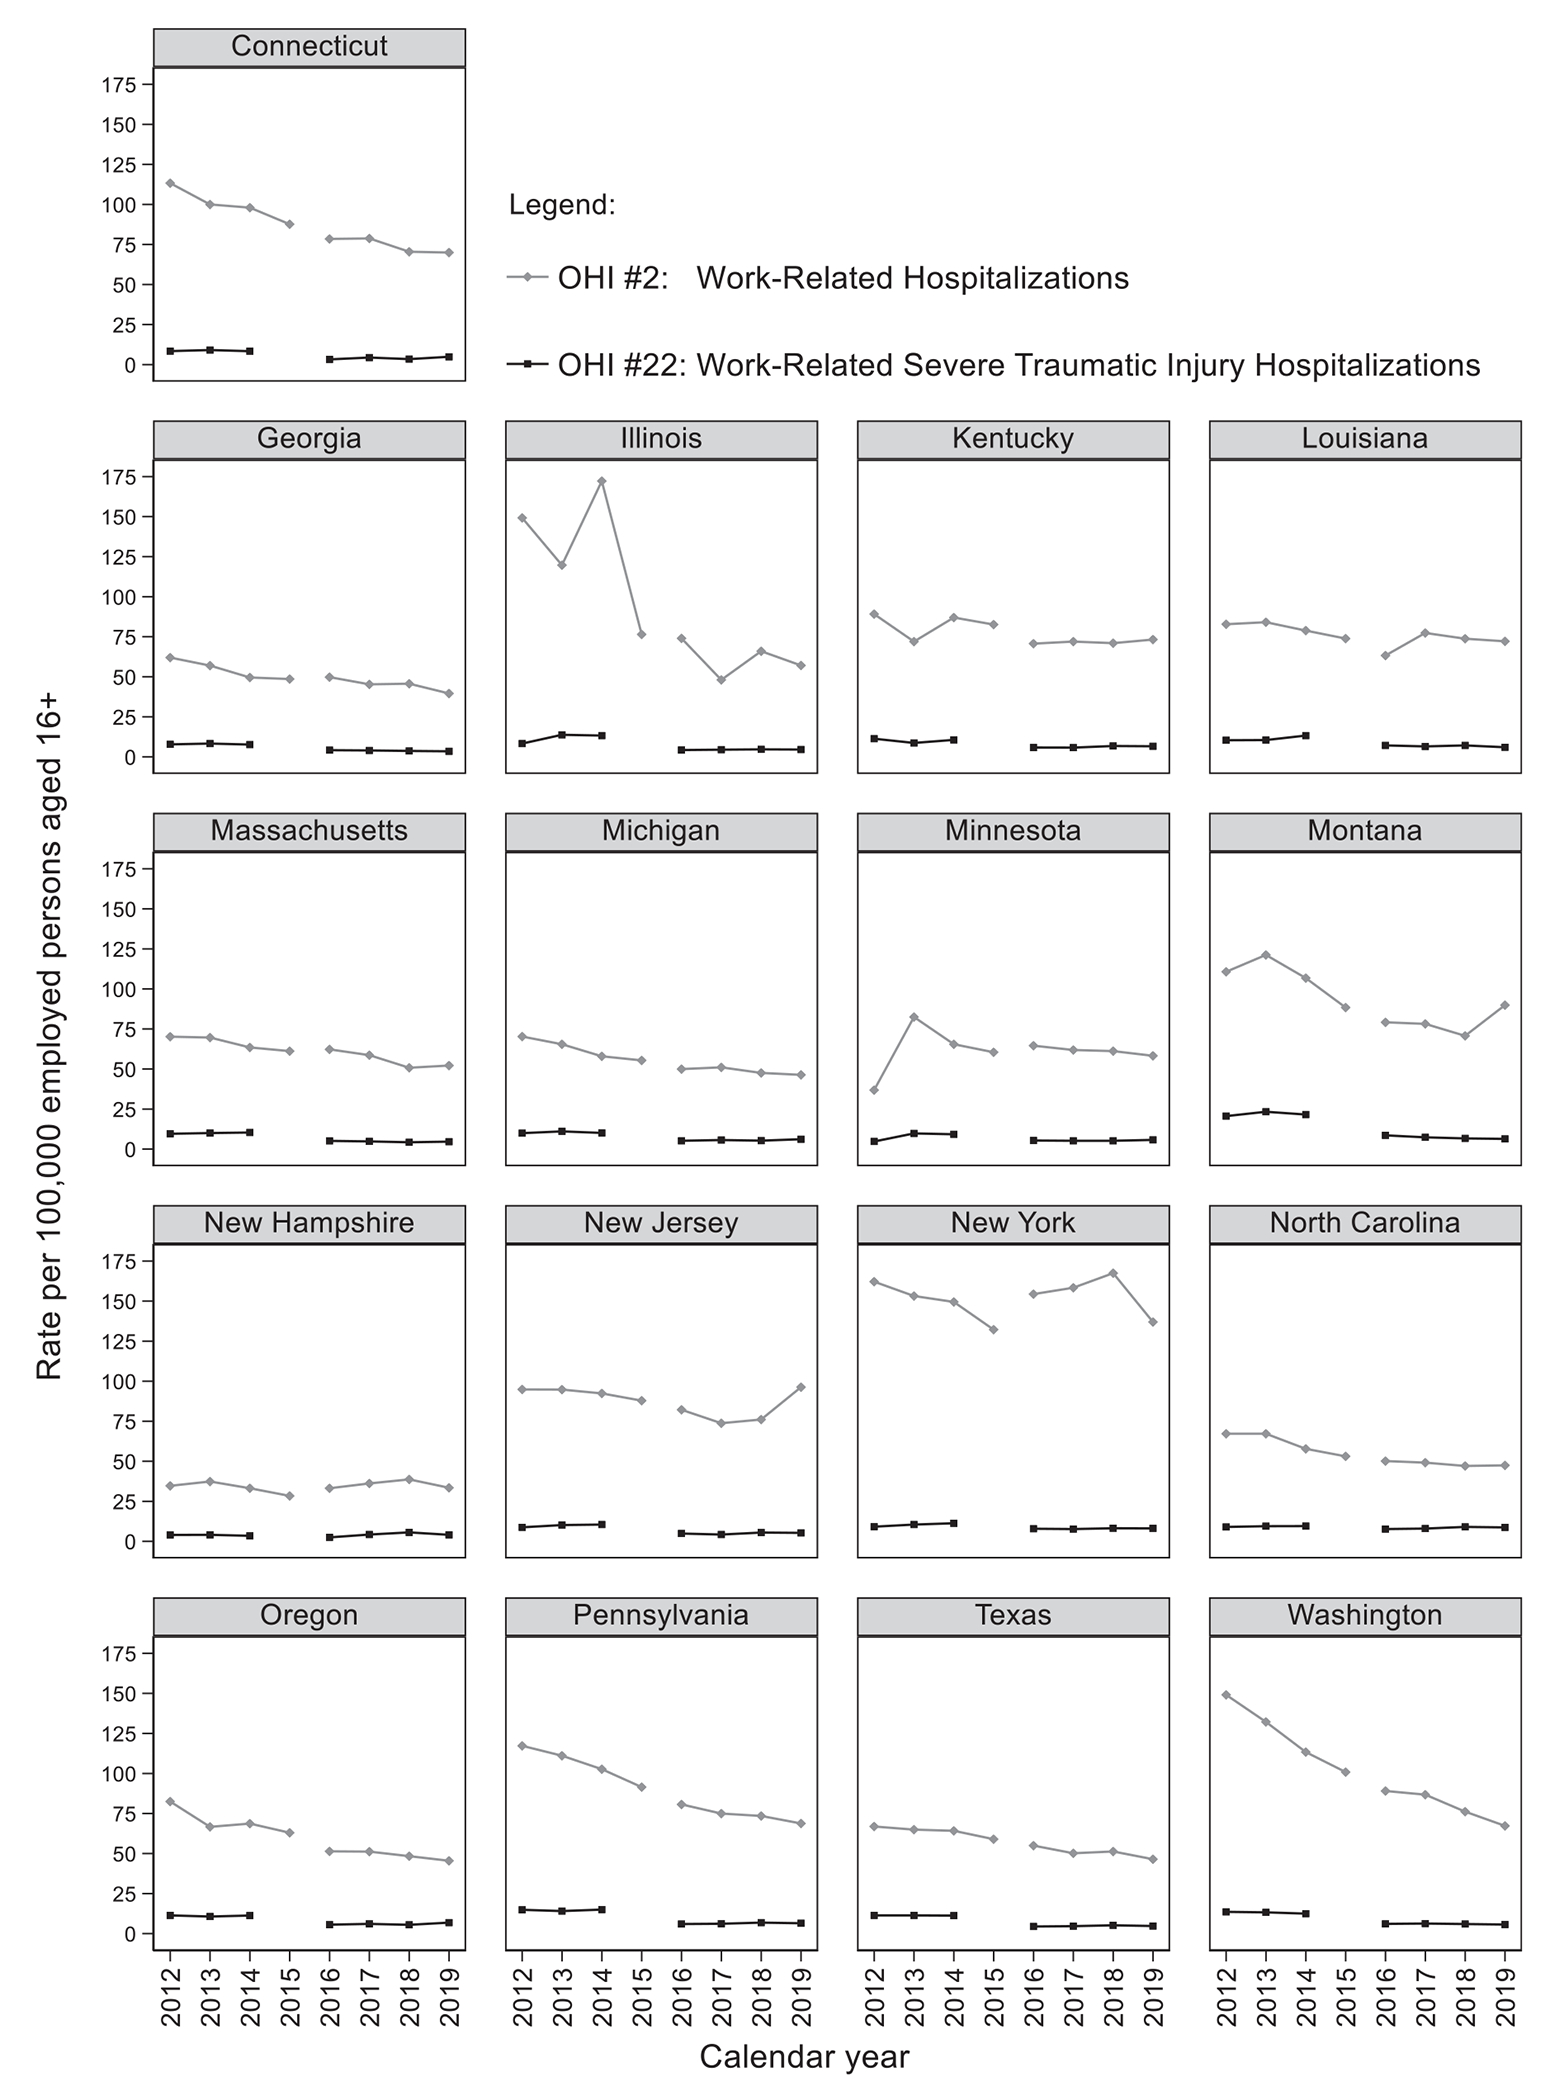
OHI #2 “Work-Related Hospitalizations” and OHI #22 “Work-Related Severe Traumatic Injury Hospitalizations”: Annual rates per 100,000 employed persons aged 16 years or older, by state (2012–2019). OHI #22 data not available for 2015, due to the International Classification of Diseases lexicon transition as of October 1, 2015. OHI, Occupational Health Indicator.
FIGURE 3.
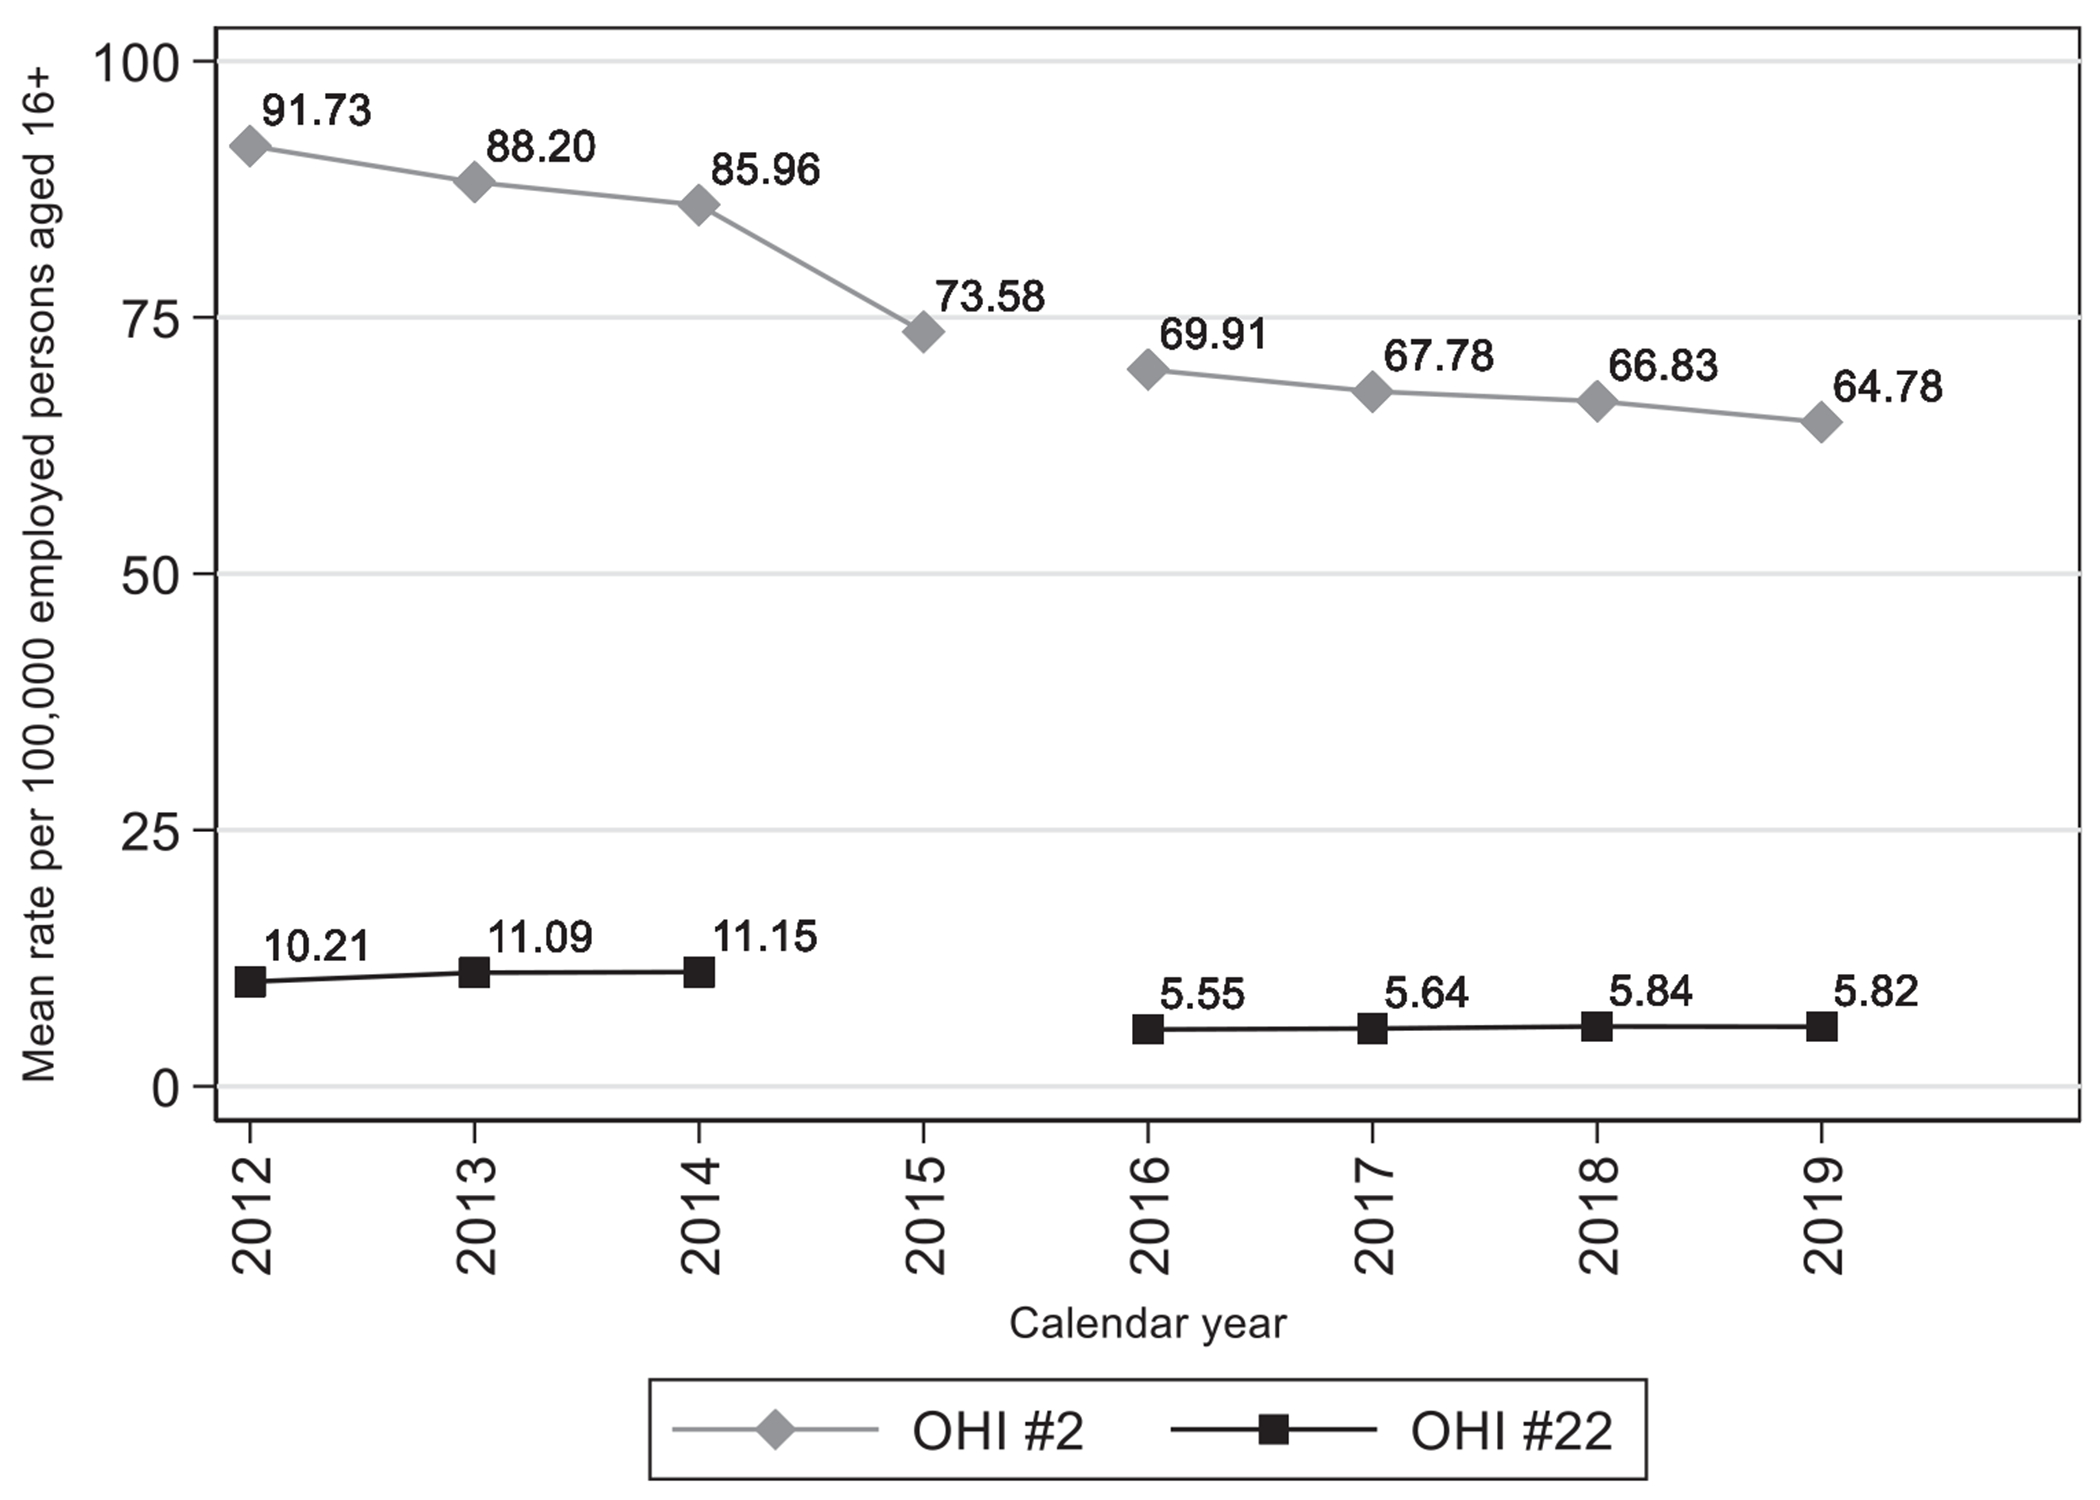
OHI #2 “Work-Related Hospitalizations” and OHI #22 “Work-Related Severe Traumatic Injury Hospitalizations”: Annual rates per 100,000 employed persons aged 16 years or older, averaged across 17 states (2012–2019). OHI #22 data not available for 2015, due to the International Classification of Diseases lexicon transition as of October 1, 2015. OHI, Occupational Health Indicator.
Descriptively, these data suggested that trends in work-related severe traumatic injury hospitalizations (OHI #22, which incorporates a severity threshold) did not exhibit the decreasing trend exhibited by all work-related hospitalizations (OHI #2). Averaged across states (see Table 3), OHI #2 rates showed a 3.2% average annual decrease over the pre-transition years (from 2012 through 2014); in contrast, OHI #22 rates showed a 4.6% average annual increase over the same years. Post-transition trends (from 2016 through 2019) showed a roughly similar pattern—a 2.5% average annual decrease for OHI #2, versus a 1.8% average annual increase for OHI #22. As shown in Figure 1, averaged across states, the proportion of OHI #2 hospitalizations represented by the more severe subset of OHI #22 hospitalizations steadily increased both before and after the 2015 lexicon transition, despite an abrupt 39.9% drop just after the transition (0.138 in 2014 to 0.083 in 2016). As shown in Table 3, averaged across states, the OHI #22 rate dropped 50.2% from 2014 to 2016 (11.15 to 5.55, respectively), compared to only 18.7% for OHI #2 across the same years (85.96 to 69.91, respectively), suggesting a structural break associated with the lexicon transition specifically for OHI #22. In accordance with our hypothesis, these impressions were confirmed using the state-panel fixed-effects linear regression models (results presented in Table 4). For OHI #2, there was a significant decreasing trend in rates over time, but there was not a statistically significant drop (structural break) following the lexicon transition. In contrast, for both OHI #22 and for the proportion of OHI #2 represented by OHI #22, there was a significant increasing trend in rates over time, along with a statistically significant drop following the lexicon transition. As anticipated, interaction terms representing change in trend after the lexicon transition were not significant, and were, therefore, dropped from all models.
TABLE 4.
OHI #2 “Work-Related Hospitalizations” and OHI #22 “Work-Related Severe Traumatic Injury Hospitalizations”: State-panel fixed-effects linear regression results (2012–2019).
| Model | Temporal trend (annual linear change overall years)a | Abrupt change in level after lexicon transitionb | ||||
|---|---|---|---|---|---|---|
| β | 95% CI | p | β | 95% CI | p | |
| OHI #2 (rates) | −1.990 | −3.764, −0.217 | 0.030 | −12.347 | −24.717, 0.024 | 0.050 |
| OHI #22 (rates) | 0.207 | 0.045, 0.368 | 0.015 | −6.035 | −7.501, −4.570 | <0.001 |
| OHI #22/OHI #2 (proportions) | 0.006 | 0.004, 0.009 | <0.001 | −0.065 | −0.077, −0.053 | <0.001 |
Abbreviation: CI, confidence interval.
Calendar year (continuous; coefficient represents 1 year change).
Pre- to post-lexicon transition (binary; coefficient represents change in level, comparing 2016–2019 to 2012–2015 for OHI #2 or to 2012–2014 for OHI #22 and OHI #22/OHI #2). Interaction terms representing change in trend after the lexicon transition were not significant, and were therefore dropped from all models.
4 |. DISCUSSION
Using surveillance data collected from 17 states over an 8-year period, this study provides evidence that using OHI #22 “Work-Related Severe Traumatic Injury Hospitalizations” to track severe traumatic injuries adds value over simply measuring overall hospitalizations (OHI #2 “Work-Related Hospitalizations”). Despite updated methodology and a quite different severe injury list, the OHI #22 data collected following the ICD transition continue to support our original motivating hypothesis—that an injury severity threshold can produce less biased occupational injury trend estimates. Our findings also comport with previous research and conjecture in the more general injury literature.9,10,15,16,20,23,52
In this study, we found notably different trends when applying severity restriction, versus in its absence. Rates for OHI #22, which represents severe injury hospitalizations and incorporates severity restriction, showed a monotonic increasing trend during both time periods (2012–2014 and 2016–2019), along with a significant drop in level after the ICD lexicon transition. In contrast, rates for OHI #2, which represents hospitalizations overall and does not incorporate additional severity restriction, showed a decreasing monotonic trend, with no significant change in level associated with the lexicon transition. In accordance with our hypothesis that minor injuries would increasingly go uncaptured, the proportion of OHI #2 hospitalizations represented by the more severe subset of OHI #22 hospitalizations steadily increased over time, despite a transitory abrupt drop (structural break) just after the ICD lexicon transition in 2015. The ICD transition poses challenges for longitudinal injury surveillance using hospital discharge data, as evidenced by the significant structural break that we observed. This aligns with research documenting structural breaks at the ICD transition in various measures based on ICD diagnosis codes.53 OHI #22 trend estimates (and presumably other OHIs that rely on ICD diagnosis codes), must account for the ICD lexicon-associated structural break in 2015.
Severity restriction may improve occupational injury trend estimates by mitigating the impact of several factors that can introduce temporal bias, at least to the extent that each is correlated with increasingly impaired ascertainment of minor injuries relative to severe injuries. Such factors may include increases in contingent or precarious employment, decreasing identification or reporting of minor injuries as being work-related, changing standards of care that have resulted in decreasing probabilities of hospital admission for minor injuries, and a general shift from inpatient care toward care in emergency departments, observation units, and other outpatient facilities.5,6,15,16,20 Adaptation by health care providers to changing economies and financial pressures may also have an important impact on observed trends in occupational injury rates, related to using WC as a proxy for work-relatedness (particularly with restriction to first-listed payer).17 Hospitals have undertaken increasingly intensive efforts to identify all potential payers and recoup the costs of care, particularly for the most expensive and severe injuries.17,54,55
A number of previous reports describe downward trajectories in nonfatal occupational injury trends, from employer-reported sources and more specifically in work-related hospital discharge records.31,56–58 While prevention efforts, macroeconomic trends (e.g., recession), and shifts in industrial sectors may impact occupational injuries over time,59–61 the findings of this study suggest that some of the previously reported downward trends may have been overstated. Although some progress may have been made in preventing workplace injuries, a number of external factors related to incomplete surveillance (e.g., incomplete coverage of specific injuries or work sectors by WC, underreporting of injuries, or health care utilization shifts from hospitals to outpatient facilities), likely account for a portion of the observed decreases. Generally, research studies and surveillance systems that report declining trends in workplace injuries have not employed severity restriction as an intentional methodology. The application of a severity restriction to work-related hospitalization data reveals a concerning lack of apparent progress in preventing more severe traumatic workplace injuries. Aside from the issue of decreasing likelihood of full ascertainment of minor injuries over time, it is also possible that relatively minor workplace injuries are more easily prevented by safety interventions that are less costly, easier to implement, and easier to monitor. In contrast, severe traumatic injuries are potentially caused by low-frequency high-consequence events that are more challenging to prepare for, as they may require greater investment or sustained vigilance for hazards that usually do not result in adverse events. Additional targeted research is needed to understand why severe work injuries continue, seemingly unabated, in recent years. It would be easier to approach this line of inquiry if hospitals and trauma registries routinely recorded employment information (e.g., industry, occupation, work-relatedness independent of payer) for injured workers. The lack of such information in surveillance systems continues to challenge efforts to understand barriers to improving trends in severe traumatic work injuries.
4.1 |. Limitations
Only 17 states provided complete data for this study; however, these states represent diverse geographic areas and have structurally different WC systems. According to the 2020 Census, these 17 states contain about 47% of the US population. The averaged point estimates for trends and structural breaks may not be fully generalizable and would likely vary if additional states were included. Nevertheless, we would not expect marked impact on the general patterns we described, given that the ICD transition and construction of the severe injury lists were uniform across states.
Although hospital discharge databases are population-based, they do carry limitations. Hospital discharge records are only available for nonfederal, acute care hospitals. In addition, the necessary reliance on WC as payer undercounts work-related injuries, whether or not severity restriction is imposed.12,17,19,62–64 Many individuals with work-related injuries do not file for WC or fail to recognize work as the cause of their injury. Additionally, many workers are not covered by state WC systems (coverage varies somewhat by state, but may include, e.g., self-employed individuals, independent contractors, farmers, federal employees, railroad workers, longshore workers, and maritime workers). Further, the expected payer on hospital discharge records may not be accurate and may not reflect the actual payer. Despite these limitations, WC is the best available proxy for work-relatedness in hospital discharge records because these data sets do not contain an independent field for work-relatedness.
Following Safe States Alliance consensus recommendations, severe traumatic injury hospitalizations were based only on the first-listed (i.e., principal, primary, admitting) diagnosis,65 and, additionally, were included only if estimated to have an AIS score of 3 or above (AIS scores are not available/calculable for all injuries). As a result, an unknown number of severe traumatic injuries would not be counted by OHI #22. Both OHI #2 and OHI #22 also exclude workers hospitalized outside their state of residence.
4.2 |. Implications for future research and practice
ICD-10-CM was implemented in the United States in 2015. ICD-11 went into effect globally on January 1, 2022, but there is not yet a projected implementation date for ICD-11-CM in the United States, and it will likely be at least several years. Once implemented, the severe injury list will need to be updated once again. The AAAM ICD map is proprietary, requiring a licensing agreement and fee for use; developing alternative validated publicly available measures of injury severity for ICD-10-CM diagnoses would be useful.
5 |. CONCLUSIONS
Hospital discharge data generally indicate decreasing work-related hospitalizations over time; in contrast—after applying severity restriction—work-related severe traumatic injury hospitalizations appear to be increasing. OHI #22 contributes meaningfully to state occupational health surveillance efforts by reducing the impact of factors that differentially obscure minor injuries; however, OHI #22 trend estimates must account for the ICD lexicon-associated structural break in 2015. Additional publicly available injury severity measures should be developed for existing and newly designed occupational injury surveillance systems. In addition, inclusion of work-relatedness information in hospital discharge databases would reduce reliance on payer, which is known to undercount work-related injuries. Accurate characterization of injury trends is critical to monitoring our state and national progress with regard to occupational injury prevention.
ACKNOWLEDGMENTS
We thank the following people for providing the data to conduct this analysis: Ivan Cherniack (Connecticut Department of Public Health), Antionette Lavender (Georgia Department of Public Health), Lee Friedman (University of Illinois Chicago), Patrick Maloney (University of Kentucky), Kathleen Fitzsimmons (Massachusetts Department of Public Health), Alexandra Bianco (Michigan Department of Health and Human Services), Erik Zabel (Minnesota Department of Health), Aaron Bender (Montana Department of Labor and Industry), Karla Armenti (University of New Hampshire), Kim Gaetz (North Carolina Department of Health and Human Services), Steve Drouin (North Carolina Department of Health and Human Services), David Dreher (Oregon Health Authority), Remy Babich (Pennsylvania Department of Health), Ketki Patel (Texas Department of State Health Services), Sara Wuellner (Washington State Department of Labor and Industries).
Footnotes
CONFLICT OF INTEREST STATEMENT
The authors declare no conflicts of interest.
DISCLOSURE BY AJIM EDITOR OF RECORD
John Meyer declares that he has no conflict of interest in the review and publication decision regarding this article.
DATA AVAILABILITY STATEMENT
The data that support the findings of this study are available within this article.
REFERENCES
- 1.National Institute for Occupational Safety and Health. Workplace safety and health topics: traumatic occupational injuries. 2022. Accessed January 17, 2023. http://www.cdc.gov/niosh/injury/
- 2.Leigh JP. Occupational injury and illness in the United States. Estimates of costs, morbidity, and mortality. Arch Intern Med. 1997;157:1557–1568. [PubMed] [Google Scholar]
- 3.Miller TR, Galbraith M. Estimating the costs of occupational injury in the United States. Accid Anal Prev. 1995;27:741–747. [DOI] [PubMed] [Google Scholar]
- 4.Leigh JP. Economic burden of occupational injury and illness in the United States. Milbank Q. 2011;89:728–772. [DOI] [PMC free article] [PubMed] [Google Scholar]
- 5.Azaroff LS, Lax MB, Levenstein C, Wegman DH. Wounding the messenger: the new economy makes occupational health indicators too good to be true. Int J Health Serv. 2004;34:271–303. [DOI] [PubMed] [Google Scholar]
- 6.Azaroff LS, Levenstein C, Wegman DH. Occupational injury and illness surveillance: conceptual filters explain underreporting. Am J Public Health. 2002;92:1421–1429. [DOI] [PMC free article] [PubMed] [Google Scholar]
- 7.Friedman LS, Forst L. The impact of OSHA recordkeeping regulation changes on occupational injury and illness trends in the US: a time-series analysis. Occup Environ Med. 2007;64:454–460. [DOI] [PMC free article] [PubMed] [Google Scholar]
- 8.U.S. House of Representatives Committee on Education and Labor. Majority staff report: hidden tragedy: underreporting of workplace injuries and illnesses. June 2008. Accessed January 17, 2023. http://www.cste.org/resource/resmgr/OccupationalHealth/HouseEdLaborCommReport061908.pdf
- 9.Cryer C, Langley J. Developing Indicators of Injury Incidence that Can be Used to Monitor Global, Regional and Local Trends. Injury Prevention Research Unit, University of Otago; 2008. Accessed January 17, 2023. http://psm-dm.otago.ac.nz/ipru/ReportsPDFs/OR070.pdf
- 10.Cryer PC, Jarvis SN, Edwards P, Langley JD. How can we reliably measure the occurrence of non-fatal injury? Int J Consum Prod Saf. 1999;6:183–191. [Google Scholar]
- 11.Sears JM, Bowman SM, Hogg-Johnson S. Using injury severity to improve occupational injury trend estimates. Am J Ind Med. 2014;57:928–939. [DOI] [PubMed] [Google Scholar]
- 12.Groenewold MR, Baron SL. The proportion of work-related emergency department visits not expected to be paid by workers’ compensation: implications for occupational health surveillance, research, policy, and health equity. Health Serv Res. 2013;48:1939–1959. [DOI] [PMC free article] [PubMed] [Google Scholar]
- 13.Langley J, Stephenson S, Cryer C. Measuring road traffic safety performance: monitoring trends in nonfatal injury. Traffic Inj Prev. 2003;4:291–296. [DOI] [PubMed] [Google Scholar]
- 14.Guo X, Burton JF Jr. Workers’ compensation: recent developments in moral hazard and benefit payments. ILR Rev. 2010;63:340–355. [Google Scholar]
- 15.Stephenson S, Langley J, Cryer C. Effects of service delivery versus changes in incidence on trends in injury: a demonstration using hospitalised traumatic brain injury. Accid Anal Prev. 2005;37:825–832. [DOI] [PubMed] [Google Scholar]
- 16.Thurman D. Trends in hospitalization associated with traumatic brain injury. JAMA. 1999;282:954–957. [DOI] [PubMed] [Google Scholar]
- 17.Sears JM, Bowman SM, Adams D, Silverstein BA. Who pays for work-related traumatic injuries? payer distribution in Washington State by ethnicity, injury severity, and year (1998-2008): who pays for work-related traumatic injuries? Am J Ind Med. 2013;56:742–754. [DOI] [PubMed] [Google Scholar]
- 18.Heaton P. The Impact of Health Care Reform on Workers’ Compensation Medical Care: Evidence from Massachusetts. RAND Corporation; 2012. [PMC free article] [PubMed] [Google Scholar]
- 19.Sears JM, Bowman SM, Blanar L, Hogg-Johnson S. Industrial injury hospitalizations billed to payers other than workers’ compensation: characteristics and trends by state. Health Serv Res. 2017;52:763–785. [DOI] [PMC free article] [PubMed] [Google Scholar]
- 20.Colantonio A, Croxford R, Farooq S, Laporte A, Coyte PC. Trends in hospitalization associated with traumatic brain injury in a publicly insured population, 1992-2002. J Trauma. 2009;66:179–183. [DOI] [PubMed] [Google Scholar]
- 21.Cryer C, Miller TR, Lyons RA, et al. Towards valid ‘serious non-fatal injury’ indicators for international comparisons based on probability of admission estimates. Inj Prev. 2017;23:47–57. [DOI] [PubMed] [Google Scholar]
- 22.Sears JM, Bowman SM, Rotert M, Blanar L, Hogg-Johnson S. Improving occupational injury surveillance by using a severity threshold: development of a new occupational health indicator. Inj Prev. 2016;22:195–201. [DOI] [PubMed] [Google Scholar]
- 23.National Center for Health Statistics (NCHS) Expert Group on Injury Severity Measurement. Discussion document on injury severity measurement in administrative datasets. 2004. Accessed January 17, 2023. http://www.cdc.gov/nchs/data/injury/DicussionDocu.pdf
- 24.Thomsen C, McClain J, Rosenman K, Davis L. Indicators for occupational health surveillance. MMWR Recomm Rep. 2007;56:1–7. [PubMed] [Google Scholar]
- 25.Council of State and Territorial Epidemiologists (CSTE). Occupational health indicators: a guide for tracking occupational health conditions and their determinants. Updated July 2022 for analysis of 2019 OHI data. Accessed January 17, 2023. https://www.cste.org/resource/resmgr/occupationalhealth/OHI_GuidanceManual_2019_FINA.pdf
- 26.National Center for Health Statistics. International Classification of Diseases, (ICD-10-CM/PCS) transition—background. November 6, 2015. Accessed January 17, 2023. http://www.cdc.gov/nchs/icd/icd10cm_pcs_background.htm
- 27.Centers for Medicare and Medicaid Services. ICD-10. 2023. Accessed January 17, 2023. https://www.cms.gov/Medicare/Coding/ICD10/index.html [PubMed]
- 28.Hedegaard H, Johnson RL, Garnett MF, Thomas KE. The 2020 International Classification of Diseases, 10th Revision, Clinical Modification injury diagnosis framework for categorizing injuries by body region and nature of injury. National Health Statistics Reports; Number 150. National Center for Health Statistics; 2020. [PubMed] [Google Scholar]
- 29.Gibson T, Casto A, Young J, Karnell L, Coenen N. Impact of ICD-10-CM/PCS on Research Using Administrative Databases. HCUP Methods Series Report # 2016-02. U.S. Agency for Healthcare Research and Quality; 2016. [Google Scholar]
- 30.Injury Surveillance Workgroup 9. The Transition from ICD-9-CM to ICD-10-CM: Guidance for Analysis and Reporting of Injuries by Mechanism and Intent. The Safe States Alliance; 2016. [Google Scholar]
- 31.Council of State and Territorial Epidemiologists (CSTE). Occupational health indicators. 2023. Accessed January 17, 2023. http://www.cste.org/?OHIndicators
- 32.Bureau of Labor Statistics. Geographic profile of employment and unemployment. 2022. Accessed April 1, 2023. https://www.bls.gov/opub/geographic-profile/archive.htm
- 33.Association for the Advancement of Automotive Medicine. General AIS FAQs. 2023. Accessed January 17, 2023. https://www.aaam.org/abbreviated-injury-scale-ais/general-ais-faqs/
- 34.Baker SP, O’Neill B, Haddon W Jr., Long WB. The injury severity score: a method for describing patients with multiple injuries and evaluating emergency care. J Trauma. 1974;14:187–196. [PubMed] [Google Scholar]
- 35.Harwood PJ, Giannoudis PV, Probst C, Van Griensven M, Krettek C, Pape HC. Which AIS based scoring system is the best predictor of outcome in orthopaedic blunt trauma patients? J Trauma. 2006;60:334–340. [DOI] [PubMed] [Google Scholar]
- 36.Osler T, Baker SP, Long W. A modification of the injury severity score that both improves accuracy and simplifies scoring. J Trauma. 1997;43:922–926; discussion 925-926. [DOI] [PubMed] [Google Scholar]
- 37.Meredith JW, Evans G, Kilgo PD, et al. A comparison of the abilities of nine scoring algorithms in predicting mortality. J Trauma. 2002;53:621–629; discussion 628-629. [DOI] [PubMed] [Google Scholar]
- 38.Kilgo PD, Osler TM, Meredith W. The worst injury predicts mortality outcome the best: rethinking the role of multiple injuries in trauma outcome scoring. J Trauma. 2003;55:599–607. [DOI] [PubMed] [Google Scholar]
- 39.Sears JM, Blanar L, Bowman SM, Adams D, Silverstein BA. Predicting work-related disability and medical cost outcomes: estimating injury severity scores from workers’ compensation data. J Occup Rehabil. 2013;23:19–31. [DOI] [PubMed] [Google Scholar]
- 40.Ruestow PS, Friedman LS. Characterizing the relationship between in-hospital measures and workers’ compensation outcomes among severely injured construction workers using a data linkage strategy. Am J Ind Med. 2013;56:1149–1156. [DOI] [PubMed] [Google Scholar]
- 41.Sears JM, Blanar L, Bowman SM. Predicting work-related disability and medical cost outcomes: a comparison of injury severity scoring methods. Injury. 2014;45:16–22. [DOI] [PubMed] [Google Scholar]
- 42.Association for the Advancement of Automotive Medicine. The Abbreviated Injury Scale, 1990 Revision. AAAM; 1990. [Google Scholar]
- 43.MacKenzie EJ, Steinwachs DM, Shankar B. Classifying trauma severity based on hospital discharge diagnoses. Validation of an ICD-9CM to AIS-85 conversion table. Med Care. 1989;27:412–422. [DOI] [PubMed] [Google Scholar]
- 44.Clark DE, Osler TM, Hahn DR. ICDPIC: Stata module to provide methods for translating International Classification of Diseases (Ninth Revision) diagnosis codes into standard injury categories and/or scores. 2010. Accessed January 17, 2023. http://ideas.repec.org/c/boc/bocode/s457028.html
- 45.Council of State and Territorial Epidemiologists (CSTE). Occupational health indicators: a guide for tracking occupational health conditions and their determinants. March 2016; Accessed January 17, 2023. http://www.cste.org/resource/resmgr/OHIndicators2/2016_Version_OHI_Guidance_Ma.pdf
- 46.Association for the Advancement of Automotive Medicine. Abbreviated Injury Scale 2005 Update 2008. AAAM; 2016. [PMC free article] [PubMed] [Google Scholar]
- 47.Loftis KL, Price JP, Gillich PJ, et al. Development of an expert based ICD-9-CM and ICD-10-CM map to AIS 2005 update 2008. Traffic Inj Prev. 2016;17(suppl 1):1–5. [DOI] [PubMed] [Google Scholar]
- 48.Bailer AJ, Reed LD, Stayner LT. Modeling fatal injury rates using Poisson regression: a case study of workers in agriculture, forestry, and fishing. J Saf Res. 1997;28:177–186. [Google Scholar]
- 49.Liu W, Cela J. Count data models in SAS, Paper 371-2008. Paper presented at: SAS Global Forum 2008, Statistics and Data Analysis, 2008; San Antonio, TX. [Google Scholar]
- 50.Hilbe JM. Negative Binomial Regression. 2nd ed. Cambridge University Press; 2011. [Google Scholar]
- 51.StataCorp. Stata Statistical Software: Release 16. StataCorp LLC; 2019. [Google Scholar]
- 52.Cryer C, Langley J, Stephenson S, Jarvis S, Edwards P. Measure for measure: the quest for valid indicators of non-fatal injury incidence. Public Health. 2002;116:257–262. [DOI] [PubMed] [Google Scholar]
- 53.Ellis RP, Hsu HE, Song C, et al. Diagnostic category prevalence in 3 classification systems across the transition to the International Classification of Diseases, Tenth Revision, Clinical Modification. JAMA Netw Open. 2020;3:e202280. [DOI] [PMC free article] [PubMed] [Google Scholar]
- 54.Helling TS, Watkins M, Robb CV. Improvement in cost recovery at an urban level I trauma center. J Trauma. 1995;39:980–983. [DOI] [PubMed] [Google Scholar]
- 55.Nahm NJ, Patterson BM, Vallier HA. The impact of injury severity and transfer status on reimbursement for care of femur fractures. J Trauma Acute Care Surg. 2012;73:957–965. [DOI] [PubMed] [Google Scholar]
- 56.Dembe AE, Mastroberti MA, Fox SE, Bigelow C, Banks SM. Inpatient hospital care for work-related injuries and illnesses. Am J Ind Med. 2003;44:331–342. [DOI] [PubMed] [Google Scholar]
- 57.McGreevy K, Lefkowitz D, Valiante D, Lipsitz S. Utilizing hospital discharge data (HD) to compare fatal and non-fatal work-related injuries among Hispanic workers in New Jersey. Am J Ind Med. 2010;53:146–152. [DOI] [PubMed] [Google Scholar]
- 58.U.S. Department of Labor Bureau of Labor Statistics. Fatal occupational injuries and nonfatal occupational injuries and illnesses, 2008. May 2011. Accessed January 17, 2023. http://www.bls.gov/iif/oshwc/osh/os/oshs2008.pdf
- 59.Robinson JC. The rising long-term trend in occupational injury rates. Am J Public Health. 1988;78:276–281. [DOI] [PMC free article] [PubMed] [Google Scholar]
- 60.Subramanian A, Desai A, Prakash L, Mital A, Mital A. Changing trends in US injury profiles: revisiting non-fatal occupational injury statistics. J Occup Rehabil. 2006;16:123–155. [DOI] [PubMed] [Google Scholar]
- 61.Loomis D. Diversity of trends in occupational injury mortality in the United States, 1980-96. Inj Prev. 2003;9:9–14. [DOI] [PMC free article] [PubMed] [Google Scholar]
- 62.Sears JM, Bowman SM, Silverstein BA, Adams D. Identification of work-related injuries in a state trauma registry. J Occup Environ Med. 2012;54:356–362. [DOI] [PubMed] [Google Scholar]
- 63.Sorock GS, Smith E, Hall N. An evaluation of New Jersey’s hospital discharge database for surveillance of severe occupational injuries. Am J Ind Med. 1993;23:427–437. [DOI] [PubMed] [Google Scholar]
- 64.Davis LK, Grattan KM, Tak S, Bullock LF, Ozonoff A, Boden LI. Use of multiple data sources for surveillance of work-related amputations in Massachusetts, comparison with official estimates and implications for national surveillance. Am J Ind Med. 2014;57:1120–1132. [DOI] [PubMed] [Google Scholar]
- 65.STIPDA: Injury Surveillance Workgroup 5. Consensus Recommendations for Injury Surveillance in State Health Departments. State and Territorial Injury Prevention Directors Association; 2007. [Google Scholar]
Associated Data
This section collects any data citations, data availability statements, or supplementary materials included in this article.
Data Availability Statement
The data that support the findings of this study are available within this article.