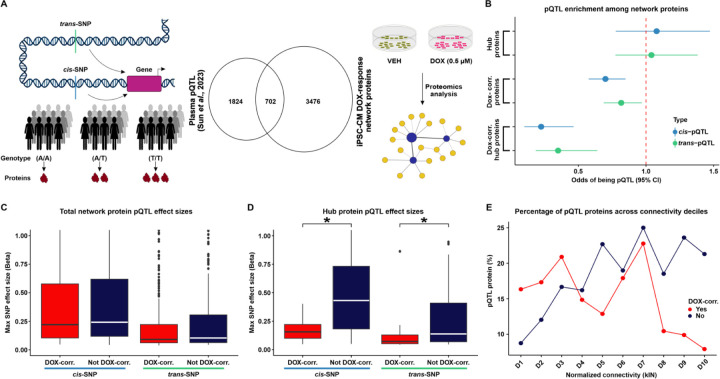
Figure 5: DOX-correlated hub proteins are depleted for protein quantitative trait loci.
(A) Schematic representing the rationale behind the test design. Protein expression can be influenced by cis- or trans-SNPs resulting in differential abundance of proteins across individuals with different genotypes. We integrated existing protein quantitative trait loci (pQTL) data from plasma samples (17) with our DOX-treated iPSC-CM protein network. (B) Enrichment of cis- (blue) and trans-pQTLs (green) amongst hub proteins, DOX-correlated proteins, and DOX-correlated hub proteins. (C) Maximum pQTL effect sizes for cis- and trans-pQTLs amongst all proteins in DOX-correlated modules and non-DOX-correlated modules. (D) Maximum pQTL effect sizes for cis- and trans-pQTLs amongst all hub proteins in DOX-correlated modules and non-DOX correlated modules. Asterisk represents a significant difference in effect sizes between DOX-correlated and non-DOX-correlated modules (*P < 0.05). (E) Percentage of pQTL proteins across connectivity deciles for normalized kIN for proteins in DOX-correlated modules (red), and non-DOX-correlated (blue). Deciles are ordered by increasing kIN scores.

