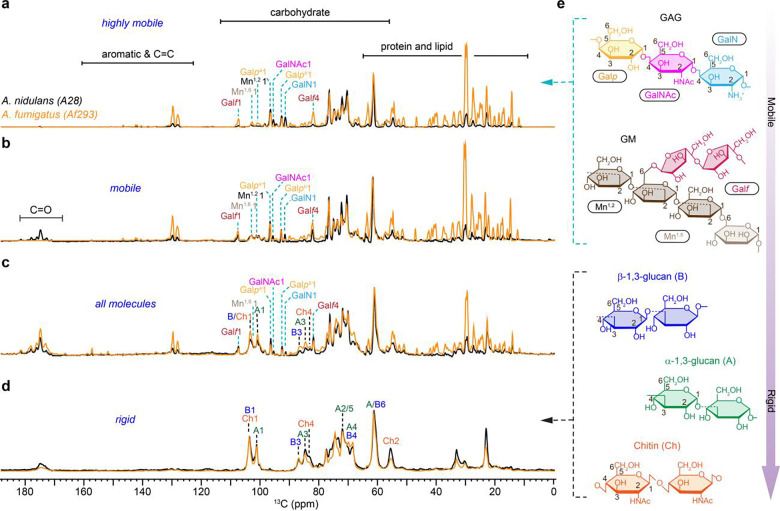
Figure 1. Dynamical gradient of polysaccharides in Aspergillus cell walls.
From top to bottom are four sets of 1D 13C spectra measured with a, refocused INEPT experiment for probing the most dynamic molecules, b, DP spectra with short recycle delay of 2s for selection of mobile components. c, DP with long recycle delays for quantitative detection of all molecules. d, CP for selecting rigid polysaccharides. The spectra of A. nidulans (A28) and A. fumigatus (Af293) are shown in black and orange, respectively. For example, the Galf1 peak at 107 ppm annotates the carbon 1 of glucofuranose (Galf), which is the sidechain in the galactomannan (GM). Dash lines in cyan and black indicate the key peaks of mobile and rigid polysaccharides, respectively. Simplified structure representations are shown for key polysaccharides. e, Structural representation of key carbohydrate components following the dynamic gradient of an increasing level of rigidity from top to bottom as derived from the data only for A. nidulans. The NMR abbreviations for different polysaccharides and their monosaccharide units are labeled.

