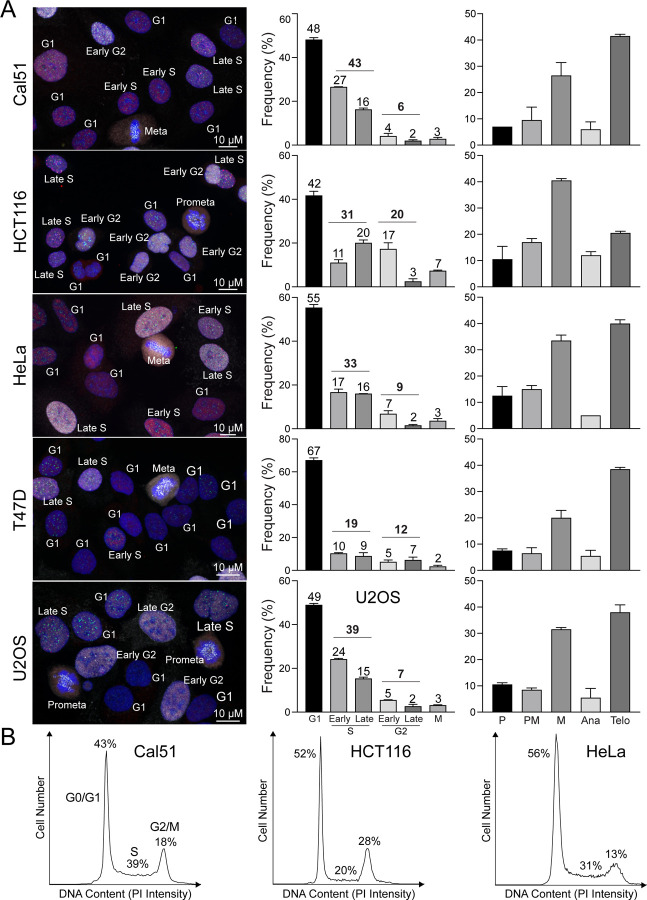
Figure 4: Cell Cycle Distribution in various cancer cell lines.
(A) Left panel: representative immunofluorescence images of asynchronous Cal51, HCT116, HeLa, T47D, and U2OS cells labeled with CENP-C, PCNA, and CENP-F. Middle panel: distribution of cells across different phases of the cell cycle. From top to bottom, n = 455, 447, 518, 467, and 437 (from two replicates). Right panel: proportion of mitotic cells within each sub-stage of mitosis. From top to bottem, n = 181, 201, 212, 156, and 188. (from two replicates). (B) Representative flow cytometry histograms showing detection of DNA content (PI signal intensity) in Cal51, HCT116, and HeLa cells.

