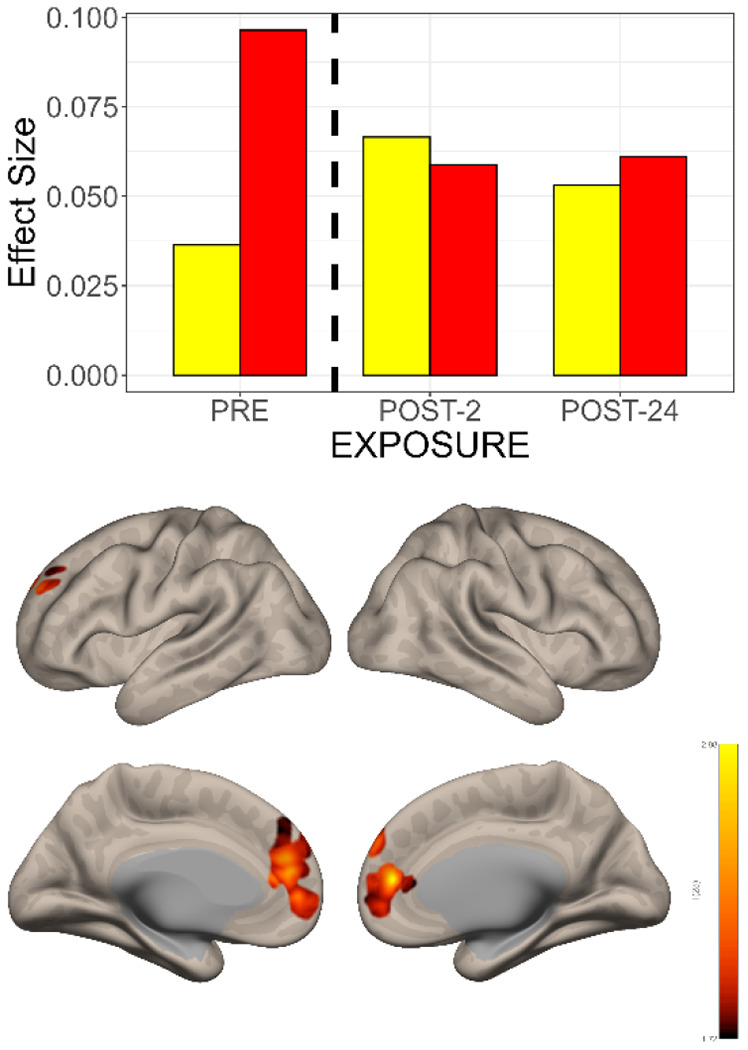
Figure 6. Global correlation changes (GCOR) associated with N2O exposure.

Top: Bar graph of effect size changes in functional connectivity over time. Similar to the individual seed -> voxel maps, functional connectivity changes were in opposite directional following N2O exposure: CNTL participants (yellow bars) demonstrated increased functional connectivity and TRD participants (red bars) decreased functional connectivity. Bottom: GCOR changes associated with N2O exposure in the combined sample (CNTL + TRD) included bilateral dorsal anterior cingulate, frontal poles, left dorsolateral prefrontal cortex, and right superior frontal gyrus and orbitofrontal cortex.
