

Abstract
Our lab has built a next-generation tomosynthesis (NGT) system utilizing scanning motions with more degrees of freedom than clinical digital breast tomosynthesis systems. We are working toward designing scanning motions that are customized around the locations of suspicious findings. The first step in this direction is to demonstrate that these findings can be detected with a single projection image, which can guide the remainder of the scan. This paper develops an automated method to identify findings that are prone to be masked. Perlin-noise phantoms and synthetic lesions were used to simulate masked cancers. NGT projections of phantoms were simulated using ray-tracing software. The risk of masking cancers was mapped using the ground-truth labels of phantoms. The phantom labels were used to denote regions of low and high risk of masking suspicious findings. A U-Net model was trained for multiclass segmentation of phantom images. Model performance was quantified with a receiver operating characteristic (ROC) curve using area under the curve (AUC). The ROC operating point was defined to be the point closest to the upper left corner of ROC space. The output predictions showed an accurate segmentation of tissue predominantly adipose (mean AUC of 0.93). The predictions also indicate regions of suspicious findings; for the highest risk class, mean AUC was 0.89, with a true positive rate of 0.80 and a true negative rate of 0.83 at the operating point. In summary, this paper demonstrates with virtual phantoms that a single projection can indeed be used to identify suspicious findings.
Keywords: Digital Breast Tomosynthesis (DBT), Virtual Clinical Trial (VCT), Anthropomorphic Phantom, Cancer Masking, Artificial Intelligence (AI), Risk-Stratified Breast Cancer Screening, Sensitivity, Specificity
1. INTRODUCTION
Women with radiographically dense parenchyma are usually associated with having an increased risk of cancer.1,2 Breast density can limit the sensitivity of screening exams and potentially result in missed detections (known as masked cancers) or mischaracterizations of lesions.3 Personalized screening programs recommend additional or supplemental imaging for women with dense or complex mammary parenchyma to detect more cancers at early stages.3–8 However, for those who receive supplemental imaging, the current imaging methods lack specificity.9–12 Currently, no direct quantitative criterion exists to identify women for supplemental or triaged imaging, resulting in a greater number of false-positive (FP) findings.
A prototype next-generation tomosynthesis (NGT) system was built at the University of Pennsylvania (Penn) to improve the detection and characterization of breast lesions and the discrimination of glandular (dense) from adipose tissue.13 The NGT design incorporates in the x-ray source scanning an additional component of motion in the posteroanterior direction, reducing out-of-focus structures when compared with conventional imaging systems.13,14 Our ultimate goal is to integrate fast and intelligent methods into the NGT engine (and future designs) to identify suspicious areas and to improve the image quality in regions that are prone to mask cancers. In this paper, we investigate how a single 2D projection image can be used to identify regions that are prone to masking. Our long-term goal is to design more complex scanning motions that are directed specifically around these regions. This paper represents the first step in that direction by demonstrating the feasibility of real-time image analysis using a single 2D projection image, which could be used to guide the choice of x-ray source locations in the remainder of the scan.
Virtual clinical trial (VCT) methods have been used to evaluate, optimize, and validate the acquisitions of the NGT design.15–17 VCTs are usually targeted toward specific clinical tasks, requiring computational simulations of human anatomy (anthropomorphic phantoms).15 To simulate clinical tasks that require a risk assessment of masked cancers or characterization of breast lesions, anthropomorphic phantoms should realistically simulate the anatomic noise seen in images of the mammary parenchyma.18 Just a few studies have been reported in the literature about VCT methods for assessing and estimating the risk of masking cancers.19,20 Mainprize et al. developed a masking index that locally assesses the signal-to-noise ratio of synthetic images using noise spectrum, modulation transfer function, and a task function that represents the psycho-visual model for lesion detectability.19 However, nonlinear imaging modalities, such as digital breast tomosynthesis (DBT), complicate the use of these traditional metrics of image quality.21 In addition, the simulation of complex mammary parenchyma is required to validate the use of objective metrics proposed for estimating the risk of masking cancers.18
Computer simulations of Perlin noise can improve substantially the realism of mammary parenchyma of virtual breast phantoms.18 Perlin noise22 uses gradient values that are smoothly connected by an interpolation function that is used to generate complex textures and patterns in medical imaging.18,23 Dustler et al. have proposed the use of a variation of Perlin noise called fractal noise (or fractional Brownian motion) to simulate realistic small-scale breast structures that improve the complexity of simulated mammary parenchyma of phantoms.24,25
In this study, we used a Graphics Processing Unit (GPU) based library to accelerate simulations of Perlin-noise phantoms.18 We developed an automated method to identify suspicious regions that are prone to mask cancers in Perlin- noise phantoms. These suspicious regions are considered “hotspots” for masking cancers. A U-Net architecture26 was trained for multiclass segmentation of hotspot areas in breast images simulated using the NGT acquisition geometry. The central aim of this study is to demonstrate that hotspots can be detected in a single projection image, as this is motivated by our long-term goal of designing scanning motions that are customized around the locations of these findings.
2. MATERIALS & METHODS
2.1. Data Simulation
2.1.1. Breast Outline and Mammary Parenchyma
Breast outlines were simulated using software that models breasts under mammography compression using the principal component analysis (PCA) method.27,28 The PCA software characterizes and models realistically the compressed breast curvature between the support table and the compression paddle. In total, 20 outlines of 0.2 mm3 voxel size were modeled under craniocaudal (CC) compression (Figure 1A). The outlines were created using 30, 40, and 50 mm of compressed breast thickness (CBT). The chest-wall to nipple distance (CND) varied from 50 to 110 mm.
Figure 1.
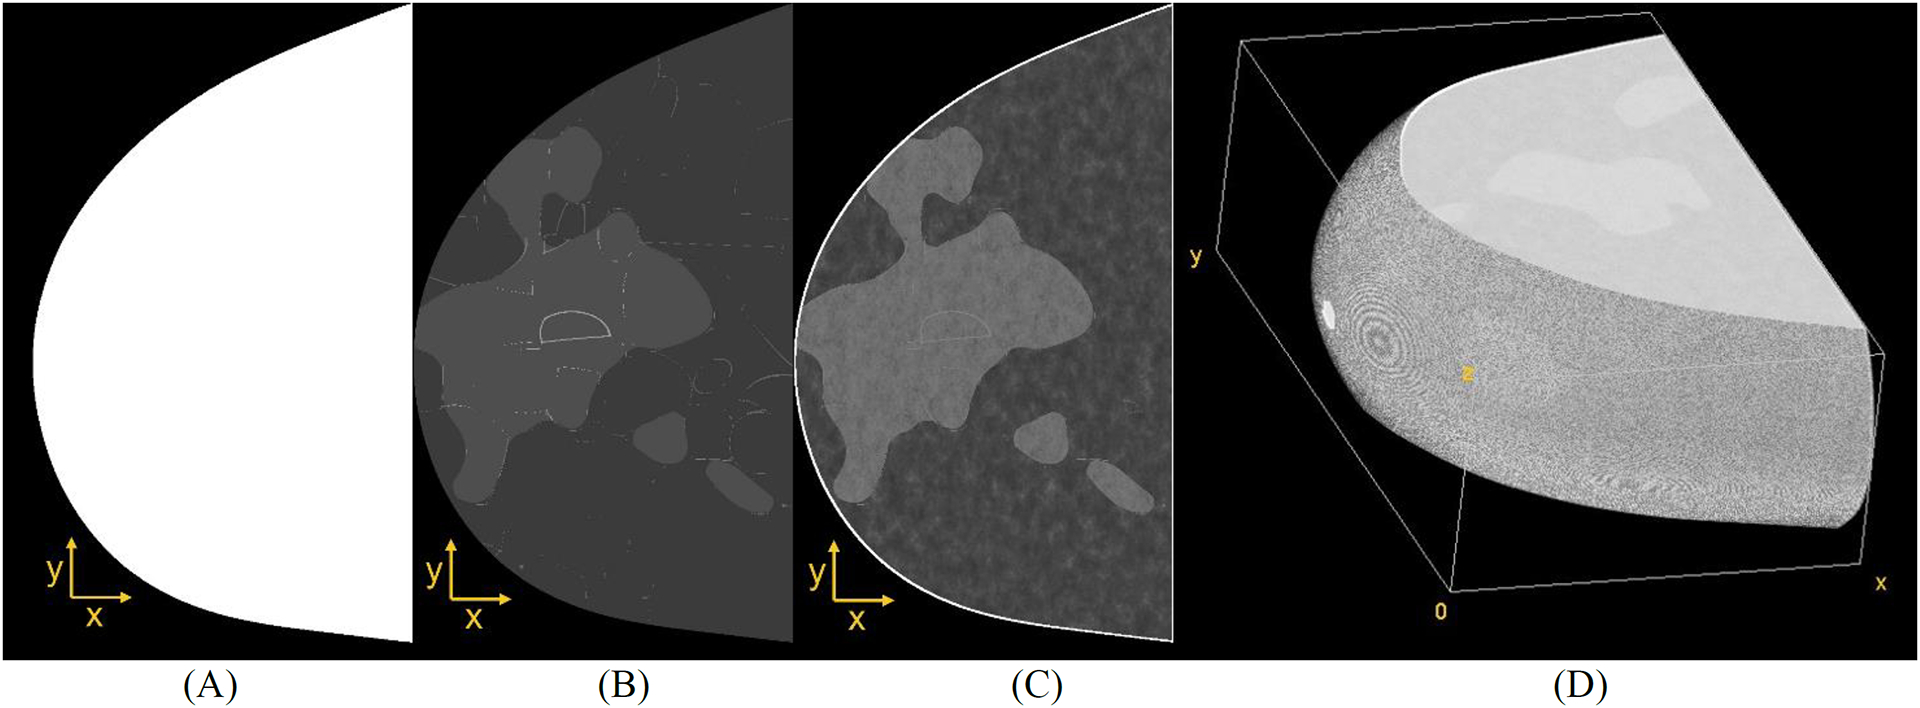
(A) Example of PCA-based breast outline, (B) simulation of coarse tissue, (C) parenchyma simulation, and (D) volume view resulting from Perlin noise-based breast phantom (CC compression).
Recursive partitioning software29 was used to simulate coarse tissue within the binary outline (adipose, glandular, and Cooper’s ligaments shown in Figure 1B). The coarse phantoms were simulated using 25–45% overall volumetric breast density. Note that only dense phantoms were simulated to represent breast anatomies with an increased likelihood of masked lesions. An erosion morphology operation was applied to the binary volumes to simulate the breast skin. The skin thickness was varied randomly in a [0.2, 2.4] mm interval using ball structuring elements.30,31
Finally, 3D fractal noise (also known as Perlin noise)22 was simulated within the internal region of each outline to represent the anatomy of breast parenchyma (Figure 1C).18,32 The fractal noise parameters known as lacunarity, persistence, and octaves were varied using the values {2, 3}, {0.75, 1.00}, and 6, respectively. These parameters were previously reported by Dustler et al.24,25 The noise frequencies were normalized between [0.0001, 1] interval, and the loge was applied to the voxel distribution, resulting in frequencies that are proportional to the linear x-ray attenuation of the materials in the log scale.33 The voxel values were normalized within a 6-bit (unsigned) resolution (where materials 0 and 63 represent air and skin, respectively). The output of this normalization is known as the “Perlin phantom” (Figure 1D).18,32 The Perlin phantoms were simulated using the open-source Perlin-CuPy methods (developed in-site).18,32
2.1.2. Lesions
Soft-tissue lesions (ellipsoidal and spiculated) were simulated and embedded in the Perlin-noise phantoms (Figure 2). Two lesions were embedded in each phantom using a random position in the posteroanterior (x) and chest-wall (y) direction but always in the center of the phantom in the craniocaudal direction (z). The spiculated models were segmented and scaled from contrast-enhanced magnetic resonance images in three orthogonal views (sagittal, coronal, and transverse).34 A voxel additive method35 was used to insert the lesion models in the phantoms. The attenuation of lesions is controlled by varying a weighting factor35 (wl) of the partial volume of voxels. In this study, wl was set to 0.20 and 0.35 for lesions simulated using the ellipsoidal and spiculated models, respectively. The lesion dimensions were 7×7×7 mm3 for both models.
Figure 2.
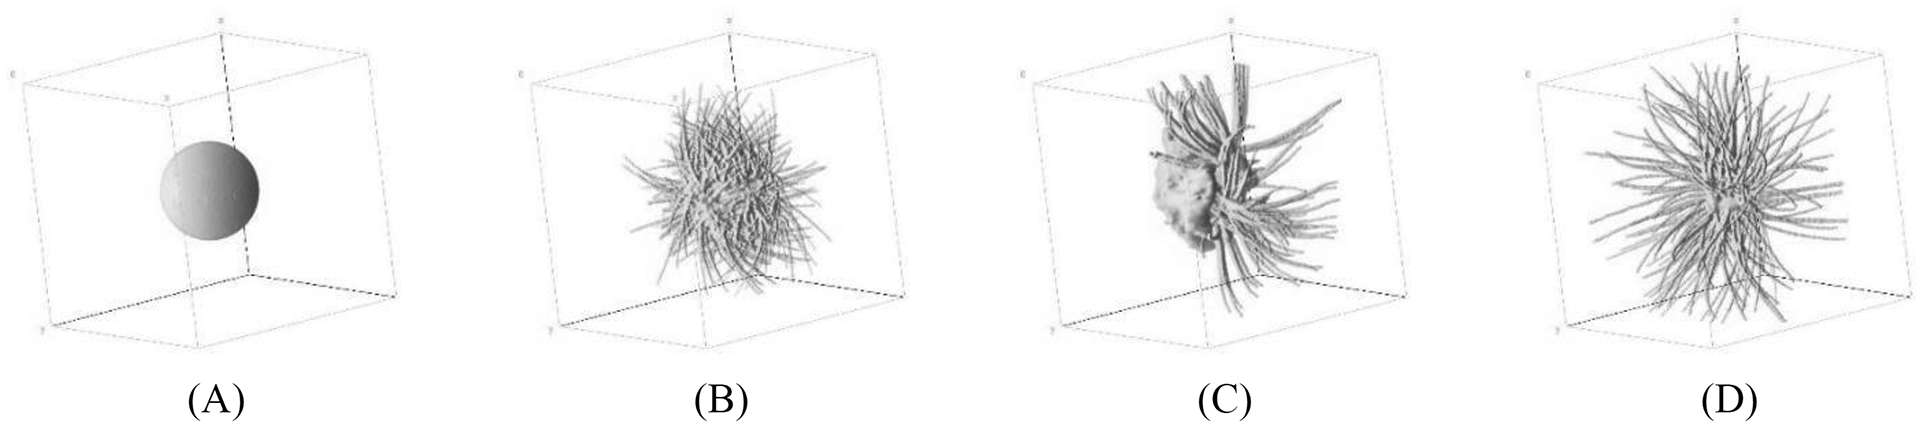
Volume view of breast lesion models: (A) ellipsoidal, and (B-D) spiculated masses.35
2.1.3. X-ray Images and Risk Maps
Each voxel from the simulated breasts represents a composite material that consists of a complementary mixture of adipose and glandular tissue (partial volume).18 For the 61 materials used to simulate Perlin noise (breast tissue and lesions), the composition of the partial volume of voxels decreases linearly from 99% to 1% of adipose tissue and increases linearly from 1% to 99% of glandular tissue.18 These composite materials vary the x-ray attenuation of the images.18
The OpenVCT framework36 was used to simulate DBT projections of the breast phantoms. The projection algorithm uses a fast GPU implementation of the Siddon method for ray-tracing.37 The DBT projections were simulated assuming the conventional acquisition geometry of the NGT system, following a left-to-right scanning motion along the chest wall (Table 1). For the purpose of this study, only the central projection image was used to train the U-Net model (more details in the next section). We want to demonstrate the feasibility of modifying the subsequent x-ray source locations from the NGT default scan. The acquisition exposure settings were simulated using the automatic exposure control data.14 The attenuation coefficient data of the materials used to simulate phantoms come from the International Commission on Radiation Units & Measurements (ICRU) Report 44.38
Table 1.
Summary of DBT acquisition parameters.
| X-Ray Imaging | |
|---|---|
| Number of Projections | 15 |
| Medio-lateral (ML) Distance of Projections (max, mm) | 180 |
| Posterior-anterior (PA) Distance of Projections (max, mm) | 0 |
| Anode and Filter Materials | Tungsten and Aluminum |
| Filter Thickness (mm) | 0.7 |
| Angular Range ML (°) | ±7.5 |
| Tube Motion | Step-and-Shoot |
| Detector | |
| X-Ray Converter Material | Amorphous Selenium (a-Se) |
| Detector Element Size (width × height, mm) | 0.085 × 0.085 |
| Number of Elements (width × height, #) | 3584 × 2816 |
| Detector Size (width × height, mm) | 304.64 × 239.36 |
| Source-to-Image Distance in central projection (mm) | 722.0 |
The maximum intensity projection (MIP) of the coarse phantoms (Figure 1B) was used to create “risk maps” (Figure 3A). MIP projects the coarse voxels from the phantoms with the maximum intensity (i.e., maximum risk) that falls in the way of parallel rays traced from the source to the plane projected at the x-ray detector. The maps were categorized into different classes: background+skin (risk 0), breast tissue predominantly adipose (risk 1), predominantly dense (risk 2), and lesion (risk 3). The maps were used to train a U-Net model along with the corresponding central DBT projection (Figure 3B). The purpose of training the U-Net model in this manner is to demonstrate the feasibility of using a single projection image to identify hotspots, as this could ultimately be applied to designing a system capable of real-time image analysis for task- directed scanning motions.
Figure 3.
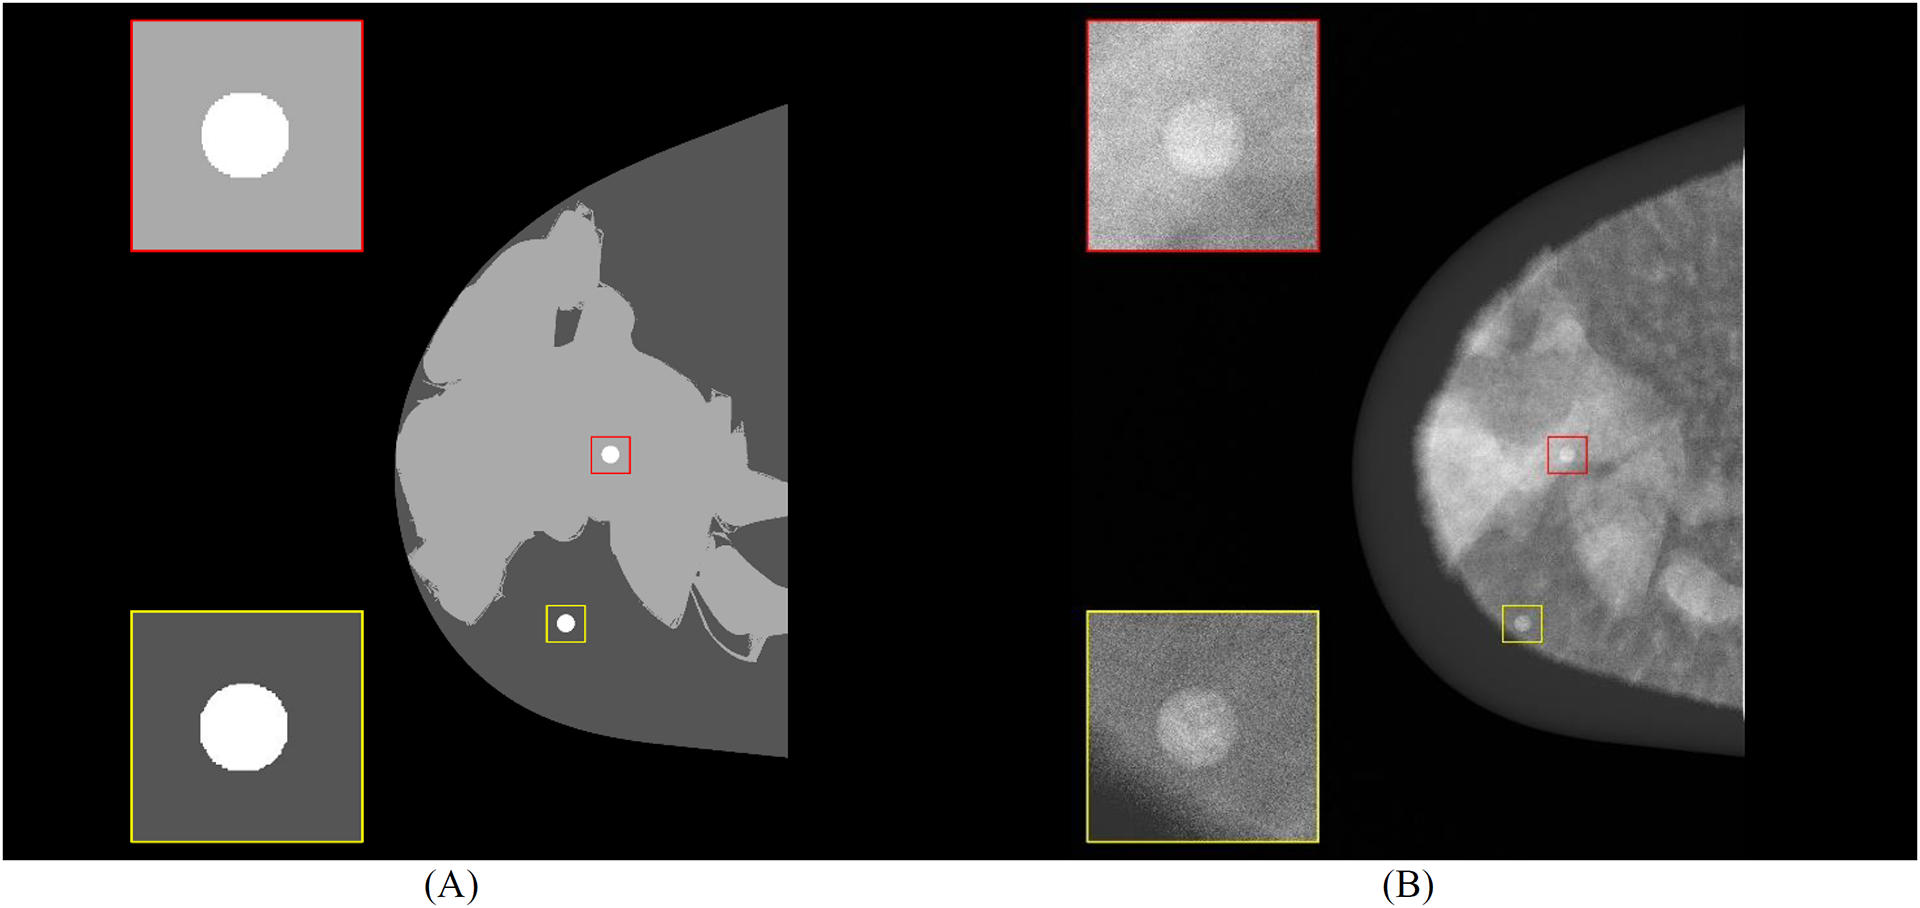
Central slice (craniocaudal) of (A) mask using 4-class masks (background, predominantly adipose, predominantly dense, and diseased tissue) and (B) central DBT projection (for processing - contrast levels modified with window level settings) with highlighted breast curvature (dark gray). Spherical masses embedded in simulated tissue predominantly dense (red) and predominantly adipose (yellow) are shown.
2.2. Multiclass Segmentation
The U-Net architecture26 was used to predict risk maps from DBT projections ([0,1] normalization). The images were cropped to reduce the excessive background and the burden of processing. The cropped region corresponds to the max of CND size of the thickest phantom. The U-Net consists of 4-encoder layers that down-sample the reconstructed images and 4-decoder layers that up-sample the segmented regions of the risk maps (Figure 4). Two convolutions (3×3 kernel) and one max-pooling (2×2 kernel) with leaky rectified linear unit (ReLU) activation are performed in each encoder layer. Padded kernels were used to maintain the aspect ratio of the input images. Batch normalization (BN) was used after each convolution. The final convolution (conv 1×1) maps a feature vector (feature maps) to the number of classes.
Figure 4.
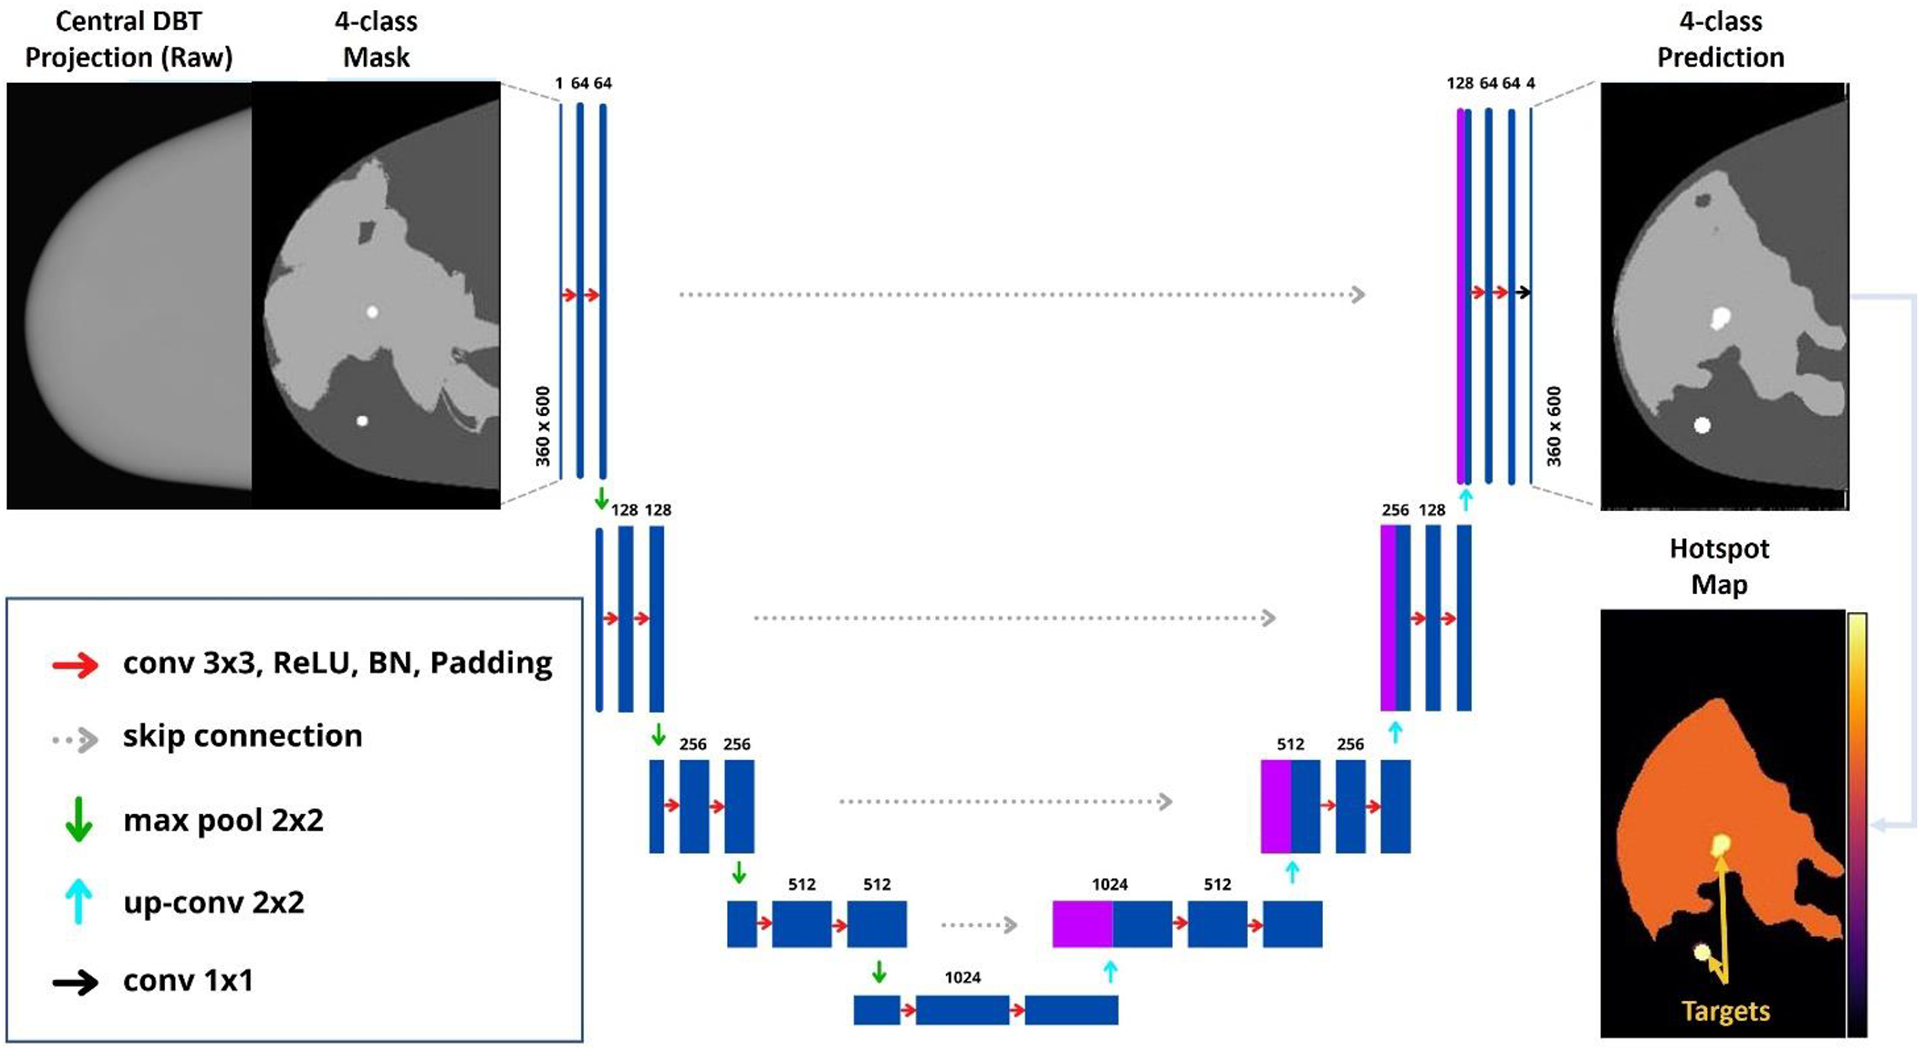
U-Net architecture implemented for multiclass segmentation of risk maps.
A U-Net model was trained for multi-class segmentation using four classes (Figure 3). The model was trained on two NVIDIA Quadro P5000 GPUs with 32 GB of RAM. We used a batch size of 22, 12 workers (sub-processes used for loading images), learning rate of 1×10⁻⁵, and Adam optimizer. Early stopping was used to optimize the number of epochs of each training model (max of 250 epochs) and to avoid poor generalization performance. Weighted cross-entropy was used as the loss function (weights 1, 1, 2, 2). The hyperparameters multiplicator (weights) and learning rate were optimized using weights and bias sweeps (wandb, version 0.12). The model was built using PyTorch 1.10 and Python 3.9.9.
In total, 168, 48, and 24 input images (360×600 pixels) were used for training, validation, and testing, respectively (ratio 70:20:10%, respectively). For each set, the input images were randomly selected but equally distributed by volumetric breast density, lesion type, Perlin parameters, and breast thickness to avoid bias in the training models. The predictions of the test set were obtained, and the predictions for each class (softmax) were used to create hotspot maps (Figure 4).
The performance of the models was evaluated using the area under the pooled receiver operating characteristic (ROC) curve (AUC). The R libraries “pROC” (version 1.17) and “auctestr” (version 1.0) were used to collect the ROC statistics. The operating point of the ROC curve was defined to be the point that minimizes Euclidean distance relative to the upper left corner of ROC space; at this operating point, we calculated the true positive rate (TPR), true negative rate (TNR), positive predictive value (PPV), and negative predictive value (NPV). Finally, the segmentation metrics Jaccard (Jac) and Dice coefficients were calculated using the 4-class predictions.
3. RESULTS
Our preliminary results have shown that the developed software is capable of precisely segmenting regions with the lowest risk of lesions (risk class 0, Figure 5B) in the central projection (Figure 5A). The software predictions (Figure 5C) indicate efficient differentiation between tissue predominantly adipose (risk class 1) and predominantly dense (risk class 2). In addition, regions with lesions are segmented by the U-Net models and classified with the highest risk (risk class 3). Note that the “hottest spots” (i.e., peaks of confidence) show the highest peaks of regions with lesions in the confidence images (Figure 5D). For future work, we will use the hotspot images to reduce the number of false positives from the predictions.
Figure 5.
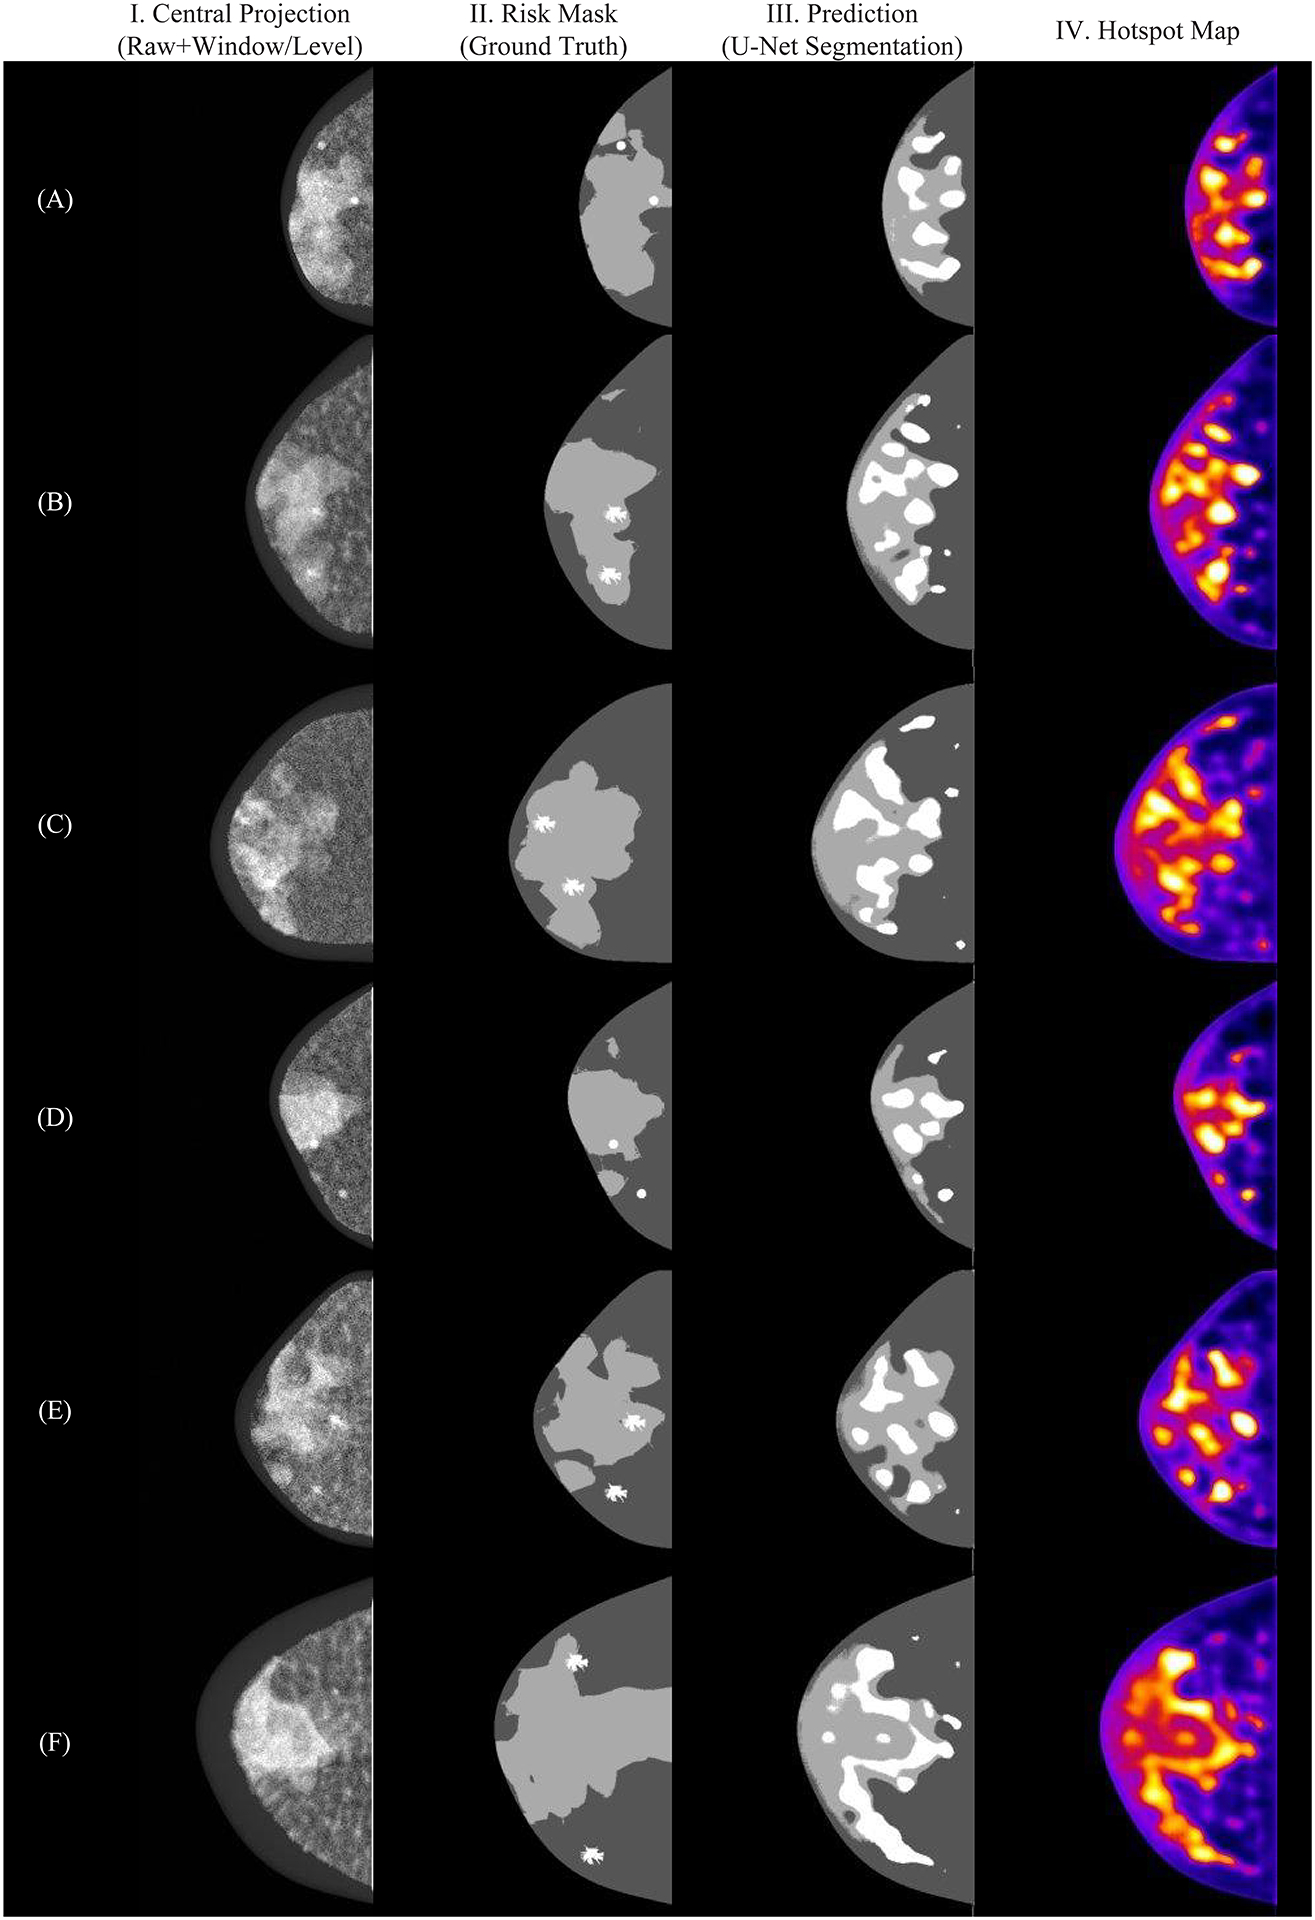
Examples of multi-class segmentation using U-Net model: (I) central projection, (II) risk masks, (III) predictions and (IV) hotspot map.
The multiclass model shows an ideal segmentation for risk class 0 (Figure 6B). Thus, the classification metrics were calculated without considering the predicted values for this class. For risk class 1, the ROC (Figure 6A) resulted in an AUC value of 0.93, demonstrating an effective segmentation of predominantly adipose tissue. Risk class 3 resulted in the lowest values of Dice (0.11) and Jaccard (0.06) due to a large number of false positives. However, this class shows a high TPR (0.80), which is comparable to risk class 2 (0.81). This result is consistent with the hotspots (i.e., peaks of confidence) found in the confidence images (Figure 5B).
Figure 6.
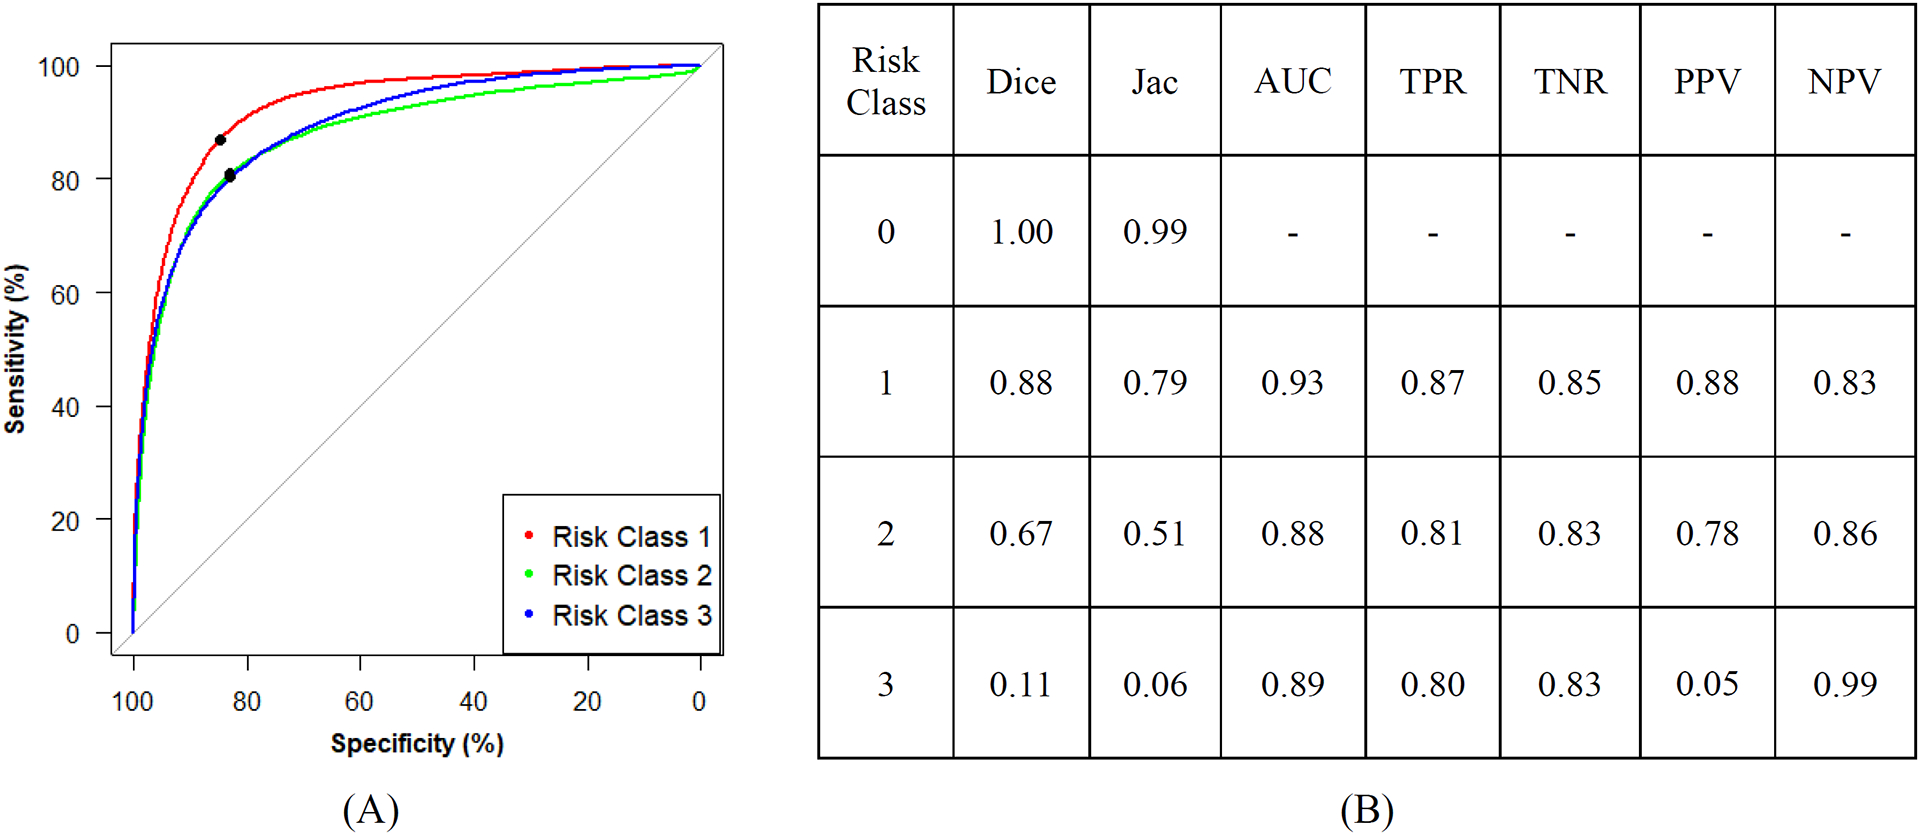
(A) Receiver operating characteristic curves (operating point in black) and (B) summary of segmentation and classification metrics.
The weighted cross-entropy loss maximizes the accuracy of the learning model, avoiding overfitting due to imbalanced data between the four classes. Based on these results, the sweeping of hyperparameters penalizes the segmentation of predominantly dense tissue to improve the segmentation of lesions, improving the accuracy of locating hotspot regions.
4. DISCUSSION AND CONCLUSION
The sensitivity of cancer detection by screening mammography is reduced in women with dense breasts, resulting in masked cancers and mischaracterizations of lesions. In this work, we have developed an automated method to identify suspicious areas in breast phantoms with a single 2D projection image. Our future work will apply this method to designing a DBT system capable of identifying suspicious areas in real time and dynamically calculating the scanning motion that optimizes visualization of these areas, potentially improving the sensitivity of cancer detection and the characterization of suspicious findings. It is important to mention that the ultimate goal of the software is not to be used as a computer-aided diagnosis (CAD) system. Instead, the software should be used to indicate regions with a higher likelihood of cancer.
This study has some limitations. Spiculated lesions have sharp ramifications on the tumor that can vary greatly in density and length, from a few millimeters to several centimeters (Figure 2). These ramifications complicate the segmentation, reducing the performance of the model shown in the segmentation metrics (Figure 5B). In addition, the linear attenuation coefficient of the lesions composed of soft tissue is very close to the dense tissue, which compromises the differentiation between risk class 2 and 3. However, the ultimate goal of this study is not the perfect segmentation of lesions (or dense tissue). Instead, we will use this software to indicate the locations of suspicious findings to improve the NGT acquisitions.
Another limitation of this study is that the U-Net model for identifying hotspots was developed with virtual breast phantoms as opposed to clinical images. Future work will explore alternate strategies for training the U-Net model using clinical images with known findings. In addition, we will increase the number of images for the test and validation set, use cross-validation during the training process, and investigate the use of alternative focal loss functions to improve the segmentation of the U-Net.
ACKNOWLEDGEMENTS
The authors want to thank Dr. Hilde Bosmans for providing the models of spiculated masses used in this work. Funding for the research is supported primarily by the 2020 AAPM Research Seed Funding Grant. The following grants also support this research: BWF IRSA 1016451, DoD W81XWH-18-1-0082, NCI P30 CA016520, and a 2022 Young Investigator Grant through Breast Cancer Alliance, Inc.
REFERENCES
- [1].Bird RE, Wallace TW and Yankaskas BC, “Analysis of cancers missed at screening mammography.,” Radiology (2014). [DOI] [PubMed] [Google Scholar]
- [2].Nelson HD, O’Meara ES, Kerlikowske K, Balch S and Miglioretti D, “Factors associated with rates of false-positive and false-negative results from digital mammography screening: An analysis of registry data,” Annals of Internal Medicine (2016). [DOI] [PMC free article] [PubMed] [Google Scholar]
- [3].Buchberger W, Niehoff A, Obrist P, DeKoekkoek-Doll P and Dünser M, “Clinically and mammographically occult breast lesions: Detection and classification with high-resolution sonography,” Seminars in Ultrasound CT and MRI (2000). [DOI] [PubMed] [Google Scholar]
- [4].Crystal P, Strano SD, Shcharynski S and Koretz MJ, “Using sonography to screen women with mammographically dense breasts,” American Journal of Roentgenology (2003). [DOI] [PubMed] [Google Scholar]
- [5].Gordon PB and Goldenberg SL, “Malignant breast masses detected only by ultrasound. A retrospective review,” Cancer (1995). [DOI] [PubMed] [Google Scholar]
- [6].Kaplan SS, “Clinical Utility of Bilateral Whole-Breast US in the Evaluation of Women with Dense Breast Tissue,” Radiology (2001). [DOI] [PubMed] [Google Scholar]
- [7].Kolb TM, Lichy J and Newhouse JH, “Comparison of the Performance of Screening Mammography, Physical Examination, and Breast US and Evaluation of Factors that Influence Them: An Analysis of 27,825 Patient Evaluations,” Radiology (2002). [DOI] [PubMed] [Google Scholar]
- [8].Leconte I, Feger C, Galant C, Berlière M, Vande Berg B, D’Hoore W and Maldague B, “Mammography and subsequent whole-breast sonography of nonpalpable breast cancers: The importance of radiologic breast density,” American Journal of Roentgenology (2003). [DOI] [PubMed] [Google Scholar]
- [9].Vourtsis A and Berg WA, “Breast density implications and supplemental screening,” European Radiology (2018). [DOI] [PMC free article] [PubMed] [Google Scholar]
- [10].Berg WA, “Tailored supplemental screening for breast cancer: What now and what next?,” American Journal of Roentgenology (2009). [DOI] [PubMed] [Google Scholar]
- [11].Kuhl CK, Schrading S, Leutner CC, Morakkabati-Spitz N, Wardelmann E, Fimmers R, Kuhn W and Schild HH, “Mammography, breast ultrasound, and magnetic resonance imaging for surveillance of women at high familial risk for breast cancer,” Journal of Clinical Oncology (2005). [DOI] [PubMed] [Google Scholar]
- [12].Phi XA, Houssami N, Hooning MJ, Riedl CC, Leach MO, Sardanelli F, Warner E, Trop I, Saadatmand S, Tilanus-Linthorst MMA, Helbich TH, van den Heuvel ER, de Koning HJ, Obdeijn IM and de Bock GH, “Accuracy of screening women at familial risk of breast cancer without a known gene mutation: Individual patient data meta-analysis,” European Journal of Cancer (2017). [DOI] [PubMed] [Google Scholar]
- [13].Acciavatti RJ, Barufaldi B, Vent TL, Wileyto EP and Maidment ADA, “Personalization of x-ray tube motion in digital breast tomosynthesis using virtual Defrise phantoms,” Progress in Biomedical Optics and Imaging - Proceedings of SPIE 10948 (2019). [DOI] [PMC free article] [PubMed] [Google Scholar]
- [14].Vent TL, Barufaldi B, Acciavatti RJ, Krishnamoorthy S, Surti S and Maidment ADA, “Next generation tomosynthesis image acquisition optimization for dedicated PET-DBT attenuation corrections,” 2021. [Google Scholar]
- [15].Abadi E, Segars WP, Tsui BMW, Kinahan PE, Bottenus N, Frangi AF, Maidment A, Lo J and Samei E, “Virtual clinical trials in medical imaging: a review,” Journal of Medical Imaging 7(4), 042805–1–40 (2020). [DOI] [PMC free article] [PubMed] [Google Scholar]
- [16].Vent TL, Barufaldi B, Acciavatti RJ and Maidment A, “Simulation of high-resolution test objects using non-isocentric acquisition geometries in next-generation digital tomosynthesis,” 2020. [Google Scholar]
- [17].Barufaldi B, Bakic PR, Higginbotham D and Maidment ADA, “OpenVCT: a GPU-accelerated virtual clinical trial pipeline for mammography and digital breast tomosynthesis,” SPIE Medical Imaging 2018 1057358(March), 1–8, SPIE Digital Library, Houston, TX: (2018). [Google Scholar]
- [18].Barufaldi B, Abbey CK, Lago MA, Vent TL, Acciavatti RJ, Bakic PR and Maidment ADA, “Computational Breast Anatomy Simulation Using Multi-scale Perlin Noise,” IEEE Transactions on Medical Imaging xx(X), 1–11 (2021). [DOI] [PMC free article] [PubMed] [Google Scholar]
- [19].Mainprize JG, Alonzo-Proulx O, Jong RA and Yaffe MJ, “Quantifying masking in clinical mammograms via local detectability of simulated lesions,” Medical Physics 43(3), 1249–1258 (2016). [DOI] [PubMed] [Google Scholar]
- [20].Alonzo-Proulx O, Mainprize JG, Harvey JA and Yaffe MJ, “Investigating the feasibility of stratified breast cancer screening using a masking risk predictor,” Breast Cancer Research 21(1), 1–9 (2019). [DOI] [PMC free article] [PubMed] [Google Scholar]
- [21].Zhao B, Zhou J, Hu YH, Mertelmeier T, Ludwig J and Zhao W, “Experimental validation of a three- dimensional linear system model for breast tomosynthesis,” Medical Physics (2009). [DOI] [PMC free article] [PubMed] [Google Scholar]
- [22].Perlin K, “Improving Noise,” ACM Transactions on Graphics (2002). [Google Scholar]
- [23].Worley S, “A cellular texture basis function,” Proceedings of the 23rd Annual Conference on Computer Graphics and Interactive Techniques, SIGGRAPH 1996 (1996). [Google Scholar]
- [24].Dustler M, Bakic P, Petersson H, Timberg P, Tingberg A and Zackrisson S, “Application of the fractal Perlin noise algorithm for the generation of simulated breast tissue,” Medical Imaging 2015: Physics of Medical Imaging (2015). [Google Scholar]
- [25].Dustler M, Lång K and Petersson H, “Binary implementation of fractal Perlin noise to simulate fibroglandular breast tissue,” 193 (2018). [Google Scholar]
- [26].Ronneberger O, Fischer P and Brox T, “U-net: Convolutional networks for biomedical image segmentation,” Lecture Notes in Computer Science (including subseries Lecture Notes in Artificial Intelligence and Lecture Notes in Bioinformatics) (2015). [Google Scholar]
- [27].Rodríguez-Ruiz A, Agasthya GA and Sechopoulos I, “The compressed breast during mammography and breast tomosynthesis: in vivo shape characterization and modeling,” Physics in Medicine & Biology 62(17), 6920–6937 (2017). [DOI] [PMC free article] [PubMed] [Google Scholar]
- [28].Rodriguez-Ruiz A, Feng SSJ, Van Zelst J, Vreemann S, Mann JR, D’Orsi CJ and Sechopoulos I, “Improvements of an objective model of compressed breasts undergoing mammography: Generation and characterization of breast shapes,” Medical Physics 44(6), 2161–2172 (2017). [DOI] [PMC free article] [PubMed] [Google Scholar]
- [29].Pokrajac DD, Maidment ADA and Bakic PR, “Optimized generation of high resolution breast anthropomorphic software phantoms,” Medical Physics 39(4), 2290 (2012). [DOI] [PMC free article] [PubMed] [Google Scholar]
- [30].Pietzsch T, Preibisch S, Tomančák P and Saalfeld S, “Img lib 2-generic image processing in Java,” Bioinformatics (2012). [DOI] [PMC free article] [PubMed] [Google Scholar]
- [31].Sutradhar A and Miller MJ, “In vivo measurement of breast skin elasticity and breast skin thickness,” Skin Research and Technology 19(1), 191–199 (2013). [DOI] [PubMed] [Google Scholar]
- [32].Teixeira JPV and Barufaldi B, “Perlin-CuPy: Perlin-NumPy for GPU,” Github, 2021, <https://github.com/jpvt/perlin-cupy>. [Google Scholar]
- [33].Rumble JR, Bickham DM and Powell CJ, “The NIST x‐ray photoelectron spectroscopy database,” Surface and Interface Analysis (1992). [Google Scholar]
- [34].Shaheen E, De Keyzer F, Bosmans H, Dance DR, Young KC and Ongeval Van. C, “The simulation of 3D mass models in 2D digital mammography and breast tomosynthesis,” Medical Physics 41(8), 10–12 (2014). [DOI] [PubMed] [Google Scholar]
- [35].Barufaldi B, Vent TL, Bakic PR and Maidment ADA, “Computer simulations of case difficulty in digital breast tomosynthesis using virtual clinical trials,” Med. Phys. - Early View, 1–13 (2022). [DOI] [PubMed] [Google Scholar]
- [36].Barufaldi B, Bakic P and Maidment ADA, “Open Virtual Clinical Trials,” OpenVCT: a GPU-accelerated virtual clinical trial pipeline for mammography and digital breast tomosynthesis, 2020, <https://sourceforge.net/projects/openvct/> (10 March 2019). [Google Scholar]
- [37].Siddon RL, “Fast calculation of the exact radiological path for a three dimensional CT array,” Medical Physics 12(2), 252–255 (1985). [DOI] [PubMed] [Google Scholar]
- [38].ICRU., “ICRU Report 44 - Tissue Substitutes in Radiation Dosimetry and Measurement” (1988). [Google Scholar]
- [39].Barufaldi B, Bakic PR and Maidment ADA, “Multiple-reader, multiple-case ROC analysis for determining the limit of calcification detection in tomosynthesis,” SPIE Medical Imaging 2019: Physics of Medical Imaging 10948(March), 22 (2019). [Google Scholar]