

Abstract
Targeting Meis1 and Hoxb13 transcriptional activity could be a viable therapeutic strategy for heart regeneration. In this study, we performd an in silico screening to identify FDA-approved drugs that can inhibit Meis1 and Hoxb13 transcriptional activity based on the resolved crystal structure of Meis1 and Hoxb13 bound to DNA. Paromomycin (Paro) and neomycin (Neo) induced proliferation of neonatal rat ventricular myocytes in vitro and displayed dose-dependent inhibition of Meis1 and Hoxb13 transcriptional activity by luciferase assay and disruption of DNA binding by electromobility shift assay. X-ray crystal structure revealed that both Paro and Neo bind to Meis1 near the Hoxb13-interacting domain. Administration of Paro–Neo combination in adult mice and in pigs after cardiac ischemia/reperfusion injury induced cardiomyocyte proliferation, improved left ventricular systolic function and decreased scar formation. Collectively, we identified FDA-approved drugs with therapeutic potential for induction of heart regeneration in mammals.
Heart failure is a devastating disease affecting close to 30 million patients worldwide1, and, thus, finding effective therapies for heart failure is a major public health goal. An important underlying cause of systolic heart failure is the inability of the adult myocardium to regenerate itself after injury. Although the adult mouse2 and human3 hearts have a limited capacity for cardiomyocyte turnover, this low turnover rate is insufficient to restore cardiac function after substantial cardiomyocyte loss and, thus, is not therapeutically relevant. In contrast, neonatal mammals and several lower vertebrates4,5 have a robust endogenous cardiac regenerative capacity, mediated by the proliferation of existing cardiomyocytes, which can restore normal cardiac function after injury6. Unfortunately, this regenerative capacity is lost by postnatal day (P) 7 in mammals, coinciding with the cycle exit of cardiomyocytes5,7. Numerous regulators of postnatal cardiomyocyte cell cycle have been described, including direct cell cycle regulators such as cyclins8,9, DNA and histone modifiers10,11, transcription factors (TFs)12, microRNAs13,14 as well as kinases12,15 and phosphatases16, among others. In addition, the closure of fetal shunts after birth results in substantial hemodynamic and oxygenation changes17. This activates several pathways that mediate a switch in the growth mode of cardiomyocytes, from hyperplastic to hypertrophic, resulting in permanent cell cycle withdrawal. Mechanistically, the TFs Meis1 and Hoxb13 translocate to cardiomyocyte nuclei at P7 and mediate this growth mode switch through activation of a network of cell cycle and cardiomyocyte maturation genes. Importantly, concomitant deletion of both Meis1 and Hoxb13 reverses adult cardiomyocyte cell cycle arrest and results in a marked improvement of left ventricular function after myocardial infarction (MI) in mice18. These results suggest that the induction of cardiomyocyte proliferation after the loss of Meis1 and Hoxb13 transcriptional activity may be a viable strategy for heart regeneration. Therefore, pharmacological targeting of Meis1–Hoxb13 has the potential to stimulate cell cycle re-entry and improve cardiac function after injury. Historically, TFs are considered ‘undruggable’ molecular targets due to challenges associated with targeting protein–DNA interaction, such as the highly positively charged nature of protein–DNA interaction interface or protein–protein interaction owing to the flat nature of protein–protein interaction interface19. However, this dogma has recently been challenged with the development of various drug discovery strategies that helped identify preclinical and clinical chemical entities to disrupt protein–protein interactions, inhibit transcription factor–DNA binding, target proteasomal degradation of TFs or inhibit TF expression20. Indeed, targeting TFs with small molecules has generated cancer therapeutics, particularly in leukemia21. Previously, our group established a platform for structure-based drug repurposing of FDA-approved drugs that can target novel molecular pathways using existing drugs to accelerate the delivery of therapeutics to the clinic22. In the present study, we used our platform to identify FDA-approved drugs that can inhibit Meis1 and Hoxb13 transcriptional activity and induce cardiomyocyte proliferation and heart regeneration in vivo.
Results
In silico screening for MEIS1–HOXB13 transcriptional inhibitors
Although targeting TFs pharmacologically is notoriously problematic, this is partly due to a lack of structural understanding of the TF–DNA interaction domains. Fortunately, the crystal structure of MEIS1–HOXB13 complex bound to DNA has been recently determined23. The crystal structure of HOXB13:MEIS1-DNA provided the structural insights for MEIS1 and HOXB13 binding behavior with the respective DNA-binding domains (DBDs) via hydrophobic interactions and stabilized by a network of hydrogen bonds (Protein Data Bank (PDB) ID: 5EGO)23. Our preliminary structural analysis revealed three potential druggable sites: S1 (HOXB13 bound to DNA), S2 (MEIS1 bound to DNA) and S3 (the MEIS1–HOXB13 interaction domain) (Fig. 1a). For the S3 site, key amino acid residues that can create a potential binding pocket between the MEIS1 and HOXB13 interface include T 296, H 297, P 298, Y 299, P 300 and S 301 for MEIS1 and K 218, K 219, R 220, I 221, P 222, Y 223 and S 224 for HOXB13. We applied our structure-based drug repurposing platform by docking the energy-minimized FDA-approved drug library to the three potential sites outlined earlier. Our top hits were paromomycin (Paro), neomycin (Neo), rutin, hesperidin, nystatin, kanamycin, amikacin, amphotericin B and streptomycin, based on their (1) energy profiles, (2) preferential binding modes and (3) clinical indication/side effect profile (Fig. 1b). In addition, we examined the two-dimensional (2D) chemical structure of Paro and Neo. Both drugs share a similar structure, except for OH and NH2 groups (Extended Data Fig. 1a). Both Paro and Neo showed a potential binding affinity at different energy profiles to S1 (−12.8545 and −15.4412 kcal mol−1), S2 (−17.6182 and −15.7070 kcal mol−1) and S3 (−10.3948 and −7.7311 kcal mol−1) domains, respectively (Fig. 1c and Extended Data Fig. 1b).
Fig. 1 |. Identification of Paro and Neo as FDA-approved drugs targeting MEIS1–HOXB13.

a, Structural insights for potential druggable sites for MEIS1–HOXB13. S1: HOXB13 DBD, S2: MEIS1 DBD and S3: interacting interface between MEIS1 and HOXB13 (PDB ID: 5EGO). b, In silico screening platform identification top FDA-approved drugs that may target S1, S2 and S3. c, Interacting energies (ΔG) for the top candidates targeting S1, S2 and S3 of MEIS1–HOXB13 crystal structure. d, Immunostaining for pH3 (green) and cardiac troponin T (red) (left), showing the percentage of mitotic NRVMs (arrowheads) (right). e,f, Luciferase reporter results after transfection of p15 promoter reporter construct plus Meis1A (e) or Hoxb13-GFP (f) constructs with Paro and Neo in 293T cells. Data in d–f were independently repeated at least three times with similar results. Data are presented as mean ± s.e.m. Statistical analyses: one-way ANOVA with Dunnett’s post hoc test (d); two-way ANOVA with Tukey’s post hoc test (e,f); *P < 0.05, **P < 0.01, ***P < 0.001 and ****P < 0.0001. Scale bars, 100 μm (d).
In vitro screening of top candidates on neonatal rat ventricular myocyte proliferation
We first evaluated the aforementioned nine drugs for their capacity to enhance the proliferation of neonatal rat ventricular myocytes (NRVMs) by immunostaining. Cultured NRVMs treated with 10 μM of the top candidates were stained with the mitotic marker phospho histone H3-S10 (pH3), cardiac troponin T (cTnT) and nuclear (DAPI). Only Paro-treated and Neo-treated showed a significant increase in pH3-positive (pH3+) cardiomyocytes up to five-fold, compared to vehicle-treated NRVMs, suggesting their potential for promoting cardiomyocyte proliferation (Fig. 1d).
Paro and Neo suppress MEIS1–Hoxb13 transcriptional activity
Next, we screened Paro, Neo, rutin and hesperidin to evaluate their potential to inhibit MEIS1 and Hoxb13 transcriptional activity on the p15 promoter using luciferase assay. We tested two different controls because Paro and Neo are soluble in PBS, and rutin and hesperidin are soluble in DMSO. Interestingly, treatment of Paro or Neo significantly reduced the luciferase signal of MEIS1 or Hoxb13-mediated p15 promoter activity in a dose-dependent manner ranging from 10 nM to 500 nM compared to control (PBS) (Fig. 1e,f). On the other hand, rutin and hesperidin showed poor inhibitory profiles for luciferase activity compared to DMSO as control (Extended Data Fig. 1c,d). These results suggest that Paro and Neo can inhibit MEIS1–Hoxb13 transcriptional activity.
Paro and Neo disrupt Meis1-DNA and Hoxb13-DNA binding in vitro
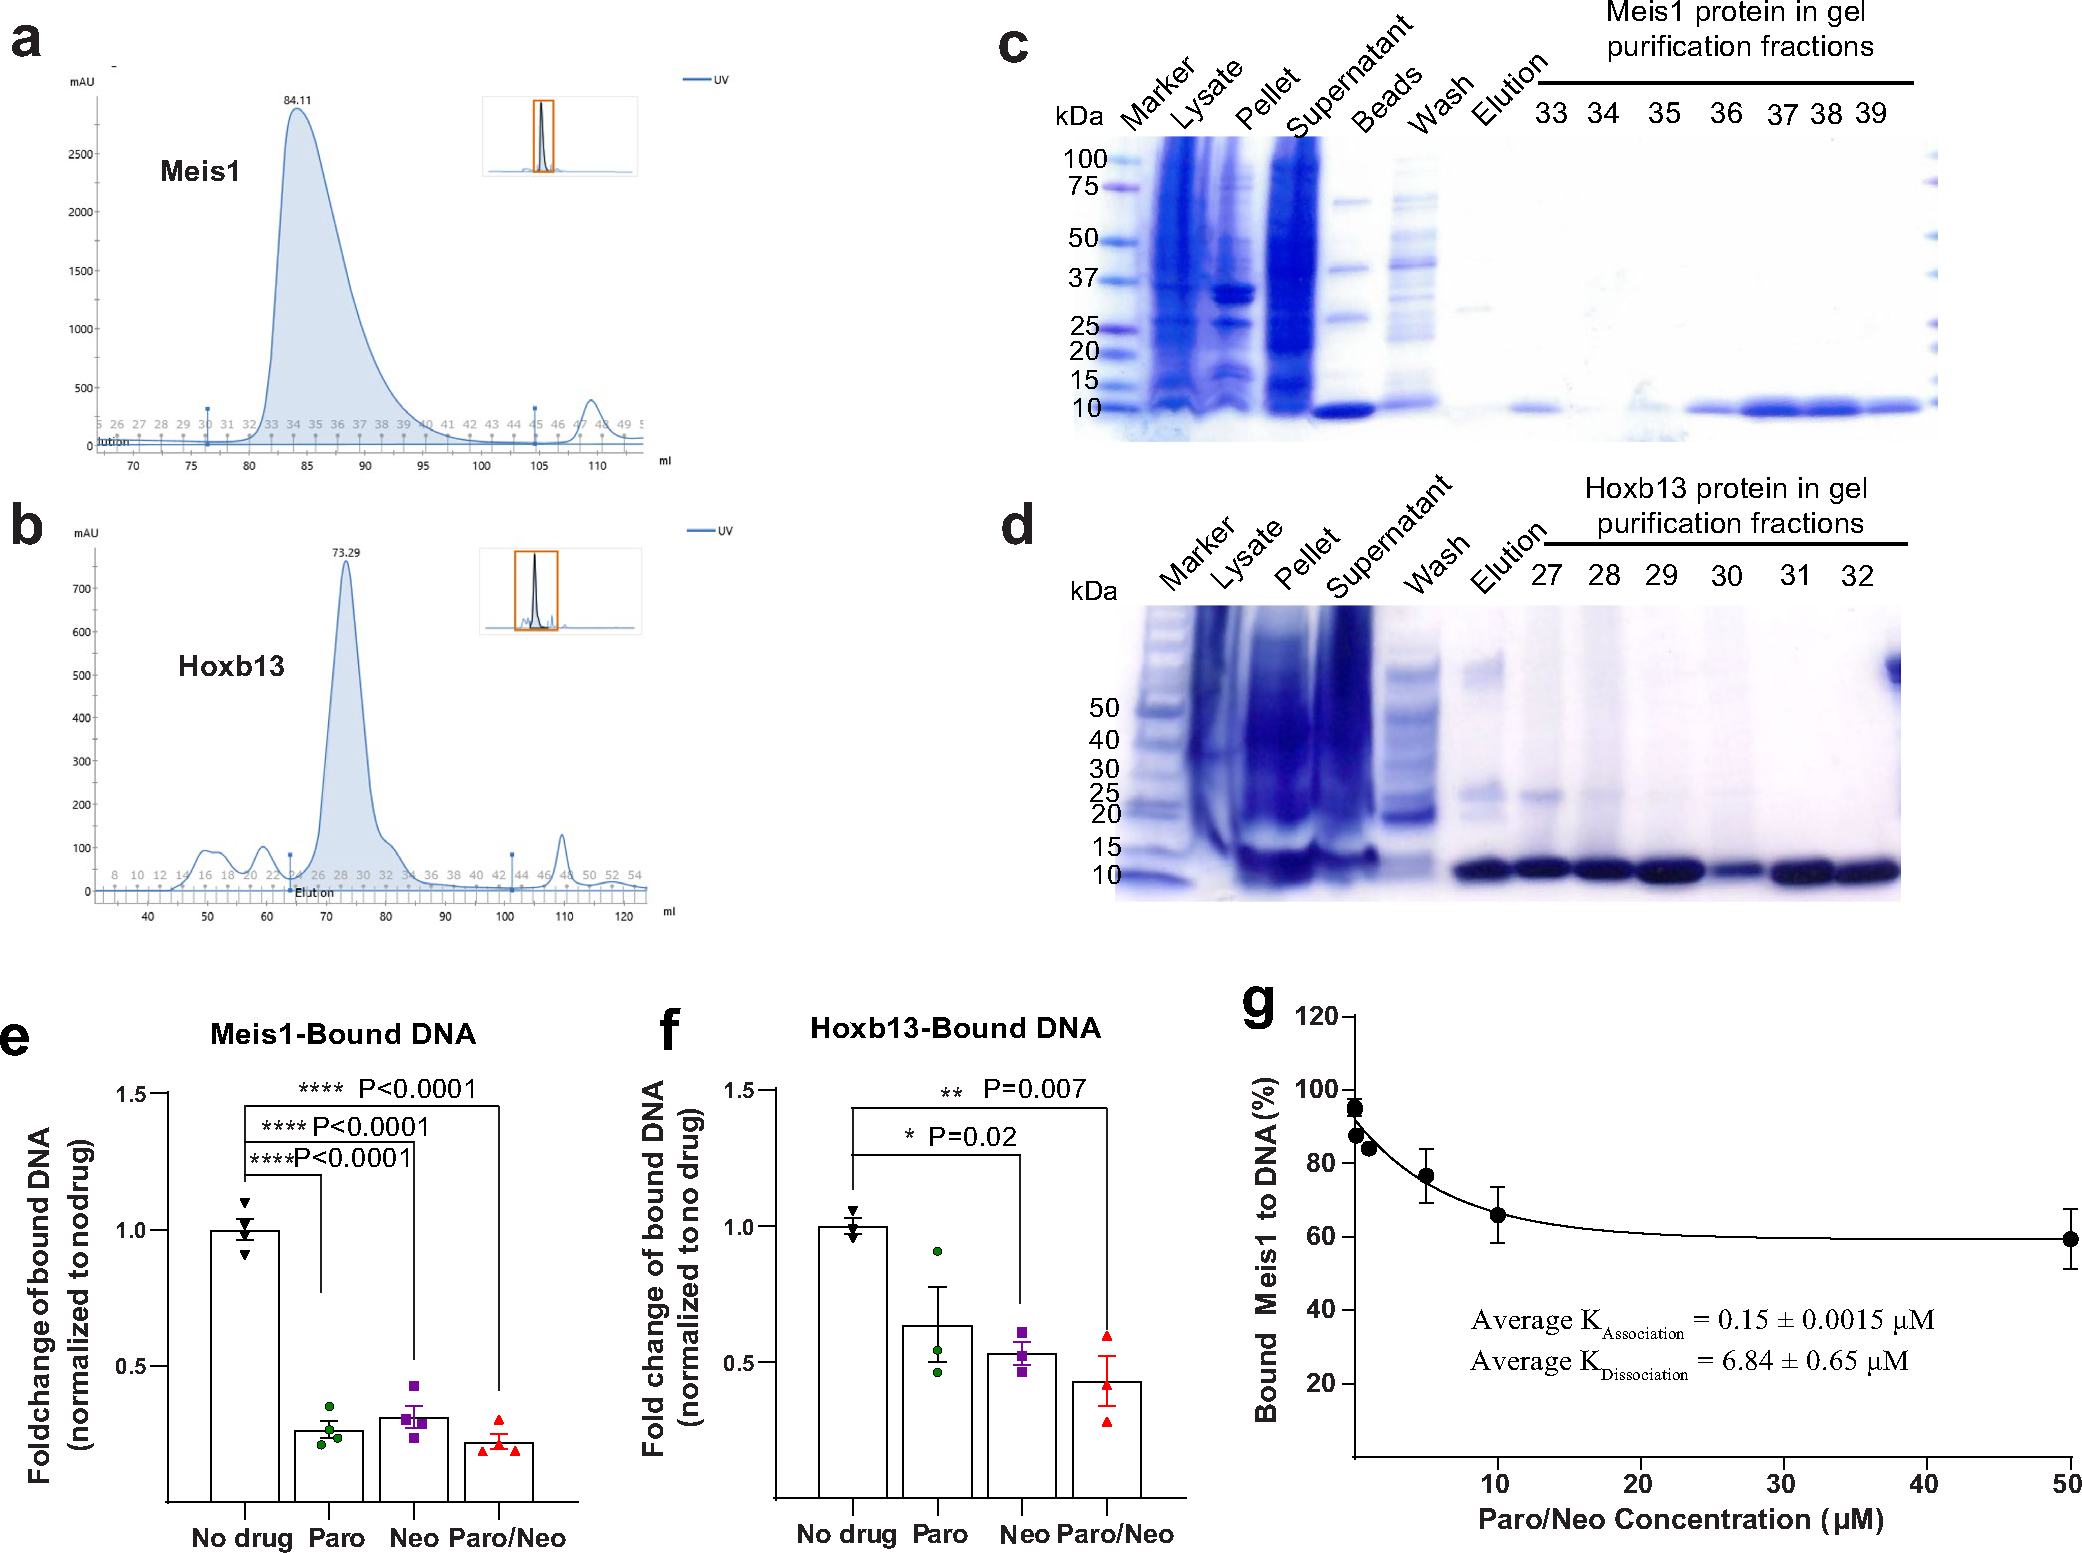
To gain further insights into the DNA binding properties of Meis1 and Hoxb13 in the presence of Paro and Neo, we cloned, expressed and purified the DBDs of Meis1 and Hoxb13 (Extended Data Fig. 2a–d). Subsequently, we conducted an in vitro electromobility shift assay (EMSA) for the two proteins separately in the presence of the drugs and the consensus binding DNA sequence for Meis1 and Hoxb13. The presence of Paro, Neo and equimolar ratio of Paro–Neo combination promoted a significant disruption of Meis1-DNA or Hoxb13-DNA binding, resulting in the accumulation of more unbound DNA (Fig. 2a,b), with corresponding less bound DNA (Extended Data Fig. 2e,f) compared to control. Interestingly, the Paro–Neo combination showed the highest capacity in disrupting the binding of Meis1 and Hoxb13 to the DNA. Furthermore, the Paro–Neo combination showed a 6.84 ± 0.65 μM dissociation constant for Meis1-DNA binding in EMSA assays across 0.001–50 μM drug concentrations (Extended Data Fig. 2g). Collectively, these results support the notion that Paro and Neo can directly interfere with the binding of Meis1 and Hoxb13 to DNA.
Fig. 2 |. Paro and Neo interfere with Meis1, Hoxb13 and DNA interactions.

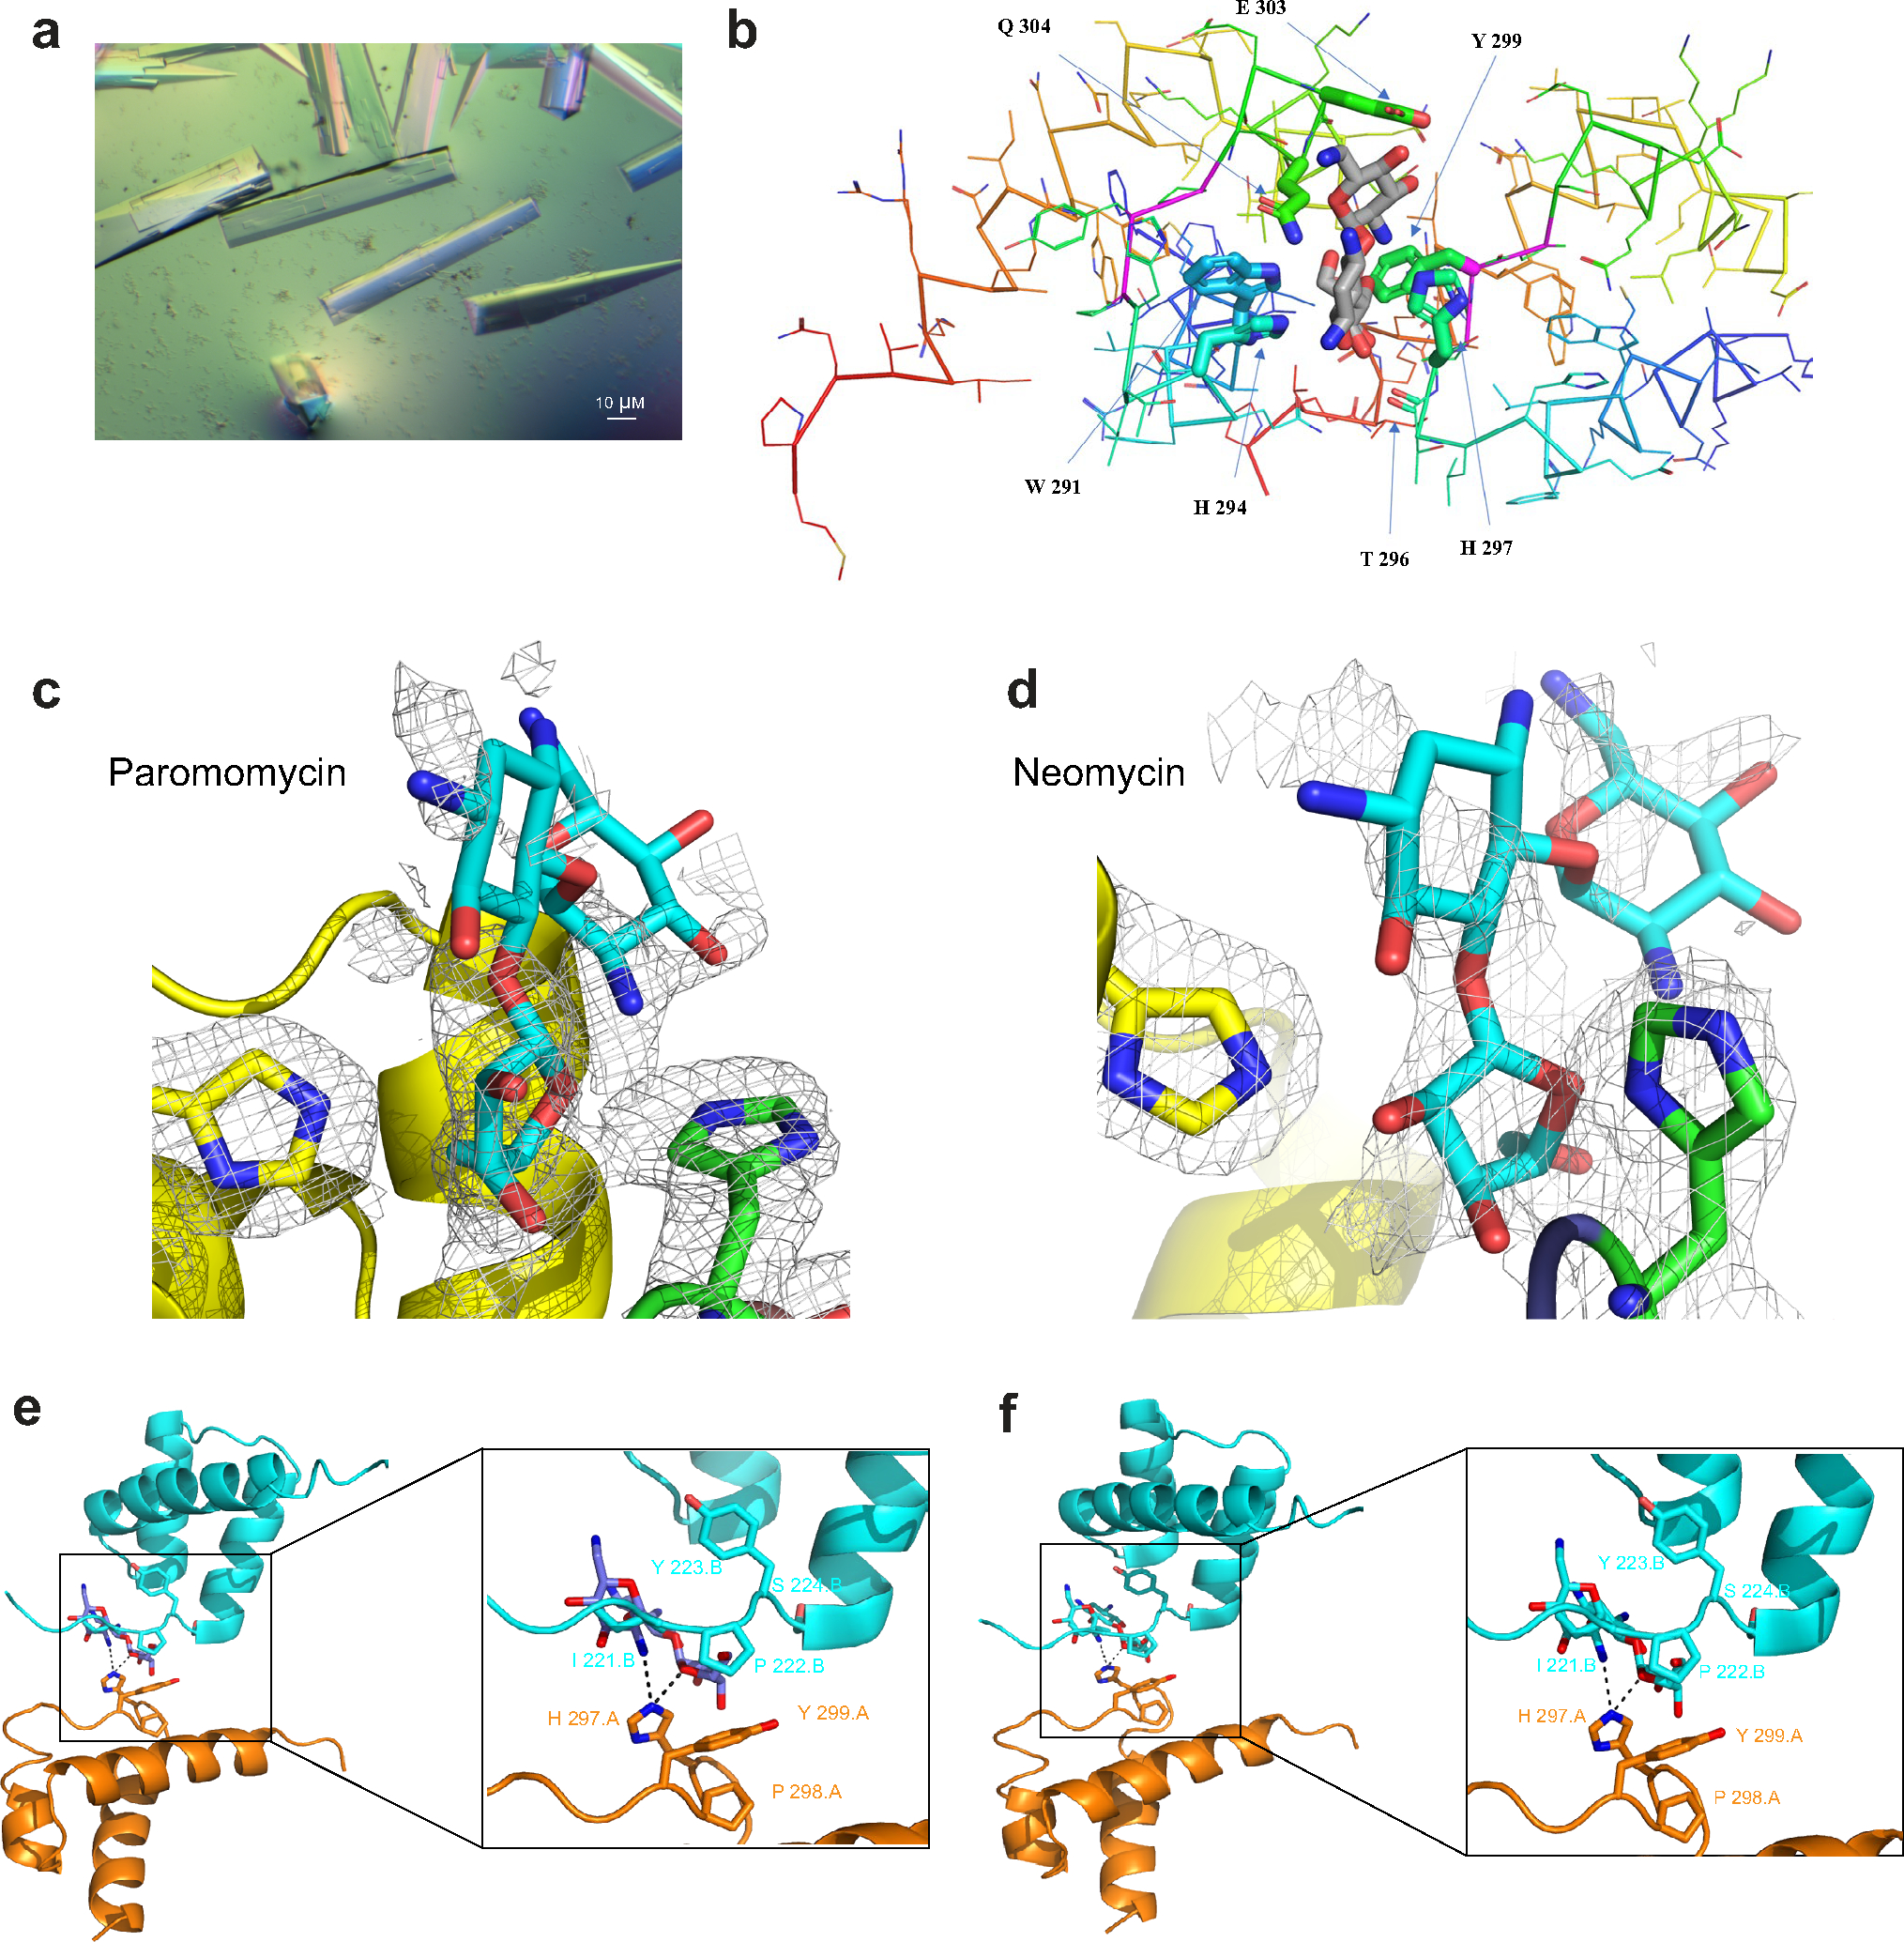
a,b, Left, representative image of EMSA showing Paro–Neo combination disrupts of Meis1-DNA or Hoxb13-DNA binding. Each drug (1 μM) was added to an incubation mixture containing the unlabeled DNA (0.5 μM) and Meis1 (0.5 μM) (a) or Hoxb13 (0.25 μM) (b). DNA–protein mixture was used as a normalized value. Right, quantification of EMSA. c,d, Close-up for ribostamycin along with Meis1 originated from Paro co-crystallization (c) and Neo co-crystallization (d), highlighting the contributing amino acids H297.A, P298.A and Y299.A. e, Structure of ribostamycin bound to Meis1 C-terminal domain at loop carries an insertion (‘PYP’, magenta) characteristic of the TALE homeodomain family; the second and third α-helix form the HTH motif; and the third α-helix is mainly responsible for DNA binding. f, Superimposition of the resolved crystal structures of Meis1 bound to Paro (magenta) and Neo (orange). The green helical structure corresponds to chain G of Meis1 co-crystallized with Neo, and the cyan helical structure corresponds to chains A–H of Meis1 co-crystallized with Paro. g, Superimposition of the resolved crystal structures of Meis1 bound to Paro (magenta), Meis1 bound to Neo (orange) and Meis1–Hoxb13 (PDB ID: 5EGO). The green helical structure corresponds to chain G of Meis1 co-crystallized with Neo; the cyan helical structure corresponds to chain A of Meis1 co-crystallized with Paro; the magenta helical structure corresponds to Meis1; and the blue helix corresponds to Hoxb13 (PDB ID: 5EGO). h, Mice received twice-daily injections of PBS (Ctrl), Paro (100 mg kg−1) and Paro–Neo (150 mg kg−1) starting from P14 until P28. i, Co-IP using Hoxb13 antibody from total heart extracts (n = 3) in h. j, Quantification of Meis1 densitometry; co-IP using IgG serves as a negative control. Gapdh serves as a loading control. Data in a and b were independently repeated at least three times with similar results. Data are presented as mean ± s.e.m. Statistical analyses: one-way ANOVA with Tukey’s post hoc test (a,b,j); *P < 0.05, **P < 0.01, ***P < 0.001 and ****P < 0.0001. Ctrl, control; NS, not significant.
X-ray crystallography shows Paro and Neo binding to Meis1
Next, we crystallized the DBD of Meis1 to determine the conformational apo-structure in the absence of DNA, as previously reported23. Meis1 crystals were grown in the presence of 10 mM Paro or Neo (Extended Data Fig. 3a). Meis1 crystals exhibited the symmetry of space group P3212, contained eight monomers (as four dimers) per asymmetric unit and diffracted to a minimum Bragg spacing (dmin) of 2.45 Å for Neo-bound crystals and 1.91 Å for Paro-bound crystals when exposed to synchrotron radiation. Intriguingly, an incomplete density for Paro was identified at two dimer contacts near H 297 in monomers A and C. This is in the proximity of the site S3, which represents the Meis1 and Hoxb13 interaction domain. In addition, an incomplete density for one Neo was also identified at a lattice contact near H 297 in monomer G. Due to the low level of density beyond the ribose moiety in these electron density maps, it was not clear if the bound ligands were the complete aminoglycosides or a degradation product. Modeled into the density was ribostamycin, which contains the D-ribose, D-neosamine and 2-deoxystreptamine moieties of Neo and Paro (Fig. 2c,d and Extended Data Fig. 3b–f).
The overall structure of the Meis1 C-terminal domain adopts the homeobox-type three helical bundle fold. The second and third α-helix form the helix-turn-helix (HTH) motif, and the third α-helix is mainly responsible for DNA binding. Meis1 homeobox domains form a multi-subunit oligomer. Paro or Neo showed binding to a crevice between the loops connecting the first and second α-helices of the two subunits of Meis1. This loop carries an insertion ‘PYP’, shown in magenta (Fig. 2e), characteristic of the TALE (three amino acid loop extension) homeodomain family that includes MEIS, PBX and PREP proteins. The ribose ring of the Paro or Neo is buried in this crevice and mainly interacts with the side chains of His298 and Trp294 of one Meis1 subunit on one side and the side chains of His301 and Tyr303 and the main chain carboxyl group of Thr300 of the other Meis1 subunit from the opposite side. In addition, the side chain of Glu307 forms hydrogen bond interactions with two hydroxyl groups in the first six-membered ring of Paro or Neo, and the side chain of Gln308 showed contacts with the whole skeleton of Paro or Neo (Extended Data Fig. 3b). The two subunits of Meis1 interacting with one molecule of Paro or Neo formed a non-symmetric dimer. The C-terminal (third) α-helix of one Meis1 subunit, which harbors critical DNA-binding residues, is involved in the interaction with the first and second α-helices of the other subunit in the dimer that bound to Paro or Neo. Overall, these results indicate that either Paro or Neo can bind at the interface of Meis1 homodimer, thereby placing one of the Meis1 monomers in a position incompatible with DNA binding. Therefore, the crystal structure suggests that Paro (or Neo) binding to Meis1 blocks DNA accessibility for one of the two Meis1 subunits involved in the homodimer formation, thereby inhibiting its transcriptional activity.
Paro-bound and Neo-bound crystals revealed their binding at the Meis1–Hoxb13 interface domain and specifically at three of the five amino acids that mediate that interaction, namely His301, Pro302 and Tyr303 (Extended Data Fig. 3e,f). Interestingly, the superimposition of the resolved crystal structures of Meis1 bound to Paro and Neo showed that their binding pattern is not identical (Fig. 2f,g), indicating their potential to fill in the entire hydrophobic pocket for Meis1 dimer. This suggests a possibility of an additional mechanism by which the two drugs can cooperatively inhibit the transcriptional activity of Meis1 and Hoxb13 by disrupting their interaction in a synergistic fashion. Therefore, we examined Meis1–Hoxb13 interaction in vivo by co-immunoprecipitation (co-IP) in mouse hearts after single Paro or combination Paro–Neo treatment (Fig. 2h). The results indicate that the binding of Meis1 to Hoxb13 is significantly reduced with the combined administration of Paro–Neo (Fig. 2i,j). Together, these results suggest that the combination treatment of Paro–Neo has a broader interference with Meis1–Hoxb13 transcriptional activity compared to single Paro or Neo.
Paro induces cardiomyocyte proliferation in adult mice
As outlined earlier, the in vitro screening suggested that Paro or Neo similarly promote cardiomyocyte proliferation by inhibiting Meis1–Hoxb13 transcriptional activity. Thus, we selected Paro to further study its capacity to promote cardiomyocyte proliferation in vivo in adult mice (Fig. 3a). Initially, the Paro dose was calculated based on the allometric approach that considers the body surface area determination between human and mouse24, taking into account the fact that the Paro dose can vary between 10 mg kg−1 and 35 mg kg−1 in humans depending on the clinical indication25. The human equivalent dose . Therefore, we examined the effect of Paro at 200 mg kg−1 d−1 by intraperitoneal (i.p.) injection. After 2 weeks of injection, we examined markers of cardiomyocyte proliferation, including cardiomyocyte mitosis and cytokinesis indices as well as cardiomyocyte size and number and nucleation. Overall, no significant difference was found in body weight (BW), heart weight (HW) and HW/BW ratio in the Paro-treated mice compared to controls (Extended Data Fig. 4a–c). However, Paro-treated mice showed a significant increase in the number of mitotic cardiomyocytes (pH3+/cTnT+) compared to controls (Fig. 3b and Extended Data Fig. 4d). Consistently, Paro-treated mice also displayed a significant increase in the number of cardiomyocytes undergoing cytokinesis (AurkB+/cTnT+) (Fig. 3c and Extended Data Fig. 4e). In addition, treatment of Paro significantly reduced the cross-sectional area (CSA) of cardiomyocytes as determined by wheat germ agglutinin (WGA) staining (Fig. 3d). After the dissociation of individual cardiomyocytes from the ventricles by collagenase digestion, Paro-treated hearts had a significantly higher number of total cardiomyocytes, concomitantly with a higher proportion of mononucleated cardiomyocytes, compared to vehicle-treated hearts (Fig. 3e,f). Furthermore, staining of isolated cardiomyocytes from dispersed hearts showed a significant increase in proliferative cardiomyocytes (pH3+) from Paro-treated hearts compared to vehicle-treated hearts (Extended Data Fig. 4f). Notably, we employed the genetic lineage-tracing system Mosaic Analysis for Double Markers (MADM) to further validate the completed cardiomyocyte division after Paro treatment, which is indicated by single-labeled green (GFP+) or red (RFP+) cardiomyocytes (Fig. 3g). We found that Paro treatment resulted in a significant increase in RFP+ and GFP+ single-labeled daughter cardiomyocytes compared to vehicle-treated mice (Fig. 3g). These results suggest that Paro treatment promotes cardiomyocyte proliferation in vivo in adult mice.
Fig. 3 |. Paro increases proliferation indices in adult mice.

a, Schematic for Paro administration to 10-week-old CD-1 male mice at 200 mg kg−1 i.p for 2 weeks. Hearts were collected for histological analysis. b, pH3 and cTnT co-immunostaining shows a significant increase in the cardiomyocyte mitosis (arrowhead) marker for Paro-treated mice compared to controls. Ctrl, n = 6; Paro-treated groups, n = 3. c, AurkB and cTnT co-immunostaining shows a significant increase in the cardiomyocyte cytokinesis (inset) marker for Paro-treated mice compared to controls. Ctrl, n = 4; Paro-treated groups, n = 3. d, WGA staining shows a shift to smaller CSA cardiomyocyte cell size in Paro-treated mice compared to controls. Ctrl, n = 4; Paro-treated groups, n = 3. e, Paro-treated mice show a significant increase in the cardiomyocyte cell count compared to controls. Ctrl, n = 8; Paro-treated groups, n = 8. f, Cnx43 (red) and nuclear staining (blue) co-immunostaining (left) shows a significant decrease in the binucleation and multinucleation and a significant increase in the mononucleation in Paro-treated mice compared to controls (right). Ctrl, n = 3; Paro-treated groups, n = 3. g, Representative immunofluorescence images (upper) and quantification of single-labeled (red or green, arrowheads) cardiomyocytes showing a significant increase in Paro-treated mice compared to controls after injection of tamoxifen (lower). Ctrl, n = 3; Paro-treated groups, n = 3. Data are presented as mean ± s.e.m.; Student’s unpaired two-sided t-test. *P < 0.05, **P < 0.01 and ***P < 0.001. Scale bars, 10 μm (b,c,f) and 50 μm (d,g). CM, cardiomyocyte; Ctrl, control; WT, wild-type.
Paro–Neo promotes cardiomyocyte proliferation
Next, we tested whether the combination of Paro and Neo can reduce the dose of each drug needed for induction of proliferation in vivo and, thus, decrease potential drug toxicity. We first examined the effect of the dual administration of the Paro–Neo combination on prolonging the window of neonatal cardiomyocyte proliferation. P1 pups were injected with Paro–Neo combination (300 mg kg−1 d−1, i.p., or 150 mg kg−1 d−1 of each drug) daily until P14 (Extended Data Fig. 5a). We noted an increase in cardiomyocyte mitosis (Extended Data Fig. 5b) and cytokinesis (Extended Data Fig. 5c) in the Paro–Neo-treated pups compared to controls. However, cardiomyocyte CSA was not significantly changed (Extended Data Fig. 5d).
We examined whether the above-mentioned administration of Paro–Neo combination in adult mice (10-week-old) could induce adult cardiomyocyte proliferation (Extended Data Fig. 6a). The treatment showed no obvious changes in BW, HW and HW/BW (Extended Data Fig. 6b–d); however, cardiomyocytes undergoing mitosis and cytokinesis were significantly increased in the Paro–Neo-treated hearts compared to controls (Fig. 4a,b and Extended Data Fig. 6e,f). In addition, we found that the Paro–Neo-treated hearts showed a significant reduction in cardiomyocyte CSA (Fig. 4c) and an increase in the total number of cardiomyocytes (Fig. 4d), concurrently with an increase in the proportion of mononucleated cardiomyocytes (Fig. 4e). Consistently, we also observed a significant increase in mitotic cardiomyocytes (pH3+/cTnT+) from dispersed Paro–Neo-treated hearts compared to vehicle-treated hearts (Extended Data Fig. 6g). We also found that Paro–Neo treatment resulted in a significant increase in single-labeled green or red cardiomyocytes in the lineage-tracing MADM mouse model (Fig. 4f) after the administration of both 4-hydroxytamoxifen pulse and Paro–Neo. Furthermore, we monitored S phase progression by assessing de novo DNA synthesis after Paro–Neo administration using thymidine analog 5-bromo-2′-deoxyuridine (BrdU) incorporation assay (Fig. 4g). We found that Paro–Neo-treated hearts showed an approximately eight-fold increase in the number of BrdU+ cardiomyocytes compared to vehicle-treated hearts (Fig. 4h,i).
Fig. 4 |. Administration of Paro–Neo combination increases proliferation indices in adult mice.

a, pH3 and cTnT co-immunostaining shows a significant increase in the cardiomyocyte mitosis (arrowhead) marker for Paro–Neo-treated 10-week-old CD-1 male mice compared to controls. Ctrl, n = 6; Paro–Neo-treated groups, n = 3. b, AurkB and cTnT co-immunostaining shows a significant increase in the cardiomyocyte cytokinesis (inset) marker for Paro–Neo-treated mice compared to controls. Ctrl, n = 4; Paro–Neo-treated groups, n = 3. c, WGA staining shows a significant shift to smaller CSA cardiomyocyte cell size in Paro–Neo-treated mice compared to controls. Ctrl, n = 4; Paro–Neo-treated groups, n = 3. d, Paro–Neo-treated mice show a significant increase in the cardiomyocyte cell count compared to controls. Ctrl, n = 8; Paro–Neo-treated groups, n = 7. e, Quantification for nucleation to show a significant increase in the mononucleation Paro–Neo-treated mice compared to controls. Ctrl, n = 3; Paro–Neo-treated groups, n = 3. f, Representative immunofluorescence images (left) and quantification of single-labeled (red or green, arrowheads) cardiomyocytes showing a significant increase in Paro–Neo-treated mice compared to controls, after injection of 4-hydroxytamoxifen (right). Ctrl, n = 3; Paro–Neo-treated groups, n = 3. g–j, S-phase labeling of cardiomyocytes using BrdU. Ctrl, n = 3; Paro–Neo-treated groups, n = 3. g, Schematic diagram of BrdU labeling. Ten-week-old CD-1 wild-type (WT) mice were injected with Paro–Neo combination (150 mg kg−1, twice daily, i.p.) and concurrent administration of BrdU in the drinking water for 14 d. h, Whole-section staining for Ctrl and Paro–Neo-treated hearts. BrdU (red), cardiac troponin T (cTnT, green), cardiomyocyte cell membrane (WGA, white) and nuclei (blue). i, Representative images of BrdU+ cardiomyocytes. Ctrl, n = 3; Paro–Neo-treated groups, n = 3. j, Quantification of BrdU+ cardiomyocyte nuclei. k–n, Paro–Neo co-administration induces cardiomyocytes undergoing G2/M transition. k, Ten-week-old CD1 male mice were injected intravenously with AAV9 dual reporter (mCherry–LoxP–EGFP) and either AAV9 control (empty vector) or AAV9–CyB–Cre (1.67 × 10¹³ vg/kg each). After 1 week, mice were injected with an equimolar ratio of Paro and Neo (150 mg kg−1 of each in PBS up to day 9 and 75 mg kg−1 of each from day 10 to day 14, i.p.) or control (PBS). Ctrl, n = 4; Paro–Neo-treated groups, n = 4. l, Whole-section staining for Ctrl and Paro–Neo-treated hearts. mCherry (red), EGFP (green) and nuclei (blue). m, Representative images of Ctrl and Paro–Neo-treated hearts of mice harboring AAV9–CyB–Cre. mCherry (red), EGFP (green), cardiomyocyte cell membrane (WGA, white) and nuclei (blue). n, Quantification of G2/M+ cardiomyocytes from Ctrl and Paro–Neo-treated cell CycleTrack reporter mice. Data are presented as mean ± s.e.m.; Student’s unpaired two-sided t-test. *P < 0.05, **P < 0.01 and ***P < 0.001. Scale bars, 10 μm (a,b), 20 μm (i), 50 μm (c,f,m) and 1 mm (h,l). CM, cardiomyocyte; Ctrl, control.
Finally, and to validate our findings independently, we collaborated with the Giacca laboratory, which developed the CycleTrack genetic labeling system. This system is based on a 312-bp fragment of the CyclinB2 (CyB) promoter that is active only at the G2/M transition of the cell cycle and drives Cre recombinase expression26. CycleTrack is based on two adeno-associated virus serotype 9 (AAV9) vectors, one containing the CyB-Cre cassette and the other the DNA template for Cre-mediated recombination. This template consists of a dual fluorescent reporter system, in which a constitutive promoter (CMV) drives the expression of either mCherry in basal conditions or GFP upon Cre-mediated, floxed mCherry excision. Detection of mCherry/GFP also allows the determination of transduction efficiency. Cardiomyocytes that are transduced by AAV vectors and do not enter mitosis are mCherry+; those that undergo at least one round of replication also become green. Of note, CycleTrack permits the cumulative detection of cardiomyocytes that have replicated over time. The CycleTrack dual vector system was administered in the Giacca laboratory by tail vein injection to adult mice. One week later, mice were treated with the Paro–Neo combination (Fig. 4k). During a 3-week-long monitoring of mitotic cardiomyocytes, we cumulatively detected 3.09 ± 0.86% of the transduced cardiomyocytes undergoing Cre-mediated GFP activation in vehicle-treated mice compared to 7.73 ± 1.38% in Paro–Neo-treated mice. Non-Cre-mediated recombination background, as assessed by a group of animals injected with an empty AAV9 vector together with the AAV9 dual reporter vector, was 0.71 ± 0.12% in the control group and 0.83 ± 0.12% in the Paro–Neo-treated mice (Fig. 4l–n).
Paro–Neo alters the expression of Meis1–Hoxb13 target genes
We performed Meis1 and Hoxb13 chromatin immunoprecipitation followed by sequencing (ChIP-seq) analysis (using nuclei extracted from P15 postnatal hearts after 7 d of Paro–Neo injection) to examine the TFs binding to their targets. The results supported the notion that the overall binding pattern of Meis1 to its targets was markedly altered in response to systemic Paro–Neo treatment where 1,149 targets of Meis1 were lost upon treatment with Paro–Neo. However, not all Meis1 targets were disrupted as a result of drug(s) treatment where a subset of Meis1 targets (618) was unaffected by the drug treatment (Fig. 5a). Similarly, Hoxb13 ChIP-seq showed significant changes in overall Hoxb13 binding to its targets in response to Paro–Neo treatment, where 442 targets of Hoxb13 were lost upon drug treatment, whereas a subset of targets (415) was unaffected (Fig. 5b). These results indicate that Paro–Neo interferes with the binding of Meis1 and/or Hoxb13 to their targets (Extended Data Fig. 7a). Enriched ontology clusters suggest that these altered genes are enriched in pathways relevant to cardiac growth, development and sarcomere organization, cell cycle activation and metabolism (Fig. 5c).
Fig. 5 |. Paro–Neo alters binding patterns of Meis1–Hoxb13 to their target genes in cardiomyocytes.

a–c, Genome-wide identification of Meis1 and Hoxb13 loci using ChIP-seq for Ctrl and Paro–Neo-treated groups. Venn diagrams show the targets from Meis1 ChIP-seq (a) and Hoxb13 ChIP-seq (b) of vehicle-treated and Paro–Neo-treated hearts. c, GO terms of the genes after Paro–Neo treatment demonstrating loss of Meis1 and HoxB13 in loci enriched pathways related to cell cycle, cardiac development and growth and metabolism. d, pH3 and cTnT co-immunostaining shows no statistically significant difference between DiKO and control (F/F) mice treated with Paro–Neo in the cardiomyocyte mitosis (arrowhead) marker. Ctrl (F/F), n = 3; DiKO groups, n = 3. b, AurkB and anti-cTnT co-immunostaining shows no statistically significant difference between DiKO and control (F/F) mice treated with Paro–Neo in the cardiomyocyte cytokinesis (arrowhead) marker. Ctrl (F/F), n = 3; DiKO groups, n = 3. Data are presented as mean ± s.e.m.; Student’s unpaired two-sided t-test (d,e). *P < 0.05, **P < 0.01 and ***P < 0.001. Scale bars, 10 μm (d,e). Ctrl, control; NS, not significant.
Next, we compared RNA sequencing (RNA-seq) data from Meis1 and Hoxb13 double knockout mice with mice treated with Paro and Neo to identify transcriptional changes induced by suppression of Meis1 and Hoxb13 and those that may result from non-specific effects of Paro and Neo. We conducted bulk RNA-seq of Meis1–Hoxb13-MCM (DiKO) and Paro–Neo-treated hearts. We found that more than 1,000 dysregulated genes were shared between the DiKO hearts and those that received Paro–Neo (Extended Data Fig. 7b), suggesting significant overlap of transcriptional signature. Notably, in both the DiKO and the Paro–Neo-treated hearts, we found non-specific transcriptional changes related to immune pathways, possibly owing to the fact that whole hearts were used for the RNA-seq. However, there was a similar Gene Ontology (GO) in both groups related to cell cycle, sarcomere assembly as well as metabolic pathways (Extended Data Fig. 7c,d). To gain further insight into the effect of DiKO and Paro–Neo treatment on Meis1 and Hoxb13 targets, we analyzed the RNA-seq based on ChIP-confirmed Meis1 and Hoxb13 targets. The results demonstrated that both interventions (genetic deletion and drug treatment) resulted in a similar pattern of gene expression in pathways related to cell cycle, sarcomere assembly as well muscle cell growth and differentiation (Extended Data Fig. 7b–d). These results support the notion that Paro–Neo treatment induces differential gene expression that is in line with the genetic loss of Meis1 and Hoxb13 in cardiomyocytes.
To further validate the effect of drug treatment on known Meis1 targets at the protein level, we performed a western blot for p15/16 and p21 from hearts that underwent 14 d of drug(s) administration (Extended Data Fig. 8a). The results showed that p21 expression was significantly decreased in the Paro–Neo-treated group. Although p15 showed a trend toward decreased levels, it did not reach statistical significance (Extended Data Fig. 8b–d). On the other hand, to explore whether drug(s) treatment would alter the expression of Meis1 and/or Hoxb13, we examined the expression of Meis1 and Hoxb13 at both mRNA and protein levels. The results showed that drug(s) treatment did not alter Meis1 and Hoxb13 mRNA (Extended Data Fig. 8e,f) or protein expression (Extended Data Fig. 8g–i). Together, these results support the notion that Paro and Neo collectively hinders the binding of Meis1 and/or Hoxb13 to their target genes and subsequently induces adult cardiomyocyte proliferation.
Paro–Neo does not raise cardiomyocyte proliferation in DiKO
To ensure that the effect of Paro–Neo treatment is mediated by inhibition of Meis1 and Hoxb13 transcriptional activity, we induced cardiomyocyte-specific deletion of Meis1 and Hoxb13 as we previously described18. One week after deletion, mice were treated with Paro–Neo for 14 d. Hearts were harvested, sectioned, stained and assessed for markers of cardiomyocyte mitosis and cytokinesis. We did not observe a substantial difference between DiKO and control (F/F) mice after Paro–Neo treatment (Fig. 5d,e). These results indicate that the effect of Paro–Neo on the cardiomyocyte cell cycle is mediated by the inhibition of Meis1 and Hoxb13.
Paro–Neo stimulates hematopoietic stem cell proliferation
Several studies reported the role of Meis1 in the regulation of the hematopoietic stem cell (HSC) cell cycle27. The hallmark of Meis1 deletion in HSCs is loss of quiescence manifested by induction of HSC proliferation and increased HSC number27. Given that the effects of systemic administration of Paro–Neo is unlikely to be limited to the cardiomyocytes and is likely to impact Meis1 targets elsewhere, we conducted studies to examine the effect of Paro–Neo administration on HSC quiescence in adult mice. In support of the inhibitory role of Paro and Neo on Meis1 transcriptional activity, we observed a small but significant increase in HSC number after systemic administration of Paro–Neo (Extended Data Fig. 8j–l).
Paro–Neo enhances heart regeneration after injury in mice
The ability of the two aminoglycosides to induce cardiomyocyte proliferation in adult mice prompted us to test their role in adult myocardial regeneration. Here, we used two models: a mild ischemia/reperfusion (I/R) model where an ischemia was induced for 45 min, followed by a reperfusion, and a permanent coronary ligation model to induce a large MI. In the I/R model, the left ventricular ejection fraction (LVEF) declined 10–15% by 10 d after I/R. At this timepoint, mice were treated with control (PBS), Paro alone or Paro–Neo combination twice a day for 40 d thereafter (Fig. 6a). Serial echocardiography results indicated that, in contrast to vehicle-treated mice, Paro–Neo-treated mice displayed a gradual increase in LVEF, reaching pre-injury values (Fig. 6a,b), with the Paro–Neo-treated mice showing a higher LVEF at all timepoints. In addition, less interstitial myocardial fibrosis was observed in Paro–Neo-treated I/R hearts compared to controls (Fig. 6c). Furthermore, pH3+ and AurkB+ cardiomyocytes in the border zone (BZ) and the remote zone (RZ) were increased in I/R hearts after Paro–Neo treatment (Fig. 6d–i). A significant difference was noted in the HW/BW among the control and treated groups, while no significant change was observed in wet-to-dry lung weight (Fig. 6j,k).
Fig. 6 |. Paro–Neo improves LVEF after I/R.

a, Serial echocardiography measurements of Ctrl, Paro and Paro–Neo-treated I/R mice. Drug(s) treatment started 10 d after I/R. b, Representative images of echocardiography at 10 d, 30 d and 50 d after I/R. c, Quantification (left) and representative images (right) of myocardial interstitial fibrosis (red, insets) in Ctrl, Paro and Paro–Neo-treated I/R mice. Heart sections were stained with picrosirius red at 50 d after I/R. d, Representative image of pH3+ cardiomyocyte (arrowheads) and quantification at BZ (e) and RZ (f). g, Representative image of AurkB+ cardiomyocyte (arrowhead) and quantification at BZ (h) and RZ (i). j, Ratio of heart weight/body weight suggests that both treatments reduced MI-induced cardiac hypertrophy. k, Ratio of wet lung weight/dried lung weight showed no difference among groups. Ctrl, n = 6; Paro, n = 7, Paro–Neo-treated groups, n = 7. Data are presented as mean ± s.e.m. Statistical analyses: two-way ANOVA with Dunnett’s post hoc test (a); one-way ANOVA with Tukey’s post hoc test (c,e,f,h,i,j,k); *P < 0.05, **P < 0.01, ***P < 0.001 and ****P < 0.0001. Scale bar, 10 μm (d,g) and 1 mm (c). NS, not significant.
To test if Paro–Neo administration also promotes heart regeneration after a large myocardial infarction, we induced MI in adult mice by permanent ligation of the left anterior descending (LAD) coronary artery, and, 1 week later, we started treatment with either Paro or Paro–Neo combination and monitored left ventricular systolic function by echocardiography for 8 weeks thereafter (Extended Data Fig. 9a). At the time of drug administration, control, Paro and Paro–Neo-treated groups showed a similar reduction in LVEF 1 week after MI (Extended Data Fig. 9b). The LVEF values of the aminoglycoside-treated groups versus the vehicle group diverged at 2 weeks after treatment where the drug-treated groups showed a significantly higher LVEF. At 8 weeks, the LVEF of the Paro–Neo group had improved compared to the Paro-only and vehicle-treated groups. Notably, the LVEF of the Paro–Neo group also significantly improved compared to the1-week post-MI timepoint (Extended Data Fig. 9b). Consistently, echocardiography displayed a noticeable wall motion improvement in the Paro–Neo-treated group (Extended Data Fig. 9c–k). It is important to note here that, although the Paro-only group showed an improvement in LVEF compared to the vehicle-treated group, it did not significantly improve compared to the 1-week post-injury timepoint, suggesting a partial regenerative effect. In addition, Masson’s trichrome staining revealed a trend toward shorter scar length in the Paro-treated group, although this change was not significant, whereas the Paro–Neo group showed a significantly decreased scar length (Extended Data Fig. 9l,m). No significant change was observed in absolute BW, HW and HW/BW (Extended Data Fig. 9n–p). Paro–Neo treatment also prevented pulmonary edema, as determined by a lower wet-to-dry lung weight ratio in treated groups (Extended Data Fig. 9q). Collectively, these results suggest that systemic administration of the Paro–Neo combination induces adult cardiomyocyte proliferation and heart regeneration in mice.
Paro–Neo enhances heart regeneration after injury in pigs
We next examined the role of Paro and Neo in inducing cardiomyocyte proliferation and heart regeneration in large mammals. I/R was induced surgically in P45 pigs by LAD coronary artery ligation for 60 min, followed by reperfusion. One week after injury, a Paro–Neo cocktail (7.5 mg of each drug per kilogram per day, by intravenous (i.v.) injection) or PBS was administered for 5 weeks (Fig. 7a). This dose is the calculated HED based on the allometric approach and previous pharmacokinetics profile for neomycin via i.v. route28. After I/R, myocardial damage occurred in both groups as evidenced by a decrease in left ventricular fractional shortening (LVFS) (Fig. 7b). Strikingly, Paro–Neo cocktail treatment significantly enhanced LVFS compared to PBS-treated pigs. Although no significant difference was observed in HW/BW, absolute HW and BW (Fig. 7c–e), the Paro–Neo treatment group showed a significantly smaller scar size (Fig. 7f). Furthermore, histological assessment demonstrated a significant increase in cardiomyocyte cell cycle progression as determined by Ki67, pH3 and Aurora B staining in the Paro–Neo-treated group compared to vehicle controls (Fig. 7g–i). These results indicate that systemic administration of Paro and Neo induces cardiomyocyte proliferation and myocardial regeneration in pigs.
Fig. 7 |. Paro–Neo prevents cardiac remodeling in I/R pig model.
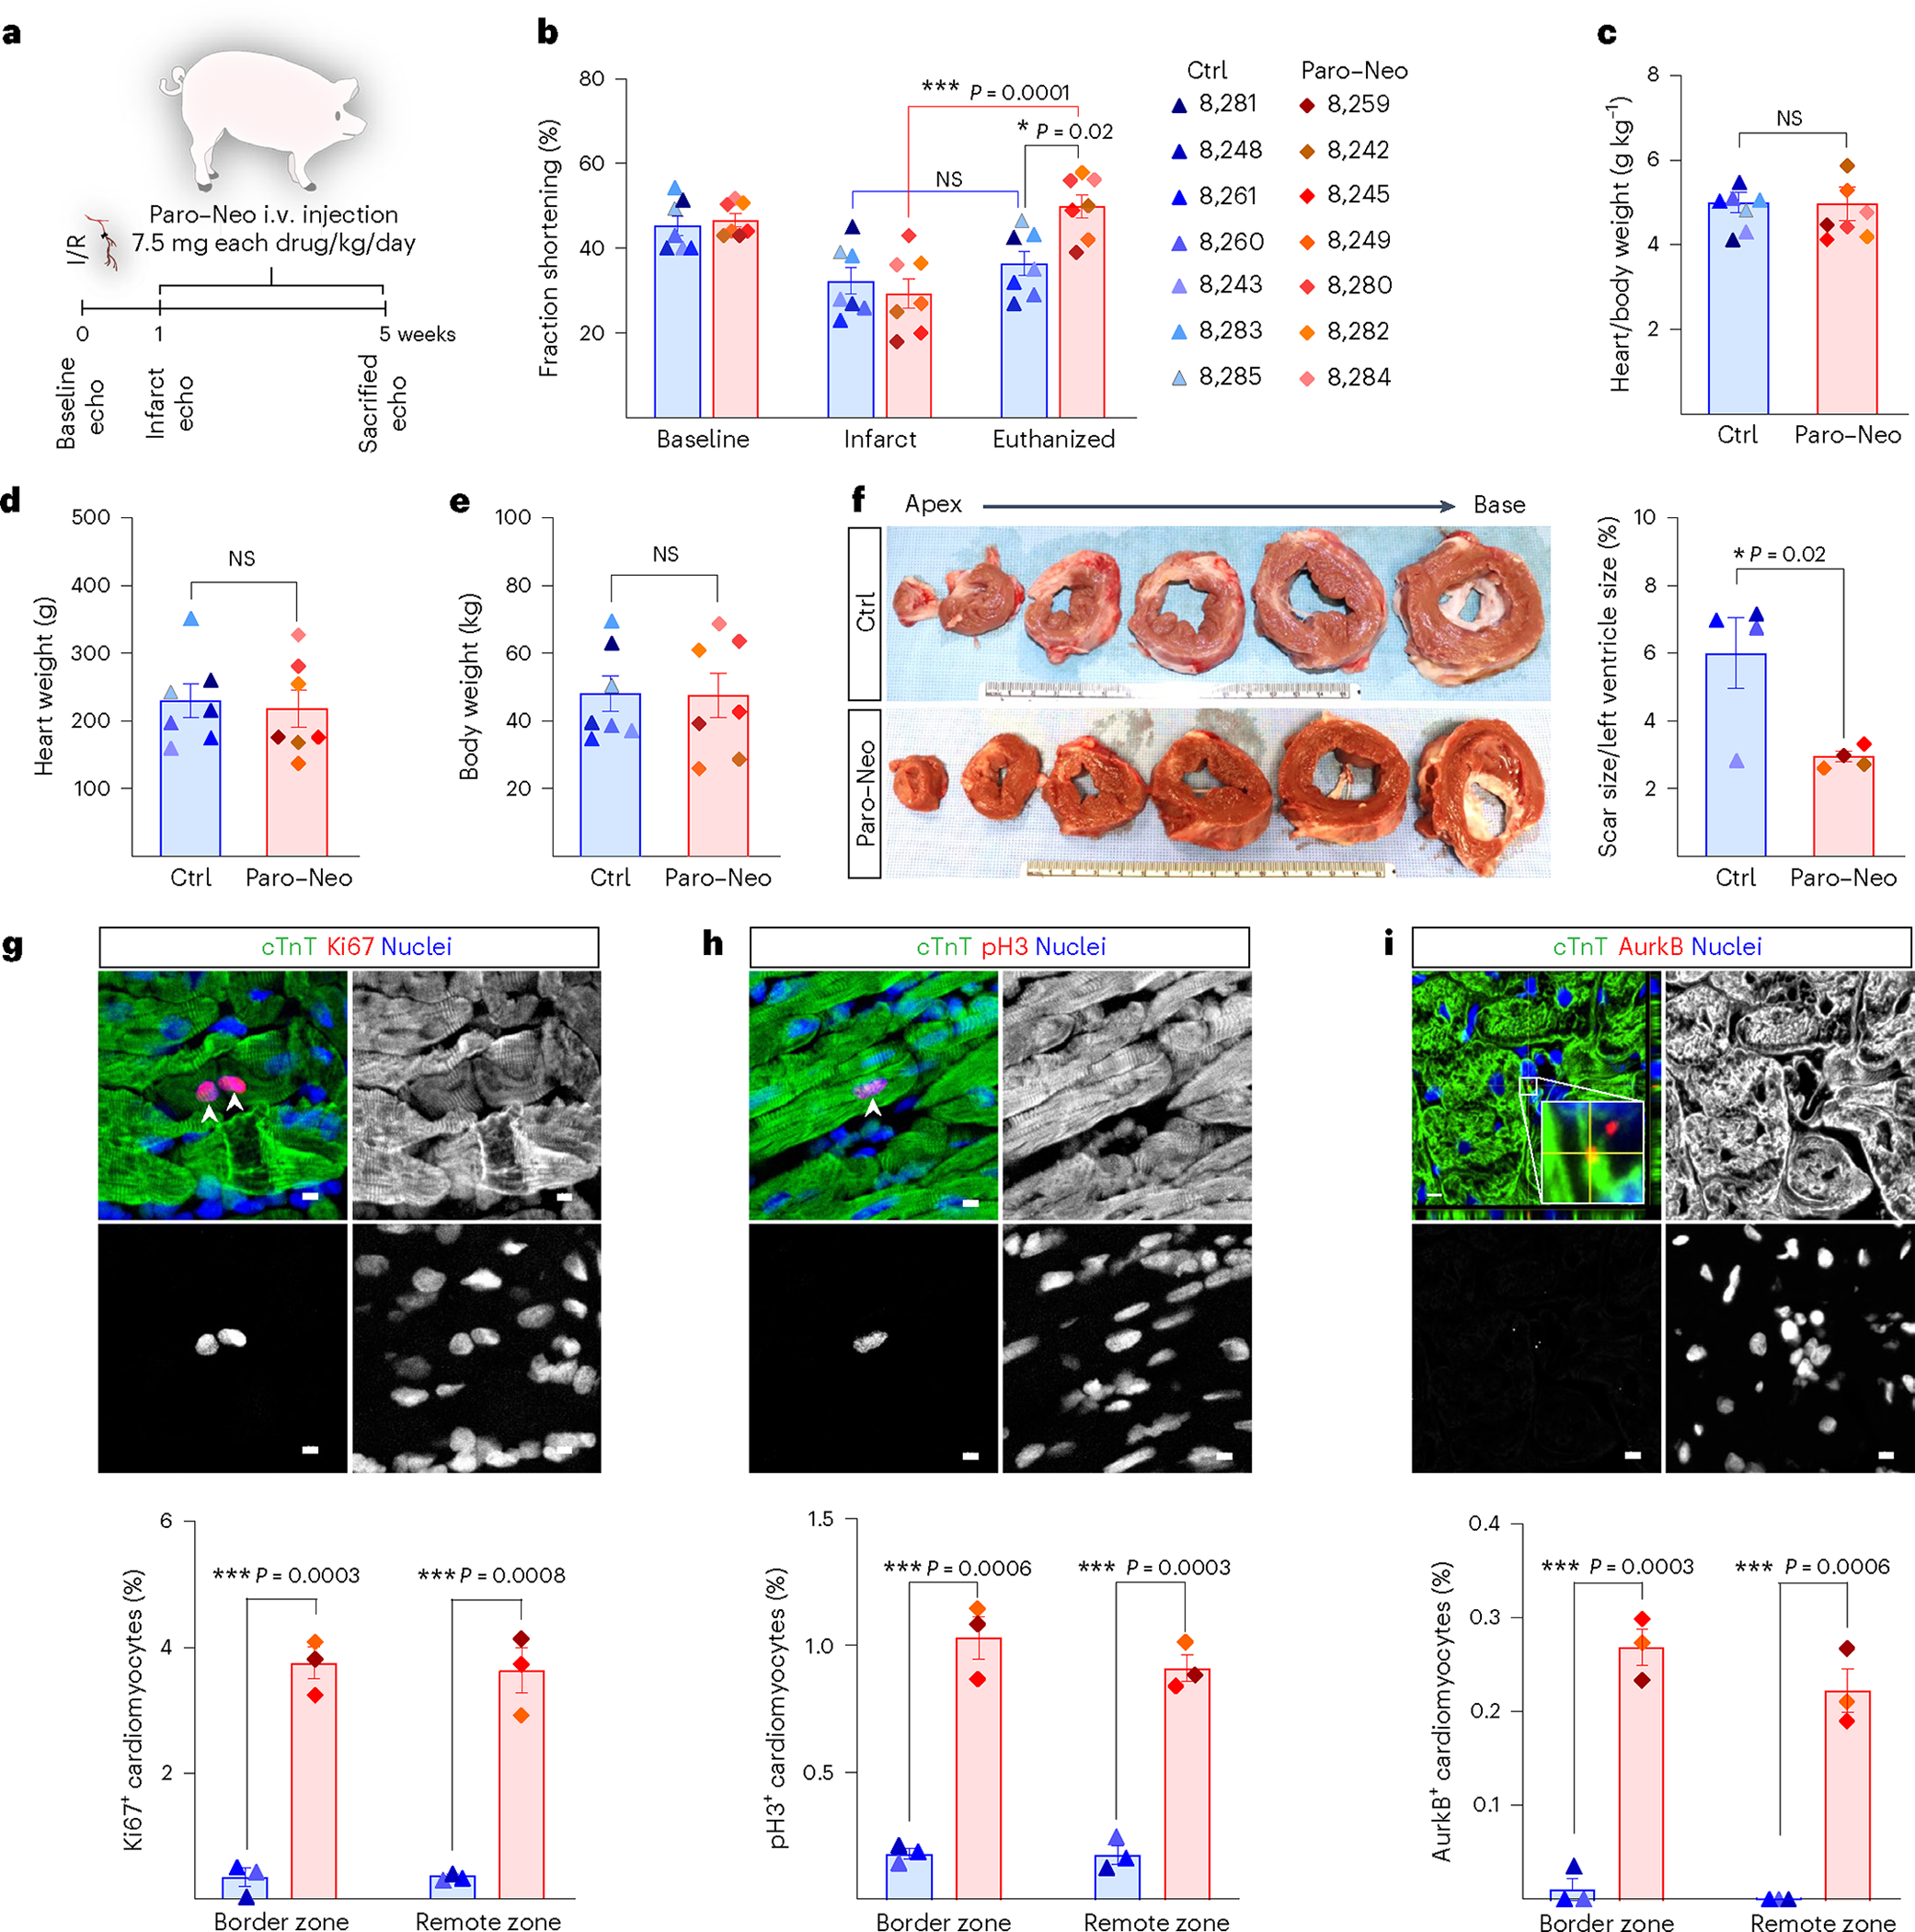
a, One week after I/R induced by LAD coronary artery ligation, 45-day-old Yorkshire pigs were infused with PBS (control) and Paro–Neo combination (15 mg kg−1 d−1, i.v.) for 5 weeks. The cardiac function was assessed by echocardiography. Hearts were collected after 5 weeks post-I/R for histological analysis. b, Serial echocardiography assessment showed higher FS (FS%) after MI in Paro–Neo-treated pigs compared to control-treated pigs. Ctrl, n = 7; Paro/Neo-treated groups, n = 7. c–e, No change was detected in the heart weight/body weight ratio (c), heart weight (d) and body weight (e) and between Paro–Neo-treated and control-treated pigs. Ctrl, n = 7; Paro–Neo-treated groups, n = 7. f, Representative transverse rings of hearts 5 weeks after MI show a significant decrease in scar size of Paro–Neo-treated hearts compared to vehicle-treated hearts. Ctrl, n = 4; Paro–Neo-treated groups, n = 4. Ki67 (g) or pH3 and cTnT co-immunostaining (h) shows a significant increase in the cardiomyocyte mitosis marker for Paro–Neo-treated pigs compared to vehicle-treated pigs. i, AurkB and cTnT co-immunostaining shows a significant increase in the cardiomyocyte cytokinesis marker for Paro–Neo-treated pigs compared to vehicle-treated pigs. Ctrl, n = 3; Paro–Neo-treated groups, n = 3. Data are presented as mean ± s.e.m. Statistical analyses: two-way ANOVA with Tukey’s post hoc test (b); Student’s unpaired two-sided t-test (c–i); *P < 0.05, **P < 0.01, ***P < 0.001 and ****P < 0.0001. Scale bar, 5 μm (g–i). echo, echocardiography; NS, not significant.
Discussion
The present study builds on our previous work, which identified Hoxb13 as a Meis1 co-factor in postnatal cardiomyocytes, where concomitant genetic deletion of Meis1 and Hoxb13 resulted in cardiomyocyte proliferation, sarcomere disassembly and improved left ventricular systolic function after MI. These findings support the notion that Meis1 and Hoxb13 may be viable therapeutic targets for stimulation of heart regeneration. Specifically, pharmacological inhibition of the Meis1 and Hoxb13 transcriptional activity can induce cardiomyocyte cell cycle entry and myocardial regeneration after injury.
We sought to identify druggable sites in Meis1 and Hoxb13, and we applied structure-based drug repurposing to identify the nature of scaffolds that can disrupt either the Meis1–Hoxb13 interaction or their DNA binding by docking the FDA-approved drug library to three different sites representing Meis1–Hoxb13 interaction or the DBDs of Meis1 or Hoxb13. Interestingly, the top candidates that showed proper binding modes with favorable energy profiles all possess glycosides moiety in their structural scaffolds, such as rutin, hesperidin and aminoglycosides family members.
Our two top drug candidates, based on induction of NRVM mitosis in vitro and inhibition of Meis1 and Hoxb13 transcriptional activity, were Neo and Paro. EMSA demonstrated that the two-drug combination can disrupt the DNA binding of both TFs. X-ray crystallography confirmed the binding of both drugs to Meis1 at the Hoxb13 interaction domain. In fact, the crystal structure indicates that both drugs bind directly to three out of the five amino acids required for Meis1–Hoxb13 interaction, thereby interfering with their interaction. The crystal structure also demonstrated that both drugs bind at the interface of Meis1 homodimer, therefore placing one of the Meis1 monomers in a position incompatible with DNA binding. However, one limitation of the current study is that we have not been able to obtain a crystal structure of Hoxb13 with either Paro or Neo.
From a mechanistic standpoint, ChIP-seq analysis after systemic administration of the Paro–Neo combination demonstrated that the drugs disrupt the binding of Meis1 and Hoxb13 to their target genes, where ontology analysis of disrupted loci suggested enrichment in cardiac growth and development, cell cycle activation and sarcomere organization pathways. Unbiased bulk RNA-seq showed that both Meis1 and Hoxb13 DiKO and Paro–Neo treatment share a transcriptional signature characterized by upregulation of pathways related to cell cycle activation and sarcomere assembly as well downregulation of oxidative metabolism and fatty acid pathways. We also found that immune-related pathways were upregulated in both the DiKO and the drug-treated groups, possibly owing to the fact that whole hearts were used in the RNA-seq, although it is possible that this immune signature played a role in the observed phenotypes. Notably, when we further analyzed the RNA-seq based on ChIP-confirmed Meis1 and Hoxb13 targets, we found that both the DiKO and the drug-treated groups displayed similar patterns of gene expression in pathways related to cell cycle and sarcomere assembly as well as muscle cell growth and differentiation.
Based on these findings, we evaluated the potential of either Paro alone or the combination of Paro–Neo to induce cardiomyocyte proliferation in vivo in mice. We investigated this combination strategy given that both drugs bind to the same domain of Meis1 (as determined by X-ray crystallography) to allow for the administration of submaximal doses of each drug, thereby avoiding potential toxicity. We provide multiple levels of evidence to support the role of Paro–Neo combination in the induction of cardiomyocyte proliferation and heart regeneration, including expression of the mitosis marker pH3 in cardiomyocyte nuclei, expression of the cytokinesis marker aurora B kinase, increase in cardiomyocyte number after collagenase digestion, increase in mononucleated and decrease in binucleated cardiomyocytes, increased BrdU incorporation in cardiomyocytes, increase in G2/M cardiomyocytes using the fate mapping model CycleTrack (independently performed by the Giacca laboratory) and increase in single-labeled red or green cardiomyocytes using the cytokinesis lineage-tracing MADM mouse model. Although both Paro and Paro–Neo combination induced cardiomyocyte mitosis, the combination of the two drugs displayed the highest degree of LVEF improvement in two models of MI in mice. Finally, given the promise of these FDA-approved drugs for use in humans, we investigated their role in myocardial regeneration in large mammals, a step that brings them closer to the clinic. In a series of studies in pigs, we demonstrate that systemic intravenous administration of the Paro–Neo combination once per day starting 1 week after I/R injury resulted in a significant improvement of LVFS compared to 1-week post-injury values and compared to vehicle-treated pigs. In addition, Paro–Neo combination increased cardiomyocyte mitosis markers and decreased scar size after injury.
Aminoglycosides are broad-spectrum bactericidal antibiotics that are generally thought to act through several mechanisms, including inhibiting protein synthesis in bacteria and affecting bacterial membrane potential, among others29. The effect of aminoglycosides on protein synthesis is not limited to bacteria, as numerous reports have demonstrated that Neo, Paro and gentamicin can bind mammalian ribosomes and inhibit protein translation, which is thought to be a central mechanism of aminoglycoside toxicity30. Although our results using the Meis1–Hoxb13 knockout mice in conjunction with Paro–Neo treatment demonstrate that the effect of Paro–Neo on the cardiomyocyte cell cycle is mediated by Meis1 and Hoxb13, it is possible that these antibiotics may exert other beneficial effects, such as cardio-protection and inhibition of remodeling, both of which have been shown to be induced by inhibition of protein translation31.
Our study spans several disciplines, from X-ray crystallography to small and large animal studies, to identify FDA-approved drugs that induce heart regeneration in adult mammals. Collectively, we demonstrate that Paro and Neo inhibit Meis1 and Hoxb13 transcriptional activity and that their combination induces cardiomyocyte proliferation and promotes myocardial regeneration in mice and pigs (Extended Data Fig. 10). These results demonstrate that targeting cardiomyocyte proliferation using drugs with established safety profiles can accelerate the delivery of pro-regenerative therapeutics to the clinic.
Methods
Animals
Mouse experiments were conducted in accordance with protocols approved by the Institutional Animal Care and Use Committee (IACUC) of The University of Texas Southwestern Medical Center (UTSW) and complied with the relevant ethical regulations regarding animal research.
Cardiomyocytes were isolated from the left ventricle of 1–2-dayold Sprague-Dawley rats following protocols approved by the IACUC of UTSW.
Animal experiments for CycleTrack were performed in accordance with the Animals (Scientific Procedures) Act 1986 and Amendment Regulations 2012, Guidance of Operations of the Animals (Scientific Procedures) Act 1986, and carried out under licenses from the United Kingdom of Great Britain and Northern Ireland Home Office. Animals were housed in accordance with the Code of Practice for the Housing and Care of Animals Bred, Supplied or Used for Scientific Purposes. The age of the mouse is indicated in the text and in the figures. Littermate controls were used whenever possible. CD1 male mice (Charles River Laboratories) and genetically modified strains (DiKO and MADM-MCM) were used, with no predetermined sample size. The DiKO (αMHCmERcremER/Meis1fl/fl/Hoxb13fl/fl) cardiac-specific inducible deletion of Meis1 and Hoxb13 and MADM-MCM were described previously18.
Pig experiments were conducted in accordance with protocols approved by the IACUC at the University of Alabama at Birmingham and performed under the National Institutes of Health (NIH) Guide for the Care and Use of Laboratory Animals (NIH publication no. 85–23).
Surgeries and echocardiography were carried out blinded to the treatment of the animals during the experiments and outcome assessments. Mice were euthanized at the same time of day to limit circadian variability.
Animal models of MI and I/R
Mouse model.
Ten-week-old CD-1 male mice (Charles River Laboratories) underwent anterior wall MI through LAD coronary artery ligation as previously described18. For I/R, the ligatures were removed after 45 min. Proper occlusion of the LAD coronary artery was noted by three criteria: immediate blanching of the LV anterior wall myocardium below the ligature; echocardiographic assessment showing an ejection fraction in the range of 45–65% at 7 d after surgery for MI or 70–85% at 10 d after surgery for I/R; and histological analysis. Drugs were administered 7 d after MI or 10 d after I/R. Mice were subjected to echocardiography at various times and euthanized 2–3 months after injury for heart histological analysis.
Pig model.
I/R was induced in Yorkshire swine (both sexes, 45 d old: ~18 kg) for 60 min before reperfusion, as previously reported32. During 30 min after reperfusion, if ventricular fibrillation occurs, electrical defibrillation can be used to restore normal electrophysiological (EP) activity. One week after I/R, an i.v. line was installed and started to infuse Par–Neo combination (15 mg kg−1 d−1) for 5 weeks.
Transthoracic echocardiography
Echocardiography in conscious mice was performed using a Vevo 2100 micro-ultrasound system and an MS400C probe (VisualSonics). The parasternal short-axis view was used to obtain echocardiographic M-mode images. Six contraction cycles were analyzed for average cardiac indices (left ventricular internal dimension during diastole and systole (LVIDd and LVIDs) and ejection fraction).
Pig cardiac function before and after surgery was assessed via transthoracic echocardiography, with sedated animals undergoing left-parasternal 2D and M-mode imaging. Fractional shortening (FS) was measured from short-axis M-mode images at the level of the papillary muscles and parasternal long-axis B-mode images and calculated as the difference in LVIDd and LVIDs, respectively, divided by the LVIDd and expressed as a percentage (FS (%) = (LVIDd − LVIDs) / LVIDd × 100%).
FDA-approved small-molecule preparation
The FDA-approved drug database was downloaded (https://go.drugbank.com/), and three-dimensional (3D) structures were energy minimized using MMFF94 force field33.
Structure-based in silico screening and scoring
The whole library underwent docking simulations using Molecular Operating Environment (MOE) software along with S1, S2 and S3 (PDB ID: 5EGO), as previously described34,35. 3D visualization was generated using UCSF Chimera36 and PyMOL Molecular Graphics System (Schrödinger).
NRVM isolation
Cardiomyocytes were isolated from the left ventricle of 1–2-day-old Sprague-Dawley rats following the protocol from an isolation kit (Cellutron Life Technologies, nc-6031). Myocytes were plated on coverslips coated with laminin (Life Technologies, 23017–015) at a density of 1,250 cells per millimeter in DMEM: M199 (3:1) containing 10% horse serum, 5% FBS and 1% penicillin–streptomycin. Then, 100 μmol L−1 BrdU was included to inhibit the growth of fibroblasts. All the drugs were tested at a single concentration level of 10 μM, followed by fixation and staining with antibodies against phospho-histone H3 (pH3) (EMD Millipore), as previously described37.
Drug dose(s) and administration
Paro and Paro–Neo combination doses were calculated based on allometric scaling among species25. Our therapeutic regimen was designed to mimic the administered human dose ranges for Paro and Neo.
Therefore, HED for Paro in mice (200 mg kg−1 × 0.081) was approximately 16.20 mg kg−1; for Paro/Neo combination in mice (300 mg kg−1 × 0.081) approximately 24 mg kg−1; and for Paro–Neo combination in pigs (15 mg kg−1 × 0.9) approximately 13.5 mg kg−1.
Tamoxifen and 4-hydroxytamoxifen (Sigma-Aldrich) were prepared by dissolving in sesame oil (Sigma-Aldrich) to a concentration of 10 mg ml−1. Paro and Neo were dissolved in PBS (Sigma-Aldrich) to the designated concentration. In all of the following experiments, mice were administered twice daily with Paro (100 mg kg−1), the equimolar ratio of Paro–Neo combination (150 mg kg−1) or 1× PBS, i.p.
For the MADM clonal analysis, 14 consecutive injections of 4-hydroxytamoxifen were administered with concurrent administration of PBS, Paro and Paro–Neo combination. For the BrdU experiments, to monitor the proliferation of endogenous cardiomyocytes, mice were administered daily with 0.25 mg ml−1 BrdU (Sigma-Aldrich) in the drinking water for up to 2 weeks with concurrent administration of PBS and Paro–Neo combination. The BrdU mixture was freshly prepared daily and kept in amber drinking bottles. Mice were euthanized at the same time of day to limit circadian variability.
For the CycleTrack experiment, 10-week-old CD-1 male mice (Charles River Laboratories) were injected intravenously with AAV9 dual reporter (mCherry–LoxP–EGFP) and either AAV9 control (empty vector) or AAV9–CyB–Cre (1.67 × 10¹³ vector genomes per kilogram (vg/kg) each). Starting 1 week later, mice were administered daily with an equimolar ratio of Paro and Neo (150 mg kg−1 of each in PBS up to day 9 and 75 mg kg−1 of each from day 10 to day 14) or PBS.
Production and purification of recombinant AAV vectors
Recombinant AAV vectors were prepared by the AAV Vector Unit at the ICGEB Trieste (https://www.icgeb.org/avu-core-facility/) according to well-established procedures38. In brief, AAV vectors of serotype 9 were generated in HEK293T cells, using a triple-plasmid transfection for packaging. Viral stocks were obtained by PEG precipitation and two consequent CsCl2 gradient centrifugations. Titration of AAV viral particles was performed by real-time polymerase chain reaction (PCR) quantification of the number of viral genomes, measured as CMV/Cre DNA copy number.
Histology
Mouse hearts were collected, fixed in 4% paraformaldehyde in PBS overnight at 4 °C and processed for either paraffin or cryo-embedding. Picrosirius red and Masson’s trichrome staining were performed according to standard procedures at the UTSW core histology facility on paraffin sections.
Pig hearts were collected and cut into transverse rings (ring 1 (base) to 6 (apex)) (thickness: ~1 cm), and myocardium from the BZ, the regions of interest and the RZ were processed with 30% sucrose overnight. The samples were cut into 10-μm sections and stored at −80 °C.
Immunofluorescence staining and quantification
For mouse.
Immunostaining was performed according to previous descriptions18. Primary antibodies used included pH3 (Sigma-Aldrich, 06–570, 1:100), AurkB (Sigma-Aldrich, A5102, 1:25), cTnT (Thermo Fisher Scientific, MS-295-P1, 1:200), BrdU (Abcam, ab92837, 1:400), GFP (Aves Lab, GFP-1010, 1:200) and RFP (Rockland, 600–401-379, 1:400). DAPI (Sigma-Aldrich, D9542, 1:10,000) was used for nuclear staining. VECTASHIELD Antifade Mounting Medium (Vector Laboratories) was used for slide mounting. Images were obtained using a Nikon Ni microscope with NIS-Elements software or scanned using a ZEISS Axioscan 7.
For BrdU+ and pH3+ cardiomyocyte identification, cardiomyocytes with BrdU and pH3 signals encased completely by troponin staining, without any obvious grove, were counted. AurkB+ cardiomyocytes were identified by AurkB signals in troponin+ cell furrows. Quantification involved averaging heart section data from locations: either the ventricular valve level in the four-chamber view or the ligature level in the two-chamber view, ensuring a minimum of 150-μm distance between each sampled section. The cardiomyocyte proliferation rate was calculated as the proportion of proliferative cardiomyocytes (identifiable by BrdU+/pH3+/AurkB+ nuclei) to the total number of cardiomyocytes containing nuclei.
For CycleTrack.
WGA (Invitrogen, W32466, 1:400), mCherry (Abcam, ab167453, 1:200) and GFP (Roche, 11814460001, 1:100) antibodies were used. Data are expressed as:
For pig.
Sections underwent 10-min PBST wash, 10-min fixation with 4% paraformaldehyde at room temperature and antigen retrieval (IHC World), subsequent 3-min permeabilization with chilled acetone, another PBST wash and blocking with 10% donkey serum. Samples were incubated with primary antibodies Ki67 (Abcam, ab1667, 1:100), pH3 (Sigma-Aldrich, 06–570, 1:100), AurkB (Abcam, ab2254, 1:100) and cTnT (R&D Systems, MAB1874, 1:100) overnight at 4 °C, washed three times with PBST and incubated for 60 min with corresponding fluorescently labeled secondary antibodies (Jackson ImmunoResearch), followed by washing and mounting with Antifade Mounting Medium containing DAPI (Vector Laboratories) and imaged with a fluorescence microscope. Ten high-power fields per section, three sections per BZ and RZ in each animal’s heart and three animals per group were used for in vivo assessments. Transverse rings from 1–6 images were taken and used to evaluate the infarct area by ImageJ.
WGA staining and cardiomyocyte size quantification
WGA staining and quantification were performed as previously described18. ImageJ was used to quantify the size of cardiomyocytes that were round and contained a nucleus. At least 500 cells per sample were quantified.
Adult cardiomyocyte isolation and nucleation analysis
Adult hearts were freshly collected, fixed in 4% paraformaldehyde at 4 °C overnight and processed for isolation as previously described18. The isolated cardiomyocytes were co-stained with connexin 43 (IHC World, IW-PA1026, 1:100) or phospho-histone H3 Ser10 (Sigma-Aldrich, 06–570, 1:100) and DAPI for further quantification. For nucleation counts, at least 300 cardiomyocytes per sample were quantified.
Co-IP
CD1 mice were i.p. injected with PBS (control), Paro (100 mg kg−1) and Paro–Neo (150 mg kg−1) from P14 for 14 d. Heart samples at P28 (n = 3 for each) were lysed for immunoprecipitation as previously described18. Five percent of lysates were reserved as input. Lysates (1 mg) were incubated with Hoxb13 antibody (GeneTex, GTX129245, 1:100) with gentle rocking at 4 °C overnight, followed by 4-h incubation with pre-washed Dynabeads Protein G (Invitrogen, 10003D) at 4 °C. Bead–antibody complexes were magnetically separated and washed three times. IgG served as a control for non-specific binding. Proteins were prepared in 2× Laemmli sample buffer (Bio-Rad, 1610737) for western blot analysis.
Western blotting
Ventricles were collected and lysed in RIPA buffer with the addition of a complete protease inhibitor cocktail (Roche) and processed to western blot as previously described39. Primary antibodies were used: p21 Waf1/Cip1 (12D1) (Cell Signaling Technology, 2947, 1:1,000); p15/16 (Santa Cruz Biotechnology, sc-377412; 1:1,000); Meis1/2(C-17) (Santa Cruz Biotechnology, sc-10599, 1:1,500); Hoxb13 (GeneTex, GTX129245, 1:1,000); GAPDH (EMD Millipore, AB2302, 1:5,000). HRP-conjugated anti-mouse, anti-rabbit, anti-chicken or anti-goat antibodies (Jackson ImmunoResearch, 115–035-166, 111–035-144, 703–035-155 and 705–035-147, 1:25,000–1:50,000) were used as secondary antibodies. The membranes were explored using a LI-COR Odyssey Fc system and quantified by Image Studio Lite version 5.2 software.
Flow cytometry
The bone marrow cells were isolated from femurs and tibias of drug-treated or vehicle-treated mice. The collected cells were resuspended in sterile filtered FACS buffer (PBS containing 1% FBS) and filtered through a 70-μm cell strainer before FACS. For analysis of long-termed hematopoietic stem cells (LT-HSCs), single-cell suspensions of bone marrow were blocked with FC Block (BioLegend) in FACS buffer at 4 °C for 15 min, followed by incubation with a biotinylated lineage cocktail (antiCD3, anti-B220, anti-Mac-1, anti-Gr-1 and anti-Ter119; STEMCELL Technologies) and then stained with PE/Cy5.5-streptavidin (eBioscience), FITC-conjugated anti-Scal-1 (E13–161.7), APC-CY7-conjugated anti-c-Kit (2B8), PE-conjugated anti-CD150 (TC15–12F12.2)-PE and Pacific Blue–conjugated anti-CD48 (HM48–1). Exclusion of dead cells was performed using propidium iodide (PI) staining. The frequency of LT-HSCs was defined by the SLAM phenotype (Lin-Scal-1+c-Kit+CD48−CD150+) after exclusion of all lineage cells and dead cells (by PI+). Flow cytometry was carried out using a FACSAria (BD Biosciences), and data were analyzed using FlowJo version 10 software.
Cell culture and transfection
Cultured cells were maintained at 37 °C in a humidified incubator containing 5% CO2. HEK293T cells were cultured in DMEM (Invitrogen) supplemented with 10% (v/v) FBS (Hyclone) and 1% penicillin–streptomycin. Transient transfection was performed with Lipofectamine 3000 Reagent (Thermo Fisher Scientific) for 60% cell confluency according to the manufacturer’s protocol. Fresh media with drug concentrations was added and replaced every 24 h. Cells were collected 24–48 h after transfection for further experiments.
Luciferase reporter assays
Generation of INK4b–ARF–INK4a (p16INK4a/p19ARF/p15INK4b) reporter vector, Meis1A and Hoxb13–GFP plasmid was described previously18,40. To elucidate the transcriptional activation of INK4b–ARF–INK4a locus by Meis1 and Hoxb13, 0.25 μg of INK4b–ARF–INK4apGL2 was co-transfected with 0.2 μg of the Meis1 or Hoxb13 expression vectors and 0.05 μg of Renilla into HEK293T cells in 24-well plates. Forty-eight hours after transfection, the cell lysate was processed for luciferase activity using a Dual-Luciferase Reporter Assay System (Promega), according to the manufacturer’s instructions. Luminescent signal was measured by a luminometer and normalized to Renilla luciferase internal control.
Quantitative real-time PCR
CD1 male mice (Charles River Laboratories) received twice-daily i.p. injections of PBS (control), Paro (100 mg kg−1) and Paro–Neo (150 mg kg−1) for 14 d. For each condition, ventricles from three snap-frozen mouse hearts were used as biological replicates. RNA was extracted using an RNeasy Mini Kit (Qiagen, 74106) according to the manufacturer’s instructions. cDNA was synthesized using iScript Reverse Transcription Supermix (Bio-Rad, 1708840). Real-time PCR was performed with iTaq Universal SYBR Green Supermix (Bio-Rad, 1725120) on a CFX96 Touch Real-Time PCR Detection System (BioRad). GAPDH was used as a housekeeping control to normalize gene expression. Gene expression was assessed and quantified using the ΔΔCt method with the following primers:
Meis1-F: GTTGTCCAAGCCATCACCTT
Meis1-R: ATCCACTCGTTCAGGAGGAA
Hoxb13-F: CCCCTTGCTATAGGGAATGC
Hoxb13-R: AGGTGAACAGAACCCACCAG
Gapdh-F: GAACCCTAAGGCCAACCGTGAAAGAT
Gapdh-R: ACCGCTCGTTGCCAATAGTGATG
RNA-seq and data analysis
CD1 male mice (Charles River Laboratories) were given i.p. injections twice daily with PBS (control), Paro (100 mg kg−1) and Paro–Neo (150 mg kg−1) for 14 d. Ventricles from three snap-frozen mouse hearts per condition served as biological triplicates. Tissues were pulverized in liquid nitrogen and resuspended in 1 ml of TRIzol (Invitrogen, 15596026) per 30 mg of tissue. After chloroform extraction, the aqueous phase was mixed with an equal volume of 75% ethanol and further purified using an RNeasy Mini Kit (Qiagen, 74106) according to the manufacturer’s protocol. RNA integrity was assessed using an Agilent 2100 TapeStation, and only samples with RNA integrity number (RIN) > 7 were used for the library preparation. Stranded mRNA sequencing libraries were generated using a KAPA mRNA HyperPrep Kit (Roche, KK8581) following the manufacturer’s protocol. Sequencing was performed on an Illumina NextSeq 500 system using a 75-bp, high-output sequencing kit for single-end sequencing. The FASTQ files were subjected to quality check using fastqc (version 0.11.2; http://www.bioinformatics.babraham.ac.uk/projects/fastqc) and fastq_screen (version 0.4.4; http://www.bioinformatics.babraham.ac.uk/projects/fastq_screen) and trimmed using fastq-mcf (ea-utils/version 1.1.2–806; https://github.com/ExpressionAnalysis/ea-utils). Trimmed FASTQ files were mapped to mouse genome (mm10, UCSC version from igenomes) using TopHat41. Duplicates were marked 5 using Picard tools (version 1.127; https://broadinstitute.github.io/picard/). Read counts were generated using featureCounts42, and differential expression analysis was performed using edgeR43. The differential expression results with a false discovery rate (FDR) < 0.05 and mRNA fold change > 1.5 as a cutoff were used for further downstream analysis.
ChIP-seq and data analysis
Neonatal CD1 mice received twice-daily i.p. injections of PBS (control) and Paro–Neo (150 mg kg−1) starting from P7 for 7 d. Two ventricles from mouse hearts were used for each condition. ChIP-seq was performed as previously described18. Genes with peaks in their promoters and including the core motif were used to generate the four categories: Meis1 and Hoxb13 in control and Paro–Neo-treated hearts (Venn diagram) (https://bioinfogp.cnb.csic.es/tools/venny/index.html). GO analysis for ChIP-seq peak target genes was performed using WebGestalt44 and Metascape45.
Protein expression and purification
Murine Meis1 (residues 279–334) and murine Hoxb13 (residues 204–279) were subcloned into a pETDuet vector with non-cleavable N-terminal 6×His-tag and transformed into Rosetta (DE3) pLysS cells (Novagen). Target proteins were expressed in cultures grown in auto-induction media at 18 °C overnight. The culture was harvested and sonicated in a lysis buffer (20 mM Tris (pH 8.0), 1 M NaCl and 0.5 mM DTT and supplemented with protease inhibitors). The lysate was centrifuged; the supernatant was loaded onto a Ni-NTA affinity column (Qiagen); and the beads were washed with wash buffer (20 mM Tris (pH 8.0), 1 M NaCl, 0.5 mM DTT and 20 mM imidazole (pH 8.0)) and eluted with elution buffer (20 mM Tris (pH 8.0), 150 mM NaCl, 0.5 mM TCEP and 250 mM imidazole (pH 8.0)). The eluate was concentrated and purified by gel filtration chromatography. The peak fractions were collected and concentrated to 20–50 mg ml−1 and stored at −80 °C.
EMSA
The EMSAs were conducted using a fluorescence-based kit (Invitrogen, E33075) according to the manufacturer’s instructions. Oligos (FW: 5′-GTTGACAGTTTTACGAGG-3′; RV: 5′-CCTCGTAAAACTGTCAAC-3′) were annealed in buffer (10 mM Tris (pH 7.5–8), 50 mM NaCl and 1 mM EDTA) to a final concentration of 100 μM. Reactions included drug (10 μM), annealed oligos (0.5 μM), Meis1 (0.5 μM) or Hoxb13 (0.25 μM) in binding buffer (20 mM Tris (pH 8.0), 1 M NaCl and 0.5 mM TCEP) and were incubated for 30 min at room temperature. Oligo–protein mixture was used as a normalized value. Dissociation constants for Meis1 binding to DNA were determined by EMSA with annealed oligos (0.5 μM), Meis1 (0.5 μM) and varying concentrations of Paro–Neo (0.001–50 μM). Electrophoresis was performed on 8% non-denaturing polyacrylamide gel at 200 V in pre-chilled 0.5× TBE for 35 min, followed by staining with SYBR Green (1:10,000) and deionized water washes. Gels were visualized with the LI-COR Odyssey Fc system and analyzed by Image Studio Lite version 5.2 software.
Crystallization and structure determination
For Paro-bound and Neo-bound Meis1, recombinant Meis1 in 20 mM Tris (pH 8.0), 150 mM NaCl and 0.5 mM TCEP was concentrated to 50 mg ml−1. The protein sample was incubated with 20 mM Neo or Paro before crystallization. The crystals were grown at 20 °C by the hanging drop vapor diffusion method using a 1:1 ratio of protein:reservoir solution containing 2.20 M ammonium sulfate and 4% isopropanol and were flash frozen in 2.20–2.60 M ammonium sulfate, 0.15 M NaCl, 20 mM Tris (pH 8.0), 4% isopropanol and 10 mM neomycin or Paro and 25% ethylene glycol. Meis1 crystals exhibited the symmetry of space group P3212, contained eight monomers (as four dimers) per asymmetric unit and diffracted to a minimum Bragg spacing (dmin) of 2.45 Å for neomycin-bound crystals and 1.91 Å for Paro-bound crystals when exposed to synchrotron radiation. Diffraction data were collected at 100,000 at the Advanced Photon Source beamline 19-ID. Data were indexed, integrated and scaled using the HKL-3000 program package46. Data collection statistics are provided in Supplementary Table 1.
Phase determination, modeling and structure refinement
Phases for the Neo-bound homeobox domain of Meis1 were obtained via molecular replacement in the program Phaser47 using the previously deposited Meis1 dimer coordinates as a search model (PDB ID: 4XRM). Model rebuilding was performed in the program Coot48. Positional and isotropic atomic displacement parameter (ADP), as well as TLS ADP refinement, was performed to a resolution of 2.45 Å using the program Phenix49 with a random 8% of all data set aside for Rfree calculation. The current model contains four Meis1 dimers; included are residues 280–338, aminoglycoside fragments modeled as ribostamycin and water molecules. Model refinement statistics for all structures are provided in Supplementary Table 1.
Statistics and reproducibility
Data are presented as mean ± s.e.m of multiple independent experiments or animals. Data normality was checked by the Shapiro–Wilk test. Data were analyzed by Studentʼs unpaired t-test to compare means when there were two experimental groups, by one-way ANOVA followed by Dunnett’s or Tukey’s post hoc test to compare means among three or more groups or by two-way ANOVA to compare means when there were two or more independent variables. Data were analyzed statistically with GraphPad Prism software (version 10.1.0). Statistical significance was defined by P ≥ 0.05 (not significant), P < 0.05 (*), P ≤ 0.01 (**), P ≤ 0.001 (***) and P ≤ 0.001 (****).
Extended Data
Extended Data Fig. 1 |. Identification of Paro and Neo via a structure-based drug repurposing.

a, Chemical structures of Neo and Paro. b, Docked poses for Neo (magenta) and Paro (green) against S1-S3 sites for MEIS1-HOXB13 crystal structure. Luciferase transcriptional activity assay for p15 with c, Meis1 and d, Hoxb13 against hesperidin and rutin, compared to DMSO (Ctrl). Statistical analyses: two way ANOVA with Tukey’s post-hoc test (c,d); *P < 0.05, **P < 0.01, ***P < 0.001, ****P < 0.0001.
Extended Data Fig. 2 |. Purification and crystallization of Meis1 and Hoxb13.
a-b, Size-exclusion chromatography (Superdex 200) of DBD Meis1 and Hoxb13 purified proteins, respectively. The Y axis shows the absorbance at 280 nm and the X axis shows the elution volume in ml. c-d, Purified and peak fractions of (c) Meis1 and (d) Hoxb13 were analysed by SDS-PAGE and visualised with Coomassie Blue staining. e-f, Quantification for (e) Meis1 and (f) Hoxb13 EMSA showing that Paro, Neo, and Paro–Neo combination disrupt their DNA binding capacities. g, Paro–Neo dissociation constant for Meis1-DNA binding in EMSA assays across 0.001–50 μM drug concentrations. Data are presented as mean ± s.e.m. Statistical analyses: one way ANOVA with Tukey’s post-hoc test (e, f); *P < 0.05, **P < 0.01, ***P < 0.001, ****P < 0.0001.
Extended Data Fig. 3 |. Electron density for Paro and Neo bound Meis1.
a, Crystals of Meis1 grown with 10 mM Neo in hanging drop. b, Close-up of Ribostamycin (grey) bound to Meis1 interacting domains showing the contacts of H 297, P 298, and Y 299 as well as the role of E 303 to form hydrogen-bond interactions. c, Electron density for Paro-bound Meis1: Shown in grey mesh is the ½2mFo-DFc½ electron density, contoured at 0.5 s. Shown in stick representation are H 297 (green) in chain A, H 294 (yellow) in chain D and the Ribostamycin fragment of Paro (cyan). d, Electron density for Neo-bound Meis1: shown in Grey mesh is the ½2mFo-DFc½ electron density, contoured at 0.7 s. Shown in stick representation are H 297 (green) in chain G, H 294 (yellow) in the symmetry-related chain D and the Ribostamycin fragment of neomycin (cyan). e, Ribbon cartoon representation for Hoxb13 (Cyan) and Meis1 (Orange) along with Ribostamycin (Purple) and close-up for the contributing amino acid residues from Hoxb13 and Meis1 along with Ribostamycin. This was modelled using alignment of PDB_ID; 5EGO and Paro bound to Meis1 at RMSD 0.373 A°. f, Ribbon cartoon representation for Hoxb13 (Cyan) and Meis1 (Orange) along with Ribostamycin (Purple) and close-up for the contributing amino acid residues from Hoxb13 and Meis1 along with Ribostamycin. This was modelled using alignment of PDB_ID: 5EGO and Neo bound to Meis1 at RMSD 0.373 A°.
Extended Data Fig. 4 |. Paro treatment promotes adult cardiomyocyte division.

a-c, (a) BW, (b) HW, and (c) HW/BW in control and Paro-treated 10-weeks CD-1 mice. Ctrl, n = 5; Paro-treated groups, n = 5. d, Representative images of immunostaining for pH3 (green), cTnT (red) and nucleus (blue), showing additional examples of mitotic cardiomyocytes in Paro-treated mice. e, Representative images of immunostaining for AurkB (green), cTnT (red) and nucleus (blue), showing additional examples of cytokinesis cardiomyocytes in Paro-treated mice. f, Representative images and quantification for pH3 and cTnT staining in Paro-treated isolated cardiomyocytes. Scale bars, 10 μm (d-f). Data are presented as mean ± s.e.m.; Student’s unpaired two-sided t-test. Data in a-c were done for n = 5 for each group. Data in f were done for n = 4 for each group. *P < 0.05, **P < 0.01, ***P < 0.001.
Extended Data Fig. 5 |. Paro–Neo treatment prolongs neonatal cardiomyocyte proliferation.

a, Schematic for Paro–Neo administration to neonates CD-1 pups at 300 mg kg−1, i.p from p1 to p14. Hearts were collected for histological analysis. b, (Left, upper and right) Representative images of immunostaining for pH3 (green), cTnT (red) and nucleus (blue) showing mitotic cardiomyocytes (arrowheads) in Paro–Neo-treated mice; and (left, lower) the quantification. Ctrl, n = 6; Paro–Neo-treated groups, n = 3. c, (Left, upper and right) Representative images of immunostaining for aurora B kinase (green), cTnT (red) and nucleus (blue) showing cytokinesis cardiomyocytes (arrowheads) in Paro–Neo-treated mice; and (left, lower) the quantification. Ctrl, n = 6; Paro–Neo-treated groups, n = 3. d, Representative images and quantification for CSA cardiomyocyte size from WGA (green) and nucleus (blue) staining show no difference in cell size between Paro–Neo and vehicle-treated hearts. Ctrl, n = 3; Paro–Neo-treated groups, n = 4. Data are presented as mean ± s.e.m.; Student’s unpaired two-sided t-test (b,c). Data in b-d were done for at least n = 3 for each group. *P < 0.05, **P < 0.01, ***P < 0.001. Scale bars, 10 μm (b,c) d-f and 100 μm (d).
Extended Data Fig. 6 |. Paro–Neo treatment promotes adult cardiomyocyte division.

a, Schematic for Paro–Neo administration to adult CD-1 mice at 300 mg kg−1, i.p. for 2 weeks. Hearts were collected for histological analysis. b-d, (b) BW, (c) HW, and (d) HW/BW in control and Paro–Neo-treated mice. e, Representative images of immunostaining for pH3 (green), cTnT (red) and nucleus (blue), showing additional examples of mitotic cardiomyocytes in Paro–Neo-treated mice. f, Representative images of immunostaining for AurkB (green), cTnT (red) and nucleus (blue), showing additional examples of cytokinesis cardiomyocytes (arrowheads) in Paro–Neo-treated mice. g, (Upper) Representative images and (lower) quantification for pH3 and cTnT staining in Paro–Neo-treated isolated cardiomyocytes. Data are presented as mean ± s.e.m.; Student’s unpaired two-sided t-test (b-d, g). Data in b-d were done for n = 5 for control group and n = 8 for Paro–Neo-treated group. Data in g were done for n = 4 for each group. *P < 0.05, **P < 0.01, ***P < 0.001. Scale bars, 10 μm (e-g).
Extended Data Fig. 7 |. RNA-seq with ChIP-seq guided targets.

a, Representative sequencing tracks showing Meis1 ChIP-seq peaks in vehicle-treated (blue) and Paro–Neo-treated (red) hearts at Myh6 locus demonstrating the absence of the peaks in Paro–Neo-treated samples. b, Unbiased RNA-seq (with a fold change of 1.5). Venn diagrams show the common genes of two cohorts (DiKO vs Paro–Neo-treated hearts, normalised to Ctrl). c-d, GO terms of (c) dKO and (d) Paro–Neo treated hearts.
Extended Data Fig. 8 |. In vivo pharmacological effect of aminoglycosides on the expression of cell cycle inhibitors, Meis1, Hoxb13, and HSCs.

a, Neonatal CD-1 mice received twice daily injections, i.p. of PBS, Paro (100 mg kg−1), Neo (100 mg kg−1), and Paro–Neo (150 mg kg−1) starting from p14 till p28. b-d, (b) Representative WB and densitometry quantification of (c) p15/p16 and (d) p21 protein expression, n = 4 for each group. Gapdh serves as loading controls. e-f, mRNA expression of (e) Meis1 and (f) Hoxb13 following drug treatment, n = 3 for each group. g-i, (g) Representative WB and densitometry quantification of (h) Meis1 and (i) Hoxb13 protein expression, n = 3 for each group. Gapdh serves as loading controls. j-l, Paro–Neo administration increases HSC number. 10-week-old mice received daily injections of Ctrl or Paro–Neo for 14 days. k, Representative flow cytometry for Ctrl and Paro–Neo-treated samples. l, Histograms of the means of LT-HSCs. Ctrl, n = 8; Paro/Neo-treated groups, n = 7. Data are presented as mean ± s.e.m. Statistical analyses: one-way ANOVA with Tukey’s post-hoc test (c-f, h, i), Student’s unpaired two-sided t-test (l); *P < 0.05, **P < 0.01, ***P < 0.001, ****P < 0.0001.
Extended Data Fig. 9 |. Aminoglycosides prevent cardiac remodelling in MI mouse model.

a, Schematic of MI model in drug(s)-treated mice b, Serial echocardiography assessment of LVEF showing maintained LVEF post-MI in Paro- and Paro–Neo-treated mice, compared with controls. However, higher LVEF post-MI in Paro–Neo-treated mice was observed. c, Representative echocardiography images for Ctrl, Paro-, and Paro–Neo-treated hearts at 1 week (pre-injection) and 8 weeks post-MI. d-k, Serial echocardiographic measurement of Ctrl, Paro-, and Paro–Neo-treated mice. l, Masson’s trichrome staining of hearts post-MI shows a marked decrease in LV dilatation and remodelling of Paro–Neo-treated hearts, compared with Ctrl hearts. m, Paro-treated hearts show a non-significant decline in the infarcted size, while Paro–Neo-treated hearts show a significant decrease in the infarcted size midline length, compared with controls. Ctrl, n = 6; Paro, n = 5, and Paro–Neo-treated groups, n = 8. n-p, (n) BW, (o) HW, and (p) HW/BW in Ctrl, Paro-, and Paro–Neo-treated mice. Ctrl, n = 6; Paro, n = 5, and Paro–Neo-treated groups, n = 5. q, Wet to dry lung ratio shows a significant decrease in the Paro and Paro–Neo-treated mice, compared with controls. Ctrl, n = 6; Paro, n = 5, and Paro–Neo-treated groups, n = 5. Data are presented as mean ± s.e.m. Statistical analyses: two-way ANOVA with Tukey’s post-hoc test (b); one-way ANOVA with Tukey’s post-hoc test (m-q); *P < 0.05, **P < 0.01, ***P < 0.001, ****P < 0.0001.
Extended Data Fig. 10|. Schematic of Paro and Neo inhibiting Meis1 and Hoxb13 transcriptional activity.

In-silico screening identifies the FDA-approved drugs Paromomycin and Neomycin as inhibitors of Meis1 and Hoxb13 DNA binding, thereby promoting heart regeneration.
Supplementary Material
Acknowledgements
The authors gratefully acknowledge the Molecular Pathology Core at The University of Texas Southwestern Medical Center (UTSW) and J. Shelton for help with histology; J. Xu and Y. J. Kim from the Next Generation Sequencing Core Facility at the Children’s Research Institute at UTSW for performing the Illumina sequencing; and E. Olson, M. Parker, Z. Wang, B. McConnell and the Whole Brain Microscopy Facility at UTSW for their support and assistance in this work. The authors thank the Structural Biology Laboratory and H. Aronovich at UTSW for support with X-ray crystallographic studies. Results shown in this report are derived from work performed at the Argonne National Laboratory and the Structural Biology Center at the Advanced Photon Source, under Department of Energy Office of Biological and Environmental Research contract DE-AC02-06CH11357. H.A.S. was supported by grants from the National Institutes of Health (NIH) (R01 HL137415-02, R01 HL147276-01, R01 HL149137-01, 1P01HL160476-01A1, R35 HL166563-01 and P01HL160488), the Cancer Prevention and Research Institute of Texas (RP160520), the Hamon Center for Regenerative Science and Medicine and the Leducq Foundation (Redox Regulation of Cardiomyocyte Renewal). M.S.A was funded by NIH R01GM119336. N.U.N.N. was supported by grants from the American Heart Association (856552 and 19POST34450039). N.V.G was supported by grants from the NIH (GM127390) and the Welch Foundation (I-1505). C.C.Z. was supported by Leukemia & Lymphoma Society grant (6629-21) and NIH (R01CA248736). Work in the M.G. laboratory was supported by European Research Council Advanced Grant 787971 ‘CuRE’; British Heart Foundation Programme Grant RG/19/11/34633; and grants 825670 ‘CardioReGenix’ and 874764 ‘REANIMA’ from the European Commissionʼs Horizon 2020 program.
Footnotes
Competing interests
M.G. is founder, consultant, member of the board and equity holder in Forcefield Therapeutics, Heqet Therapeutics and Purespring Therapeutics. All other authors declare no competing interests.
Reporting summary
Further information on research design is available in the Nature Portfolio Reporting Summary linked to this article.
Additional information
Extended data is available for this paper at https://doi.org/10.1038/s44161-024-00450-y.
Peer review information Nature Cardiovascular Research thanks the anonymous reviewer(s) for their contribution to the peer review of this work.
Reprints and permissions information is available at www.nature.com/reprints.
Supplementary information The online version contains supplementary material available at https://doi.org/10.1038/s44161-024-00450-y.
Data availability
All data supporting the findings in this study are included in the main article and associated files. Source Data are provided with the manuscript. The crystal structure for the Meis1 homeobox domain bound to paromomycin or neomycin fragment was deposited to the Protein Data Bank with accession codes 8VTS and 8VTT, respectively. ChIP-seq data have been deposited in the Gene Expression Omnibus (GEO) under accession number GSE240437. RNA-seq data have been deposited in the GEO under accession number GSE240519.
References
- 1.Bui AL, Horwich TB & Fonarow GC Epidemiology and risk profile of heart failure. Nat. Rev. Cardiol. 8, 30–41 (2011). [DOI] [PMC free article] [PubMed] [Google Scholar]
- 2.Senyo SE et al. Mammalian heart renewal by pre-existing cardiomyocytes. Nature 493, 433–436 (2013). [DOI] [PMC free article] [PubMed] [Google Scholar]
- 3.Bergmann O et al. Evidence for cardiomyocyte renewal in humans. Science 324, 98–102 (2009). [DOI] [PMC free article] [PubMed] [Google Scholar]
- 4.Poss KD Getting to the heart of regeneration in zebrafish. Semin. Cell Dev. Biol. 18, 36–45 (2007). [DOI] [PubMed] [Google Scholar]
- 5.Walsh S, Ponten A, Fleischmann BK & Jovinge S Cardiomyocyte cell cycle control and growth estimation in vivo—an analysis based on cardiomyocyte nuclei. Cardiovasc. Res. 86, 365–373 (2010). [DOI] [PubMed] [Google Scholar]
- 6.Porrello ER et al. Transient regenerative potential of the neonatal mouse heart. Science 331, 1078–1080 (2011). [DOI] [PMC free article] [PubMed] [Google Scholar]
- 7.Soonpaa MH, Kim KK, Pajak L, Franklin M & Field LJ Cardiomyocyte DNA synthesis and binucleation during murine development. Am. J. Physiol. 271, H2183–H2189 (1996). [DOI] [PubMed] [Google Scholar]
- 8.Chaudhry HW et al. Cyclin A2 mediates cardiomyocyte mitosis in the postmitotic myocardium. J. Biol. Chem. 279, 35858–35866 (2004). [DOI] [PubMed] [Google Scholar]
- 9.Soonpaa MH et al. Cyclin D1 overexpression promotes cardiomyocyte DNA synthesis and multinucleation in transgenic mice. J. Clin. Invest. 99, 2644–2654 (1997). [DOI] [PMC free article] [PubMed] [Google Scholar]
- 10.Sim CB et al. Dynamic changes in the cardiac methylome during postnatal development. FASEB J. 29, 1329–1343 (2015). [DOI] [PubMed] [Google Scholar]
- 11.Trivedi CM, Lu MM, Wang Q & Epstein JA Transgenic overexpression of Hdac3 in the heart produces increased postnatal cardiac myocyte proliferation but does not induce hypertrophy. J. Biol. Chem. 283, 26484–26489 (2008). [DOI] [PMC free article] [PubMed] [Google Scholar]
- 12.Puente BN et al. The oxygen-rich postnatal environment induces cardiomyocyte cell-cycle arrest through DNA damage response. Cell 157, 565–579 (2014). [DOI] [PMC free article] [PubMed] [Google Scholar]
- 13.Porrello ER et al. miR-15 family regulates postnatal mitotic arrest of cardiomyocytes. Circ. Res. 109, 670–679 (2011). [DOI] [PMC free article] [PubMed] [Google Scholar]
- 14.Eulalio A et al. Functional screening identifies miRNAs inducing cardiac regeneration. Nature 492, 376–381 (2012). [DOI] [PubMed] [Google Scholar]
- 15.Heallen T et al. Hippo pathway inhibits Wnt signaling to restrain cardiomyocyte proliferation and heart size. Science 332, 458–461 (2011). [DOI] [PMC free article] [PubMed] [Google Scholar]
- 16.Chen J et al. mir-17–92 cluster is required for and sufficient to induce cardiomyocyte proliferation in postnatal and adult hearts. Circ. Res. 112, 1557–1566 (2013). [DOI] [PMC free article] [PubMed] [Google Scholar]
- 17.Kiserud T Physiology of the fetal circulation. Semin. Fetal Neonatal Med. 10, 493–503 (2005). [DOI] [PubMed] [Google Scholar]
- 18.Nguyen NUN et al. A calcineurin–Hoxb13 axis regulates growth mode of mammalian cardiomyocytes. Nature 582, 271–276 (2020). [DOI] [PMC free article] [PubMed] [Google Scholar]
- 19.Henley MJ & Koehler AN Advances in targeting ‘undruggable’ transcription factors with small molecules. Nat. Rev. Drug Discov. 20, 669–688 (2021). [DOI] [PubMed] [Google Scholar]
- 20.Arkin MR, Tang Y & Wells JA Small-molecule inhibitors of protein–protein interactions: progressing toward the reality. Chem. Biol. 21, 1102–1114 (2014). [DOI] [PMC free article] [PubMed] [Google Scholar]
- 21.Grembecka J et al. Menin-MLL inhibitors reverse oncogenic activity of MLL fusion proteins in leukemia. Nat. Chem. Biol. 8, 277–284 (2012). [DOI] [PMC free article] [PubMed] [Google Scholar]
- 22.Ahmed MS et al. Identification of tetracycline combinations as EphB1 tyrosine kinase inhibitors for treatment of neuropathic pain. Proc. Natl Acad. Sci. USA 118, e2016265118 (2021). [DOI] [PMC free article] [PubMed] [Google Scholar]
- 23.Yin Y et al. Impact of cytosine methylation on DNA binding specificities of human transcription factors. Science 356, eaaj2239 (2017). [DOI] [PMC free article] [PubMed] [Google Scholar]
- 24.Nair AB & Jacob S A simple practice guide for dose conversion between animals and human. J. Basic Clin. Pharm. 7, 27–31 (2016). [DOI] [PMC free article] [PubMed] [Google Scholar]
- 25.Musa AM et al. Paro for the treatment of visceral leishmaniasis in Sudan: a randomized, open-label, dose-finding study. PLoS Negl. Trop. Dis. 4, e855 (2010). [DOI] [PMC free article] [PubMed] [Google Scholar]
- 26.Goeman F et al. Molecular imaging of nuclear factor-Y transcriptional activity maps proliferation sites in live animals. Mol. Biol. Cell 23, 1467–1474 (2012). [DOI] [PMC free article] [PubMed] [Google Scholar]
- 27.Kocabas F et al. Meis1 regulates the metabolic phenotype and oxidant defense of hematopoietic stem cells. Blood 120, 4963–4972 (2012). [DOI] [PMC free article] [PubMed] [Google Scholar]
- 28.Liu Y et al. Pharmacokinetics of neomycin sulfate after intravenous and oral administrations in swine. J. Vet. Pharmacol. Ther. 44, 850–853 (2021). [DOI] [PubMed] [Google Scholar]
- 29.Bruni GN & Kralj JM Membrane voltage dysregulation driven by metabolic dysfunction underlies bactericidal activity of aminoglycosides. eLife 9, e58706 (2020). [DOI] [PMC free article] [PubMed] [Google Scholar]
- 30.Jospe-Kaufman M, Siomin L & Fridman M The relationship between the structure and toxicity of aminoglycoside antibiotics. Bioorg. Med. Chem. Lett. 30, 127218 (2020). [DOI] [PMC free article] [PubMed] [Google Scholar]
- 31.Zeitz MJ & Smyth JW Translating translation to mechanisms of cardiac hypertrophy. J. Cardiovasc. Dev. Dis. 7, 9 (2020). [DOI] [PMC free article] [PubMed] [Google Scholar]
- 32.Ye L et al. Cardiac repair in a porcine model of acute myocardial infarction with human induced pluripotent stem cell-derived cardiovascular cells. Cell Stem Cell 15, 750–761 (2014). [DOI] [PMC free article] [PubMed] [Google Scholar]
- 33.Halgren TA Merck molecular force field. I. Basis, form, scope, parameterization, and performance of MMFF94. J. Comput. Chem. 17, 490–519 (1996). [Google Scholar]
- 34.Naïm M et al. Solvated interaction energy (SIE) for scoring protein–ligand binding affinities. 1. Exploring the parameter space. J. Chem. Inf. Model. 47, 122–133 (2007). [DOI] [PubMed] [Google Scholar]
- 35.Labute P Protonate3D: assignment of ionization states and hydrogen coordinates to macromolecular structures. Proteins 75, 187–205 (2009). [DOI] [PMC free article] [PubMed] [Google Scholar]
- 36.Pettersen EF et al. UCSF Chimera—a visualization system for exploratory research and analysis. J. Comput. Chem. 25, 1605–1612 (2004). [DOI] [PubMed] [Google Scholar]
- 37.Hara H et al. Discovery of a small molecule to increase cardiomyocytes and protect the heart after ischemic injury. JACC Basic Transl. Sci. 3, 639–653 (2018). [DOI] [PMC free article] [PubMed] [Google Scholar]
- 38.Arsic N et al. Induction of functional neovascularization by combined VEGF and angiopoietin-1 gene transfer using AAV vectors. Mol. Ther. 7, 450–459 (2003). [DOI] [PubMed] [Google Scholar]
- 39.Lam NT et al. Targeting calcineurin induces cardiomyocyte proliferation in adult mice. Nat. Cardiovasc. Res. 1, 679–688 (2022). [Google Scholar]
- 40.Mahmoud AI et al. Meis1 regulates postnatal cardiomyocyte cell cycle arrest. Nature 497, 249–253 (2013). [DOI] [PMC free article] [PubMed] [Google Scholar]
- 41.Kim D et al. TopHat2: accurate alignment of transcriptomes in the presence of insertions, deletions and gene fusions. Genome Biol. 14, R36 (2013). [DOI] [PMC free article] [PubMed] [Google Scholar]
- 42.Liao Y, Smyth GK & Shi W featureCounts: an efficient general purpose program for assigning sequence reads to genomic features. Bioinformatics 30, 923–930 (2013). [DOI] [PubMed] [Google Scholar]
- 43.Robinson MD, McCarthy DJ & Smyth GK edgeR: a Bioconductor package for differential expression analysis of digital gene expression data. Bioinformatics 26, 139–140 (2009). [DOI] [PMC free article] [PubMed] [Google Scholar]
- 44.Liao Y, Wang J, Jaehnig EJ, Shi Z & Zhang B WebGestalt 2019: gene set analysis toolkit with revamped UIs and APIs. Nucleic Acids Res. 47, W199–w205 (2019). [DOI] [PMC free article] [PubMed] [Google Scholar]
- 45.Zhou Y et al. Metascape provides a biologist-oriented resource for the analysis of systems-level datasets. Nat. Commun. 10, 1523 (2019). [DOI] [PMC free article] [PubMed] [Google Scholar]
- 46.Minor W, Cymborowski M, Otwinowski Z & Chruszcz M HKL-3000: the integration of data reduction and structure solution—from diffraction images to an initial model in minutes. Acta Crystallogr. D Biol. Crystallogr 62, 859–866 (2006). [DOI] [PubMed] [Google Scholar]
- 47.McCoy AJ et al. Phaser crystallographic software. J. Appl. Crystallogr. 40, 658–674 (2007). [DOI] [PMC free article] [PubMed] [Google Scholar]
- 48.Emsley P, Lohkamp B, Scott WG & Cowtan K Features and development of Coot. Acta Crystallogr. D Biol. Crystallogr 66, 486–501 (2010). [DOI] [PMC free article] [PubMed] [Google Scholar]
- 49.Afonine PV et al. Joint X-ray and neutron refinement with phenix.refine. Acta Crystallogr. D Biol. Crystallogr 66, 1153–1163 (2010). [DOI] [PMC free article] [PubMed] [Google Scholar]
Associated Data
This section collects any data citations, data availability statements, or supplementary materials included in this article.
Supplementary Materials
Data Availability Statement
All data supporting the findings in this study are included in the main article and associated files. Source Data are provided with the manuscript. The crystal structure for the Meis1 homeobox domain bound to paromomycin or neomycin fragment was deposited to the Protein Data Bank with accession codes 8VTS and 8VTT, respectively. ChIP-seq data have been deposited in the Gene Expression Omnibus (GEO) under accession number GSE240437. RNA-seq data have been deposited in the GEO under accession number GSE240519.