

Abstract
Background:
In the U.S., overdose deaths and substance treatment admissions related to methamphetamine are rising. This study aims to measure and compare U.S. temporal trends in methamphetamine-involved psychiatric hospitalizations.
Methods:
We conducted a population-based, trend analysis of U.S. psychiatric hospitalizations and calculated quarterly (Q) rates per 100,000 population of substance-involved psychiatric hospitalizations. We assessed U.S. regional quarterly percentage hospitalization rate changes using Joinpoint regression.
Results:
From Q4 2015-Q4 2019, there were 963,202 psychiatric hospitalizations, 50,223 (5.2%) involved methamphetamine and 102,877 (10.7%) involved opioids and/or cocaine without methamphetamine. Methamphetamine-involved psychiatric hospitalization rates increased by 68.0%, psychiatric hospitalizations rates involving opioid and/or cocaine without methamphetamine decreased by 22%, while nonsubstance-involved psychiatric hospitalizations rates remained unchanged. The largest significant increases in methamphetamine-involved psychiatric hospitalization rates were among people >61 years old, males, and Midwesterners. Methamphetamine-involved psychiatric hospitalization rates doubled among Black patients. The largest average percent increase among methamphetamine-involved psychiatric hospitalizations was 10.2% from Q4 2015-Q2 2017 in the Midwest.
Conclusion and Relevance:
Most psychiatric hospitalizations did not involve substances. Methamphetamine-involved psychiatric hospitalizations greatly increased while opioid-involved psychiatric hospitalizations decreased, but involved more total encounters. Greater access to harm reduction services, contingency management programs, and mental health services is urgently needed.
Keywords: methamphetamine, opioids, psychiatric, hospitalization, substance, nonsubstance
Introduction
In the United States (U.S.), methamphetamine use, including high-risk methamphetamine use by injection or greater frequency of use,1 is at its highest levels in the last 25 years. National survey data demonstrated a 43% increase in past year methamphetamine use (1.4 million to 2 million people) from 2015 to 2019,.1 These data largely exclude people experiencing homelessness, incarceration, or hospitalization, thus the actual prevalence of methamphetamine use is likely higher.2 Methamphetamine-involved healthcare utilization3 and methamphetamine-related deaths4 are also at record highs. Amphetamine-involved hospitalizations increased more than 270% from 2008 to 2015, with the highest number of hospitalizations occurring in Western U.S.3 Drug overdose death rates involving psychostimulants (i.e., methamphetamine) increased more than 300%, from 1.2 per 100,000 persons in 2013 to 5.0 per 100,000 persons in 2019.5 Highly potent synthetic opioids, especially fentanyl and its derivatives, are now ubiquitous in the U.S. drug supply and contributed to an increase in overdose, including polysubstance-related deaths.6,7 The increase in amphetamine-involved hospitalizations reported in the last decade was likely multifactorial and due to injection-related serious infections,8 including skin and soft tissue infections,9 and infective endocarditis.10
Much has been made in the U.S. media regarding changes in methamphetamine supply, purity, and potency impacting some of these increases in methamphetamine-related morbidity and mortality.11,12 Most notably is the scientifically unsubstantiated claim that “new meth” – methamphetamine that hit the streets in 2012, but became increasingly available in more recent years, has led to increased psychiatric symptoms and is a driving factor in homelessness.13 The prevalence of substance-induced psychotic disorders among people who use methamphetamine is approximately 36.5%.14 Methamphetamine-related psychiatric symptoms include psychosis, anxiety and depression,15–20 mood disturbance,20–22 irritability,23 delusions and paranoia,15,20,24 and suicidal ideation.19,25,26 While people with schizophrenia are more susceptible to psychosis when they use methamphetamine, most psychotic episodes in people who use methamphetamine occur in the absence of a primary psychotic disorder.19,27–30 Some people with methamphetamine-associated psychosis will go on to have a persistent disorder resembling schizophrenia.23
In the context of increasing methamphetamine-related overdose deaths1,4 and Drug Enforcement Administration (DEA)-reported higher potency of methamphetamine available in the U.S. drug supply,12 we sought to characterize trends in U.S. methamphetamine-involved psychiatric hospitalizations. We also aimed to measure and compare trends in U.S. nationwide hospitalizations with a primary psychiatric diagnosis that were substance-involved (methamphetamine +/− opioids and +/− cocaine) or nonsubstance involved from 2015 to 2019, across different sociodemographic and geographic groups.
Methods
Study Design, data source, and oversight
This population-based, trend analysis of U.S. psychiatric hospitalizations utilized publicly available data from the Healthcare Cost and Utilization Project National Inpatient Sample (HCUP-NIS).31 HCUP-NIS is a 20% stratified sample of community hospitalizations from participating states which represents over 97% of the U.S. population.31 Most U.S. hospitals are classified as community hospitals and two-thirds are located in large cities, some provide general care, others focus on certain disease and conditions.32 Community hospitals can have as few as six bed or more than 500 beds.32 HCUP-NIS excludes short-term rehabilitation hospitals, long-term acute care hospitals,31 psychiatric-specific hospitals,33 psychiatric residential treatment centers,33 psychiatric partial hospitalization treatment,33 and substance use treatment facilities.34 Standard HCUP-NIS survey weighting and U.S. Census population data produced an analytic sample representative of all U.S. hospitalizations.35
The study sample included all hospitalizations of U.S. adults ages 18 years or older from October 2015 to December 2019, in which each year was divided into quarters (Q1 to Q4). We defined a “psychiatric hospitalization” as having an International Classification of Diseases 10-Revison, Clinical Modification (ICD-10-CM)36 diagnostic codes for anxiety, depressive, or bipolar disorders, schizophrenia, and other psychotic disorders listed in the first diagnostic position of the hospitalization (Appendix 1). To identify psychiatric hospitalizations only involving psychosis, we further limited psychiatric hospitalizations to only include ICD codes defined as “schizophrenia and other psychotic disorders”. We defined these hospitalizations as “psychiatric hospitalizations with psychosis”. The inclusion of psychiatric diagnoses was informed by the Chronic Conditions Data Warehouse research database “Other Chronic Health, Mental Health, and Potentially Disabling Conditions.”37,38 Next, we identified amphetamine/psychostimulant, cocaine, and opioid misuse or use disorder, poisoning, or adverse effects using their respective ICD-10 codes (Appendix 1). Diagnostic codes involving psychostimulants or amphetamines do not distinguish between methamphetamine use and the non-medical use of prescription amphetamines. Based on available evidence, we assumed that most psychostimulant-involved or amphetamine-involved hospitalizations were attributable to methamphetamine.3,39 For a psychiatric hospitalization to be “substance-involved,” we identified a diagnostic code for the above substances in any secondary diagnostic position for a given hospitalization. As such, our final sample included hospitalizations with a primary psychiatric diagnosis with or without a secondary diagnosis of substance use, misuse, use disorder, poisoning, or substance-related adverse event. We also included sociodemographic characteristics for psychiatric hospitalizations including age, sex, race, ethnicity, insurance payor, and U.S. hospital census region, defined as the Northeast, Midwest, South, and West.40 Notably, the ICD-9 to ICD-10 conversion occurred in October 2015, thus we excluded data from January to September 2015 to account for this conversion.41 We did not include 2020 and 2021 HCUP-NIS data because the COVID-19 pandemic may have disrupted usual healthcare utilization patterns impacting study results.42
This study used routinely collected, publicly available data, does not involve human subjects, and therefore did not require IRB approval. The study followed the Strengthening the Reporting of Observational Studies in Epidemiology (STROBE) reporting guidelines (See supplementary appendix for checklist).43
Outcome Measures
Our primary outcome was U.S. quarterly methamphetamine-involved psychiatric hospitalization rates per 100,000 general population based on U.S. Census data, defined as methamphetamine with or without opioids or cocaine. Our secondary outcome was U.S. quarterly methamphetamine-involved psychiatric hospitalization rates with and ICD code for psychosis per 100,000 general population. We examined quarterly rates of other substance and nonsubstance involved psychiatric hospitalization groups including:
Group 1) methamphetamine alone (no cocaine, no opioids),
Group 2) methamphetamine and cocaine (no opioids),
Group 3) methamphetamine and opioids (no cocaine),
Group 4) methamphetamine and cocaine and opioids,
Group 5) all methamphetamine-involved psychiatric hospitalizations, our primary outcome (combined Groups 1, 2, 3, and 4),
Group 6) psychiatric hospitalizations involving opioids and/or cocaine (no methamphetamine),
Group 7) nonsubstance-involved psychiatric hospitalizations (no cocaine, no opioids, no methamphetamine), and
Group 8) all psychiatric hospitalizations in the dataset (substance-involved and nonsubstance involved);
Group 5 + Group 6 + Group 7 = Group 8.
Statistical Analysis
We completed descriptive analyses using Python (Version 3.10.1, Python Software Foundation, Beaverton, OR) and Statistical Analytical Software (SAS), version 9.4. We completed Joinpoint regression analyses to identify the average quarterly percent change (QPC) in regional hospitalization rates using Joinpoint Trend Analysis Software, (Version 4.8.0.1, National Cancer Institute, Bethesda, MD). The analysis allowed us to identify the best-fitting points (quarters) with a statistically significant increase or decrease in methamphetamine-involved and nonsubstance-involved psychiatric hospitalization rates from Q4 2015 to Q4 2019. We specified a maximum of three joinpoints in the analysis based on the algorithmic recommendation for our 17 datapoints (quarters) and chose the significant model.44,45 All tests were 2-sided, and significance was set a priori at 0.05. When reporting results, we suppressed groups with counts of ten or less according the HCUP guidelines.46
Results
From Q4 2015 to Q4 2019, there were 963,202 psychiatric hospitalizations (Group 8). Most psychiatric hospitalizations did not involve substances (n=810,102; 84.1%) (Group 7), 10.7% (n=102,877) involved opioids and/or cocaine without methamphetamine (Group 6), and 5.2% (n=50,223) involved methamphetamine with or without opioids and/or cocaine (Group 5) (Table 1). Methamphetamine-involved psychiatric hospitalizations were more frequent among patients aged 18 to 30 (n=16,902; 33.7%) and patients aged 31 to 40 (n=16,505; 32.9%) years old, men (n=31,066; 61.9%), White patients (n=31,741; 63.2%), Medicaid beneficiaries (n=26,520; 52.8%), and people living in the West (n=20,329; n=40.5%) (Table 1).
Table 1.
Demographic characteristics of substance-involved and non-substance-involved psychiatric hospitalizations, Q4–2015 to Q4–2019
| 2015–2019 | Group 1: MAMPa aloneb (n=35,983) |
Group 2: MAMP + cocaine, no opioidsc (n=4,876) |
Group 3: MAMP + opioids, no cocained (n=7,519) |
Group 4: MAMP + opioids + cocainee (n=1,845) |
Group 5: All MAMPf,j (n=50,223) |
Group 6: Opioids + cocaine, no MAMPg (n=102,877) |
Group 7: Psych, no substancesh (n=810,102) |
Group 8: All Psychi,k (n=963,202) |
|---|---|---|---|---|---|---|---|---|
| Age | ||||||||
| 18–30 | 11978 | 1456 | 2796 | 672 | 16902 | 23617 | 241840 | 282359 |
| 31–40 | 11623 | 1475 | 2761 | 646 | 16505 | 27276 | 153248 | 197029 |
| 41–50 | 7328 | 1050 | 1265 | 344 | 9987 | 23964 | 137986 | 171937 |
| 51–60 | 4295 | 744 | 563 | 156 | 5758 | 21477 | 145570 | 172805 |
| >61 | 759 | 151 | 134 | 27 | 1071 | 6543 | 131458 | 139072 |
| Gender | ||||||||
| Male | 22406 | 3167 | 4384 | 1109 | 31066 | 62113 | 404210 | 497389 |
| Female | 13573 | 1708 | 3135 | 736 | 19152 | 40752 | 405763 | 465567 |
| Missing | 22406 | 3167 | 4384 | 1109 | 31066 | 62113 | 404210 | 497389 |
| Race | ||||||||
| White | 22102 | 2409 | 5901 | 1329 | 31741 | 58507 | 489960 | 580208 |
| Black | 4439 | 1450 | 327 | 241 | 6457 | 28519 | 160609 | 195585 |
| Hispanic | 5523 | 607 | 554 | 140 | 6824 | 8777 | 78961 | 94562 |
| Asian/Pacific Islander/Native American/Other | 1955 | 199 | 228 | 56 | 2438 | 3995 | 44920 | 51353 |
| Missing | 1964 | 211 | 509 | 79 | 2763 | 3079 | 35652 | 41494 |
| Insurance Status | ||||||||
| Medicare | 5927 | 912 | 1011 | 253 | 8103 | 22473 | 242230 | 272806 |
| Medicaid | 19279 | 2500 | 3798 | 943 | 26520 | 47813 | 270223 | 344556 |
| Private/Self Pay/No Charge/Others | 10663 | 1453 | 2661 | 639 | 15416 | 32251 | 295615 | 343282 |
| Missing | 114 | 11 | 49 | 10 | 184 | 340 | 2034 | 2558 |
| Regionl | ||||||||
| Northeast | 1491 | 405 | 612 | 300 | 2808 | 28823 | 176363 | 207994 |
| Midwest | 8557 | 980 | 1837 | 418 | 11792 | 25478 | 215689 | 252959 |
| South | 9720 | 1890 | 2906 | 778 | 15294 | 40736 | 291962 | 347992 |
| West | 16215 | 1601 | 2164 | 349 | 20329 | 7840 | 126088 | 154257 |
MAMP = methamphetamine
Group 1: Psychiatric hospitalizations with MAMP, no cocaine, no opioids
Group 2. Psychiatric hospitalizations with MAMP and cocaine, no opioids
Group 3. Psychiatric hospitalizations with MAMP and opioids, no cocaine
Group 4. Psychiatric hospitalizations with MAMP and opioids and cocaine
Group 5. All MAMP-involved psychiatric hospitalizations
Group 6. Psychiatric hospitalizations with opioids and cocaine, no MAMP
Group 7. Psychiatric hospitalizations, no substances
Group 8. All psychiatric hospitalizations (with and without substances)
Group 1 + 2 + 3 + 4 = Group 5
Group 5 + Group 6 + Group 7 = Group 8
Northeastern states include ME, NH, VT, MA, RI, CT, NY, NJ, PA; Midwestern states include OH, IN, IL, MI, WI, MN, IA, MO, ND, SD, NE, KS; Southern states include DE, MD, DC, VA, WV, NC, SC, GA, FL, KY, TN, AL, MS, AR, LA, OK, TX; Western states include MT, ID, WY, CO, NM, AZ, UT, NV, WA, OR, CA, AK, HI
Trends in Methamphetamine-Involved, Other Substance-Involved, and Nonsubstance-Involved Psychiatric Hospitalization Rates per 100,000 Persons
From Q4 2015 to Q4 2019, methamphetamine-involved psychiatric hospitalization rates (with or without opioids and/or cocaine) (Group 5) significantly increased by 68.3% (4.1; 95% Confidence Interval (CI) 3.5 – 4.6 to 6.9; 95% CI 6.1 – 7.6). Psychiatric hospitalization rates involving opioids and/or cocaine (no methamphetamine) (Group 6) significantly decreased by 22.4% (12.5; 95% CI 11.6 – 13.4 to 9.7; 95% CI 8.9 – 10.4); methamphetamine-involved psychiatric hospitalization rates (without opioids or cocaine) (Group 1) significantly increased by 78.6% (2.8; 95% CI 2.4 – 3.3 to 5.0; 95% CI 4.4 – 5.6). From Q4 2015 to Q4 2019, there was a nonsignificant increase in nonsubstance-involved psychiatric hospitalization rates (Figure 1). We identified similar trends across psychiatric hospitalizations rates with an ICD code for psychosis. In general, psychiatric hospitalizations rates with psychosis were half of all psychiatric hospitalization rates combined (Appendix 2).
Figure 1.


Quarterly weighted rates of substance involved and non-substance involved psychiatric hospitalizations with 95% confidence interval, Q4–2015 to Q4–2019
1a. All MAMP-involved psychiatric hospitalizations
1b. MAMP-involved psychiatric hospitalizations by group
1c. Psychiatric hospitalizations excluding substances
Trends in Methamphetamine-Involved Hospitalization Rates by Sociodemographic Characteristics per 100,000 Persons
The highest methamphetamine-involved psychiatric hospitalization rates overall were noted among patients aged 18 to 30 years old and 31–40 years old (Q3 2019: 2.3; 95% CI 2.0 – 2.6 and Q3 2019: 2.5 per 100,000 persons, 95% CI 2.2 – 2.8), respectively, male patients (Q3 2019: 5.6; 95% CI 4.0 – 5.2), White patients (Q3 2019: 4.8; 95% CI 4.3 – 5.3), Medicaid beneficiaries (Q3 2019: 3.8; 95% CI 3.3 – 4.4), and in the West and South (Q3 2017: 2.6; 95% CI 1.8 to 3.3 and Q3 2019: 2.4, 95% CI 2.0 – 2.8), respectively. From Q4 2015 to Q4 2019, the greatest methamphetamine-involved psychiatric hospitalization rate increases were noted among patients >61 years old (129% [0.07; 95% CI 0.0 – 0.1 to 0.16 per; 95% CI 0.12 – 0.2]); men (74% [2.5 per 100,000 persons; 95% CI 2.1 – 2.8 to 4.3 per; 95% CI 3.8 – 4.8]); Black patients (100% [0. 5; 95% 0.3 – 0.6 to 0.9; 95% CI 0.7 – 1.1]); Medicaid beneficiaries (82% [1.9; 95% CI 1.5 – 2.3 to 3.5; 95% CI 3.1 – 4.0]); and in the Midwest (145% [0.7; 95% CI 0.6 – 0.9 to 1.5; 95% CI 1.5 – 2.2]) (Figure 2a–e). We identified similar trends across methamphetamine-involved psychiatric hospitalizations rates with an ICD code for psychosis. In general, methamphetamine-involved psychiatric hospitalizations rates with psychosis were half of all methamphetamine-involved psychiatric hospitalization rates combined (Appendix 3).
Figure 2.

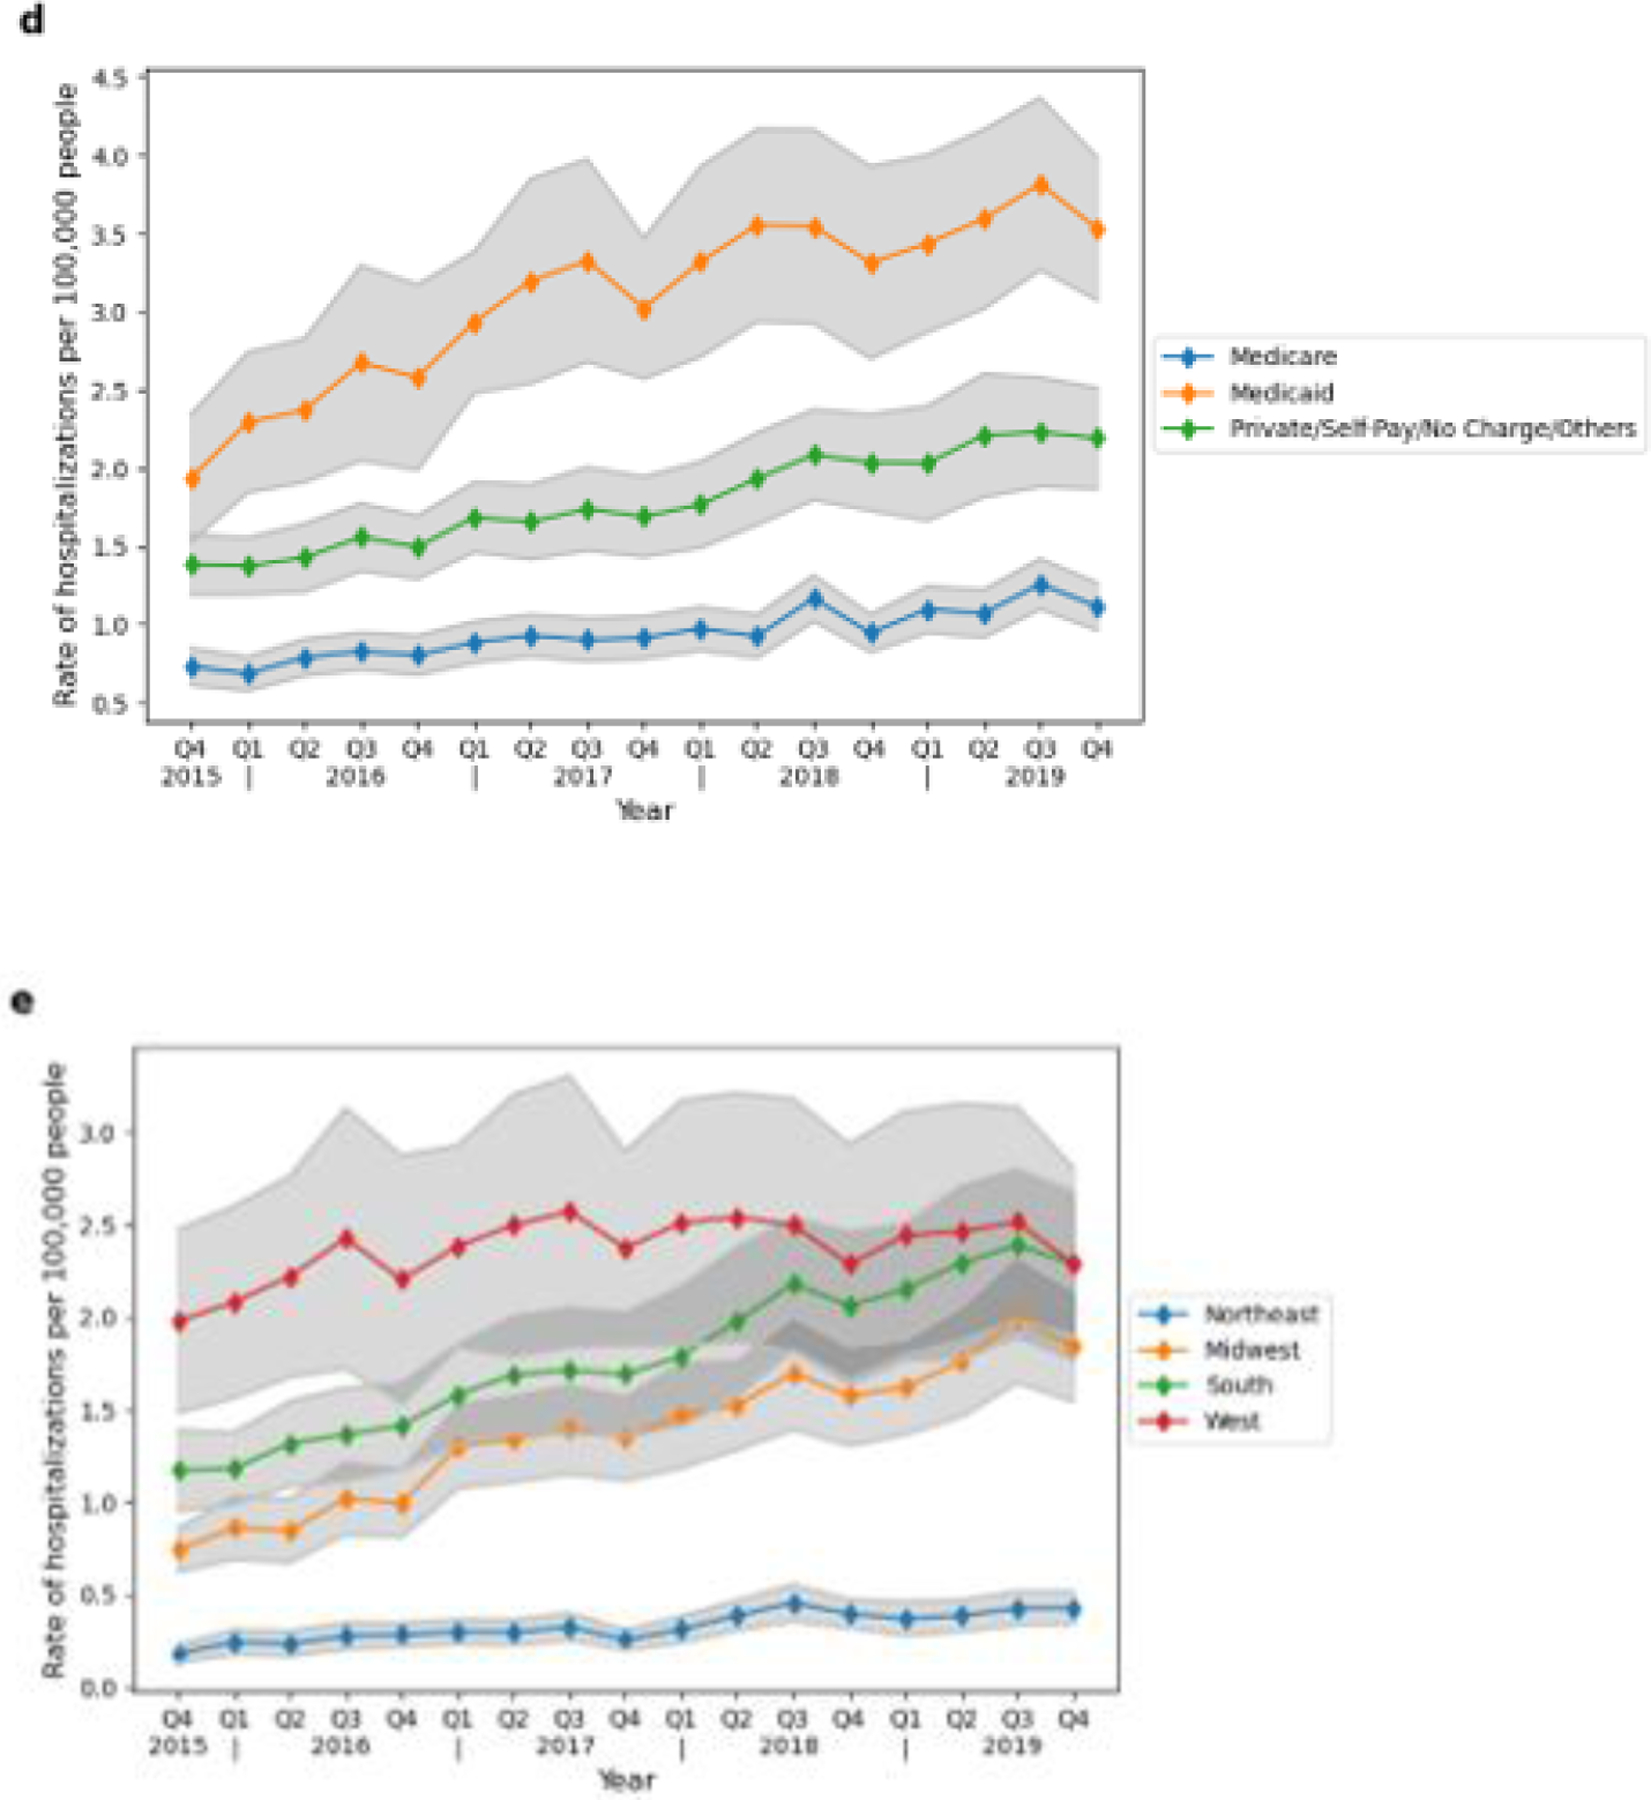
Quarterly weighted quarterly rates of methamphetamine-involved psychiatric hospitalizations by sociodemographic characteristic with 95% CI, Q4–2015 to Q4–2019
2a. Age
2b. Gender
2c. Race
2d. Insurance status
2e. Region
Regional Average Quarterly Percent Change (QPC) in Methamphetamine and Nonsubstance Involved Psychiatric Hospitalization Rates
In the Northeast, the average QPC in the methamphetamine-involved psychiatric hospitalization rate (with or without opioids and/or cocaine) significantly increased in each quarter by 4.6%; 95% CI 3.3% – 6.0% over the study period during Q4 2015 to Q4 2019. For all other U.S. regions, the average QPC for the rate of methamphetamine-involved psychiatric hospitalizations initially increased but then declined during the latter part of the study period relative to the initial years of study. In some cases, the magnitude of the slope decreased, but the slope remained positive, as indicated by a smaller percent change in QPC from one time period to the next. This was the case in the Midwest, South, and West. Alternatively, in the West, the magnitude of the slope decreased to the extent where the slope became negative, as indicated by a negative QPC (Figure 3, Appendix 4). In the Midwest, the average QPC for methamphetamine-involved psychiatric hospitalization rates significantly increased in each quarter by 10.1%; 95% CI 7.1% – 18.7% from Q4 2015 to Q2 2017 and then significantly declined by 3.7%; 95% CI 0.3% – 5.0% in each quarter during Q2 2017 to Q4 2019. In the South, the average QPC for methamphetamine-involved psychiatric hospitalization rates significantly increased by 5.5%; 95% CI 4.7% – 15.0% in each quarter during Q4 2015 to Q3 2018 and then declined by 234%; 95% CI −5.9% – 4.6% in each quarter during Q3 2018 to Q4 2019. In the West, the average QPC for methamphetamine-involved psychiatric hospitalization rates significantly increased by 3.6%; 95% CI 1.9% – 7.7% in each quarter during Q4 2015 to Q2 2017 and then declined by −0.5%; 95% CI −1.9% – 0.3% in each quarter during Q2 2017 to Q4 2019 (Figure 3, Appendix 4).
Figure 3.
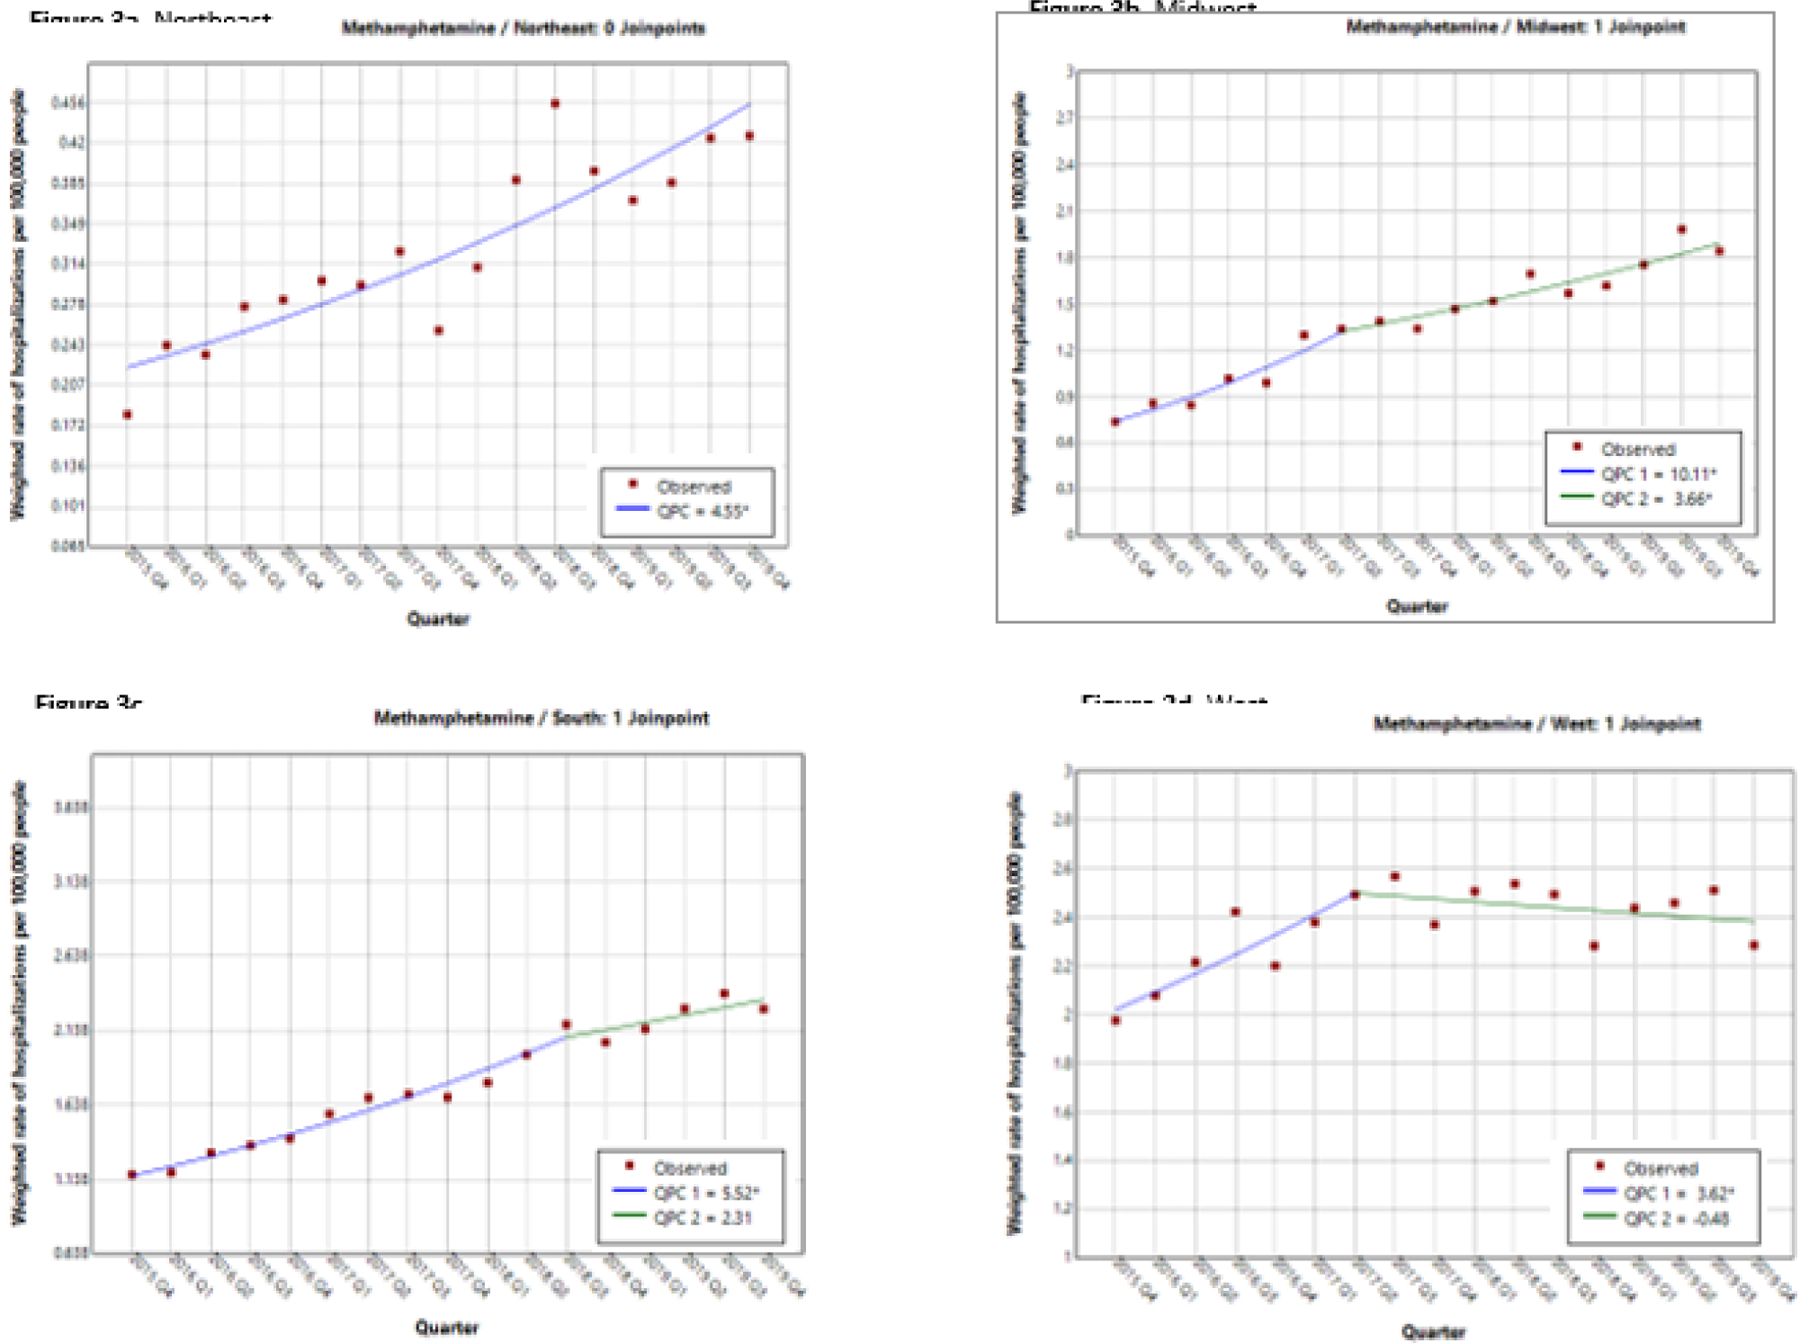
Regional quarterly percent change in the rate of methamphetamine-involved psychiatric hospitalizations with 95% confidence interval, Q4–2015 to Q4–2019
The average QPC in the nonsubstance-involved psychiatric hospitalization rates initially increased in all U.S. regions in each quarter over the study period but then declined in all regions (the QPC became negative) during the latter part of the study period (Figure 4, Appendix 4).
Figure 4.

Regional quarterly percent change in the rate of nonsubstance-involved psychiatric hospitalizations with 95% confidence interval, Q4–2015 to Q4–2019
Discussion
In this nationally representative sample of psychiatric hospitalizations, methamphetamine-involved psychiatric hospitalization rates increased by 68% over the study period likely reflecting national trends of increased methamphetamine use across the U.S. during this time period.11,47,48 In contrast, opioid-involved psychiatric hospitalization rates declined by 22% and nonsubstance-involved psychiatric hospitalization rates remained unchanged. Despite the decline in opioid-involved psychiatric hospitalization rates, the number of opioid-involved psychiatric hospitalizations vastly outnumbered the number of methamphetamine-involved hospitalizations.
Methamphetamine use trends identified among psychiatric hospitalizations are similar to U.S. national survey data demonstrating an annual increase in both self-reported methamphetamine use and self-reported co-use of methamphetamine and opioids from 2015 to 2019.1 Reported reasons for combined use of methamphetamine and heroin or fentanyl includes the management of opioid withdrawal symptoms,49 a strategy to stay awake for personal protection from physical or sexual attack when unhoused,50 to balance out the sedating effects of potent opioids, or to reduce the hypervigilance and agitation experienced with methamphetamine.48,51 Because methamphetamine-related psychiatric symptoms may include psychosis19,27–30 with delusions or paranoia15,20,24 and suicidal ideation,19,25,26 it is understandable that methamphetamine use could contribute to a psychiatric hospitalization. A recent study of 2016 to 2019 NIS data identified that 21% of methamphetamine-involved hospitalizations (not limited to psychiatric hospitalizations) also involved an ICD code for schizophrenia and related psychosis disorders.52 It is notable that the majority of substance-involved psychiatric hospitalizations in this sample involved opioids and/or cocaine without methamphetamine. Another study of national survey data found that almost 65% of Americans with OUD have a comorbid psychiatric illness53 and a systematic review and meta-analysis of over 100,000 people with OUD estimated the prevalence of depression to be 36%, anxiety to be 29%, ADHD to be 21%, and bipolar disorder to be 9%.54 Exacerbations of these psychiatric conditions with any type of substance use, including methamphetamine, among this patient population likely contributed to their hospitalization.54
Importantly, the Joinpoint analyses provide further context regarding the changing landscape of regional methamphetamine use and methamphetamine supply on psychiatric hospitalizations. Our results demonstrate that, while the rate of methamphetamine-involved psychiatric hospitalizations increased over the study period, in most U.S. regions, the magnitude of the rate increase slowed in the latter years of the study period. The inflection points noted in 2016 and 2017, representing a “slowing down” in the rate of methamphetamine-involved hospitalizations, could be attributed to unmeasured factors including regional shifts in the quality, purity, or potency of methamphetamine available for use or fewer people using methamphetamine. As such, our findings do not reject or accept the hypothesis that “new meth” is driving psychiatric hospitalizations across the U.S.
We identified important sociodemographic changes to the methamphetamine use landscape among patients with psychiatric hospitalizations. Black patients experienced the highest rate increase in methamphetamine-involved psychiatric hospitalizations compared to other racial groups. Our findings are similar to overdose death data, when in 2020, Black individuals had the highest rates, and largest percent increase, in overdose mortality compared to white individuals (≈50% vs. ≈26%), respectively.55,56 These disparities have been partially attributed to inequalities in the U.S. healthcare system where Black, Native, and Latinx Americans have less access to addiction treatment, including access to medications for opioid use disorder treatment.57–61
Older patients had the highest rate increase in methamphetamine-involved psychiatric hospitalizations, compared to other age groups. Similar findings were reported from U.S. national survey data, where, between 2015 to 2017 and 2018 to 2019, the prevalence of methamphetamine use disorder among older adults increased 120%.1 Reasons for substance use in later life include unstable living situations, involuntary retirement and loss of occupation, bereavement, and an aging cohort of people who progressed from use of prescribed opioids, to heroin, to fentanyl, and then co-use of fentanyl and methamphetamine.62–64 Older adults are more vulnerable to the effects of substance use, including the exacerbation of chronic medical and mental health conditions, contributing to a hospitalization.65
Medicaid beneficiaries experienced the greatest rate increase in methamphetamine-involved psychiatric hospitalizations compared to Medicare beneficiaries and patients who self-paid or had private health insurance. While access to Medicaid programs is associated with a reduction in adverse events among people with substance use disorders,66 qualification for Medicaid programs, in most states, requires that a person’s gross income is less than 100% to 200% of the federal poverty level.67 These qualification metrics indicate a patient population that is more likely to experience unstable housing, fewer educational and employment opportunities, and segregation, all of which are associated with poorer health outcomes and increased healthcare utilization.61,68
Compared to other U.S. regions, the highest methamphetamine-involved psychiatric hospitalization rates predominated in the West. These findings mirror a decade long regional trend in the West of high methamphetamine-related treatment admissions,69 more prevalent methamphetamine use patterns,70 and high rates of methamphetamine-related deaths, compared to other U.S. regions.5,71 Interestingly, our findings demonstrated that the rate of increase in methamphetamine-involved psychiatric hospitalizations slowed in the West, while the rate of increase in methamphetamine-involved hospitalizations was most marked in the Midwest, with an average quarterly percent increase of 10% in the first half of the study period. In general, the rate of increase in methamphetamine-involved psychiatric hospitalizations slowed in the latter part of the study period for all regions except the Northeast, where the rate of methamphetamine-involved psychiatric hospitalizations increased across the entire study period. Notably, between 2008 to 2017, treatment admissions for methamphetamine in the Midwest, South, and Northeast regions increased from 10 to 13 percent each year reflecting an increase in the number of treatment seeking adults.69
There are limitations to this study. First, diagnostic code documentation is dependent upon a clinician’s or a professional billing specialist’s impression of the clinical picture, which inherently introduces subjectivity. The primary purpose of hospital claims data systems is to record billing information, not to collect accurate data for research purposes. Despite this, administrative data is commonly used to describe the public health impact of substance use in the U.S. population.72–75 Second, as previously noted, diagnostic codes do not distinguish between methamphetamine use and nonmedical use of prescription amphetamines. However, reports of increasing methamphetamine-involved emergency department encounters,76 substance treatment episodes,69 and U.S. national survey reports of increasing methamphetamine use and frequency of use,1 support our postulation that our findings can be attributed to changes in methamphetamine use. Third, HCUP-NIS excludes dedicated psychiatric-specific hospitals which likely leads to under ascertainment bias for substance-involved psychiatric hospitalizations in all settings. By way of example, data from the 2020 National Mental Health Services Survey (N-MHSS) demonstrated that, in 2020, there were 1,752 facilities in the U.S. that provided 24-hour inpatient mental health services.77 Of these, 55% were general hospitals which would be represented in the NIS dataset and these results and 38% were dedicated psychiatric hospitals, which would not be represented in the NIS dataset nor would they be represented in these results.77 Fourth, by not including HCUP-NIS data for years 2020 and 2021, we may be missing important trends, however, the COVID-19 pandemic likely disrupted usual healthcare utilization patterns which could introduce bias into the study results. Finally, due to the complexity of interpreting changes related to the national conversion from ICD-9 to ICD-10 diagnostic codes, we did not conduct a trend analysis of methamphetamine-involved psychiatric hospitalizations using NIS data prior to Q4 2015.
Conclusions
Methamphetamine-involved psychiatric hospitalization rates increased by 68% over the study period, while opioid-involved psychiatric hospitalization rates declined by 22%. These rate increases may be attributed to an increase in supply-side factors increasing methamphetamine’s availability combined with a decrease in methamphetamine prices and increased purity.11,12 Greater resources should be made available to support the treatment of mental and physical health impacts of methamphetamine use. Our findings support the need for linkage of patients to community-based mental health treatment services and harm reduction resources following hospitalization. Expanded access to contingency management programs to support recovery and reduce methamphetamine-associated harms is urgently needed. Collectively, these strategies may reduce the incidence of acute episodes that lead to hospitalization, both reducing the costs and burdens of hospital-based treatment, while signaling improvement in a holistic approach to treating substance use disorders.
Supplementary Material
Highlights.
Methamphetamine (MAMP)-involved psychiatric hospitalization rates increased by 68%
The magnitude of the rate of MAMP-involved hospitalizations declined over time
Opioid-involved psychiatric hospitalization rates decreased by 22%
Opioids vastly predominated in substance-involved psychiatric hospitalizations
Funding:
This work was supported by the National Institutes of Health: The National Institute on Drug Abuse [K08DA049905 to S.L.C.; K01DA051684 to J.A.B.; DP2DA051864 to J.A.B., P.A.S.; K01D056654 to B.dP.].
Role of the Funding Source:
This study was funded by grants from the National Institute on Drug Abuse, which had no direct role in the design, conduct, and analysis of the study or in the decision to submit the manuscript for publication.
Footnotes
Publisher's Disclaimer: This is a PDF file of an unedited manuscript that has been accepted for publication. As a service to our customers we are providing this early version of the manuscript. The manuscript will undergo copyediting, typesetting, and review of the resulting proof before it is published in its final form. Please note that during the production process errors may be discovered which could affect the content, and all legal disclaimers that apply to the journal pertain.
Conflict of Interest: None of the authors have conflicts to declare.
References
- 1.Han B, Compton WM, Jones CM, Einstein EB, Volkow ND. Methamphetamine Use, Methamphetamine Use Disorder, and Associated Overdose Deaths Among US Adults. JAMA Psychiatry. 2021;78(12):1329–1342. doi: 10.1001/jamapsychiatry.2021.2588 [DOI] [PMC free article] [PubMed] [Google Scholar]
- 2.Administration SAaMHS. National Survey on Drug Use and Health (NSDUH) SAMHSA. Accessed January 16, 2023. https://www.samhsa.gov/data/data-we-collect/nsduh-national-survey-drug-use-and-health
- 3.Winkelman TNA, Admon LK, Jennings L, Shippee ND, Richardson CR, Bart G. Evaluation of Amphetamine-Related Hospitalizations and Associated Clinical Outcomes and Costs in the United States. JAMA Netw Open. Oct 5 2018;1(6):e183758. doi: 10.1001/jamanetworkopen.2018.3758 [DOI] [PMC free article] [PubMed] [Google Scholar]
- 4.Han B, Cotto J, Etz K, Einstein EB, Compton WM, Volkow ND. Methamphetamine Overdose Deaths in the US by Sex and Race and Ethnicity. JAMA Psychiatry. 2021;78(5):564–567. doi: 10.1001/jamapsychiatry.2020.4321 [DOI] [PMC free article] [PubMed] [Google Scholar]
- 5.Mattson CL, Tanz LJ, Quinn K, Kariisa M, Patel P, Davis NL. Trends and Geographic Patterns in Drug and Synthetic Opioid Overdose Deaths - United States, 2013–2019. MMWR Morb Mortal Wkly Rep. Feb 12 2021;70(6):202–207. doi: 10.15585/mmwr.mm7006a4 [DOI] [PMC free article] [PubMed] [Google Scholar]
- 6.Ciccarone D, Shoptaw S. Understanding Stimulant Use and Use Disorders in a New Era. Med Clin North Am. Jan 2022;106(1):81–97. doi: 10.1016/j.mcna.2021.08.010 [DOI] [PMC free article] [PubMed] [Google Scholar]
- 7.Friedman J, Shover CL. Charting the fourth wave: Geographic, temporal, race/ethnicity and demographic trends in polysubstance fentanyl overdose deaths in the United States, 2010–2021. Addiction. Sep 13 2023;doi: 10.1111/add.16318 [DOI] [PubMed] [Google Scholar]
- 8.Shearer RD, Howell BA, Bart G, Winkelman TNA. Substance use patterns and health profiles among US adults who use opioids, methamphetamine, or both, 2015–2018. Drug Alcohol Depend. Sep 1 2020;214:108162. doi: 10.1016/j.drugalcdep.2020.108162 [DOI] [PMC free article] [PubMed] [Google Scholar]
- 9.Ronan MV, Herzig SJ. Hospitalizations related to opioid abuse/dependence and associated serious infections increased sharply, 2002–12. Health Affairs. 2016;35(5):832–837. [DOI] [PMC free article] [PubMed] [Google Scholar]
- 10.Alkhouli M, Alqahtani F, Alhajji M, Berzingi CO, Sohail MR. Clinical and economic burden of hospitalizations for infective endocarditis in the United States. Elsevier; 2020:858–866. [DOI] [PubMed] [Google Scholar]
- 11.Ciccarone D The rise of illicit fentanyls, stimulants and the fourth wave of the opioid overdose crisis. Current Opinion in Psychiatry. 2021;34(4):344–350. doi: 10.1097/yco.0000000000000717 [DOI] [PMC free article] [PubMed] [Google Scholar]
- 12.Administration DE. 2020 National Drug Threat Assessment. 2021. https://www.dea.gov/sites/default/files/2021-02/DIR-008-21%202020%20National%20Drug%20Threat%20Assessment_WEB.pdf
- 13.Quinones S ‘I Don’t Know That I Would Even Call It Meth Anymore’. The Atlantic. online2021. [Google Scholar]
- 14.Lecomte T, Dumais A, Dugré JR, Potvin S. The prevalence of substance-induced psychotic disorder in methamphetamine misusers: A meta-analysis. Psychiatry Research. 2018/10/01/ 2018;268:189–192. doi: 10.1016/j.psychres.2018.05.033 [DOI] [PubMed] [Google Scholar]
- 15.Zweben JE, Cohen JB, Christian D, et al. Psychiatric symptoms in methamphetamine users. Am J Addict. Mar-Apr 2004;13(2):181–90. doi: 10.1080/10550490490436055 [DOI] [PubMed] [Google Scholar]
- 16.Glasner-Edwards S, Mooney LJ, Marinelli-Casey P, Hillhouse M, Ang A, Rawson R. Identifying methamphetamine users at risk for major depressive disorder: findings from the methamphetamine treatment project at three-year follow-up. Am J Addict. Mar-Apr 2008;17(2):99–102. doi: 10.1080/10550490701861110 [DOI] [PubMed] [Google Scholar]
- 17.Hellem TL, Lundberg KJ, Renshaw PF. A review of treatment options for co-occurring methamphetamine use disorders and depression. J Addict Nurs. Jan-Mar 2015;26(1):14–23; quiz E1. doi: 10.1097/jan.0000000000000058 [DOI] [PMC free article] [PubMed] [Google Scholar]
- 18.McKetin R, Lubman DI, Lee NM, Ross JE, Slade TN. Major depression among methamphetamine users entering drug treatment programs. Med J Aust. Aug 1 2011;195(3):S51–5. doi: 10.5694/j.1326-5377.2011.tb03266.x [DOI] [PubMed] [Google Scholar]
- 19.Marshall BD, Werb D. Health outcomes associated with methamphetamine use among young people: a systematic review. Addiction. 2010;105(6):991–1002. [DOI] [PubMed] [Google Scholar]
- 20.Salo R, Flower K, Kielstein A, Leamon MH, Nordahl TE, Galloway GP. Psychiatric comorbidity in methamphetamine dependence. Psychiatry Res. Apr 30 2011;186(2–3):356–61. doi: 10.1016/j.psychres.2010.09.014 [DOI] [PMC free article] [PubMed] [Google Scholar]
- 21.Sulaiman AH, Said MA, Habil MH, et al. The risk and associated factors of methamphetamine psychosis in methamphetamine-dependent patients in Malaysia. Comprehensive Psychiatry. 2014/01/01/ 2014;55:S89–S94. doi: 10.1016/j.comppsych.2013.01.003 [DOI] [PubMed] [Google Scholar]
- 22.Akindipe T, Wilson D, Stein DJ. Psychiatric disorders in individuals with methamphetamine dependence: prevalence and risk factors. Metab Brain Dis. Jun 2014;29(2):351–7. doi: 10.1007/s11011-014-9496-5 [DOI] [PubMed] [Google Scholar]
- 23.Glasner-Edwards S, Mooney LJ. Methamphetamine psychosis: epidemiology and management. CNS Drugs. Dec 2014;28(12):1115–26. doi: 10.1007/s40263-014-0209-8 [DOI] [PMC free article] [PubMed] [Google Scholar]
- 24.Leamon MH, Flower K, Salo RE, Nordahl TE, Kranzler HR, Galloway GP. Methamphetamine and paranoia: the methamphetamine experience questionnaire. The American Journal on Addictions. 2010;19(2):155–168. [DOI] [PMC free article] [PubMed] [Google Scholar]
- 25.Glasner-Edwards S, Mooney LJ, Marinelli-Casey P, Hillhouse M, Ang A, Rawson R. Risk factors for suicide attempts in methamphetamine-dependent patients. Am J Addict. Jan-Feb 2008;17(1):24–7. doi: 10.1080/10550490701756070 [DOI] [PubMed] [Google Scholar]
- 26.Kalayasiri R, Mutirangura A, Verachai V, Gelernter J, Malison RT. Risk factors for methamphetamine-induced paranoia and latency of symptom onset in a Thai drug treatment cohort. Asian Biomedicine. 2009;3(6):635–643. [Google Scholar]
- 27.McKetin R, McLaren J, Lubman DI, Hides L. The prevalence of psychotic symptoms among methamphetamine users. Addiction. Oct 2006;101(10):1473–8. doi: 10.1111/j.1360-0443.2006.01496.x [DOI] [PubMed] [Google Scholar]
- 28.Chen CK, Lin SK, Sham PC, et al. Pre-morbid characteristics and co-morbidity of methamphetamine users with and without psychosis. Psychol Med. Nov 2003;33(8):1407–14. doi: 10.1017/s0033291703008353 [DOI] [PubMed] [Google Scholar]
- 29.McKetin R, Hickey K, Devlin K, Lawrence K. The risk of psychotic symptoms associated with recreational methamphetamine use. Drug Alcohol Rev. Jul 2010;29(4):358–63. doi: 10.1111/j.1465-3362.2009.00160.x [DOI] [PubMed] [Google Scholar]
- 30.Batki SL, Harris DS. Quantitative drug levels in stimulant psychosis: relationship to symptom severity, catecholamines and hyperkinesia. Am J Addict. Oct-Dec 2004;13(5):461–70. doi: 10.1080/10550490490512834 [DOI] [PubMed] [Google Scholar]
- 31.Quality AfHRa. Overview of the National (Nationwide) Inpatient Sample (NIS). Agency for Healthcare Research and Quality. June 17, 2022. Accessed June 17, 2022. https://www.hcup-us.ahrq.gov/nisoverview.jsp#about [Google Scholar]
- 32.Liu JB, Kelz RR. Types of Hospitals in the United States. JAMA. 2018;320(10):1074–1074. doi: 10.1001/jama.2018.9471 [DOI] [PubMed] [Google Scholar]
- 33.Administration SAaMHS. National Mental Health Services Survey (N-MHSS): 2019. Data on Mental Health Treatment Facilities. 2020. Accessed August 1, 2022. https://www.datafiles.samhsa.gov/sites/default/files/field-uploads-protected/studies/N-MHSS-2019/N-MHSS-2019-datasets/N-MHSS-2019-DS0001/N-MHSS-2019-DS0001-info/N-MHSS-2019-DS0001-info-codebook.pdf
- 34.Administration SAaMHS. Treatment Episode Data Set (TEDS). Substance Abuse and Mental Health Services Administration. Updated 2022. Accessed June 17, 2022. https://www.samhsa.gov/data/data-we-collect/teds-treatment-episode-data-set [Google Scholar]
- 35.Prevention CfDCa. Bridged-Race Population Estimates – Data Files and Documentation. Accessed September 1, 2023. https://www.cdc.gov/nchs/nvss/bridged_race/data_documentation.htm
- 36.Prevention CfDCa. International Classification of Diseases, Tenth Revision, Clinical Modification (ICD-10CM). National Center for Health Statistics. Updated October 17, 2022. Accessed January 16, 2023. https://www.cdc.gov/nchs/icd/icd-10-cm.htm [Google Scholar]
- 37.(CMS) CfMMS. About the Chronic Conditions Warehouse. Accessed January 16, 2023. https://www2.ccwdata.org/web/guest/about-ccw
- 38.(CMS) CfMMS. Chronic Conditions Data Warehouse Updated 2023. Accessed January 16, 2023. https://www2.ccwdata.org/web/guest/condition-categories-other
- 39.Shearer RD, Shippee ND, Winkelman TNA. Characterizing trends in methamphetamine-related health care use when there is no ICD code for “methamphetamine use disorder”. Journal of Substance Abuse Treatment. 2021/08/01/2021;127:108369. doi: 10.1016/j.jsat.2021.108369 [DOI] [PMC free article] [PubMed] [Google Scholar]
- 40.Statistics NCfH. Census Bureau: Four geographic regions and nine divisions of the United States. 2019.
- 41.ML B. 2015 Healthcare Cost and Utilization Project (HCUP) National Inpatient Sample: Change inStructure and Data Elements Caused by Transition to ICD-10-CM/PCS. 2017. November 13, 2017. Accessed June 17, 2022. https://hcup-us.ahrq.gov/db/nation/nis/2015HCUPNationalInpatientSample.pdf
- 42.Cassell K, Zipfel CM, Bansal S, Weinberger DM. Trends in non-COVID-19 hospitalizations prior to and during the COVID-19 pandemic period, United States, 2017–2021. Nat Commun. Oct 8 2022;13(1):5930. doi: 10.1038/s41467-022-33686-y [DOI] [PMC free article] [PubMed] [Google Scholar]
- 43.The Strengthening the Reporting of Observational Studies in Epidemiology (STROBE) Statement: guidelines for reporting observational studies. Updated August 2, 2022. Accessed January 16, 2023. https://www.equator-network.org/wp-content/uploads/2015/10/STROBE_checklist_v4_cross-sectional.pdf
- 44.National Cancer Institute DoCCPS, Surveillance Research Program. Number of Jointpoints. Accessed September 29, 2023. https://surveillance.cancer.gov/help/joinpoint/setting-parameters/method-and-parameters-tab/number-of-joinpoints
- 45.Kim HJ, Fay MP, Feuer EJ, Midthune DN. Permutation tests for joinpoint regression with applications to cancer rates. Stat Med. Feb 15 2000;19(3):335–51. doi: [DOI] [PubMed] [Google Scholar]
- 46.Quality AfHRa. Requirements for Publishing with HCUP Data. Updated January 11, 2023. Accessed April 9, 2024. https://hcup-us.ahrq.gov/db/publishing.jsp
- 47.Palamar JJ, Han BH, Keyes KM. Trends in characteristics of individuals who use methamphetamine in the United States, 2015–2018. Drug and Alcohol Dependence. 2020/08/01/ 2020;213:108089. doi: 10.1016/j.drugalcdep.2020.108089 [DOI] [PMC free article] [PubMed] [Google Scholar]
- 48.Ondocsin J, Holm N, Mars SG, Ciccarone D. The motives and methods of methamphetamine and ‘heroin’ co-use in West Virginia. Harm Reduct J. Jul 12 2023;20(1):88. doi: 10.1186/s12954-023-00816-8 [DOI] [PMC free article] [PubMed] [Google Scholar]
- 49.Silverstein SM, Daniulaityte R, Getz K, Zule W. “It’s Crazy What Meth Can Help You Do”: Lay Beliefs, Practices, and Experiences of Using Methamphetamine to Self-Treat Symptoms of Opioid Withdrawal. Subst Use Misuse. 2021;56(11):1687–1696. doi: 10.1080/10826084.2021.1949612 [DOI] [PubMed] [Google Scholar]
- 50.Bungay V, Malchy L, Buxton JA, Johnson J, MacPherson D, Rosenfeld T. Life with jib: A snapshot of street youth’s use of crystal methamphetamine. Addiction Research & Theory. 2006/01/01 2006;14(3):235–251. doi: 10.1080/16066350500270901 [DOI] [Google Scholar]
- 51.Ivsins A, Fleming T, Barker A, et al. The practice and embodiment of “goofballs”: A qualitative study exploring the co-injection of methamphetamines and opioids. International Journal of Drug Policy. 2022/09/01/2022;107:103791. doi: 10.1016/j.drugpo.2022.103791 [DOI] [PMC free article] [PubMed] [Google Scholar]
- 52.Shearer RD, Shippee ND, Virnig BA, Beebe TJ, Winkelman TNA. Characteristics and co-morbidities associated with hospital discharges for opioid and methamphetamine co-use, United States 2016–2019. Drug and Alcohol Dependence Reports. 2024/03/01/ 2024;10:100219. doi: 10.1016/j.dadr.2024.100219 [DOI] [PMC free article] [PubMed] [Google Scholar]
- 53.Jones CM, McCance-Katz EF. Co-occurring substance use and mental disorders among adults with opioid use disorder. Drug Alcohol Depend. Apr 1 2019;197:78–82. doi: 10.1016/j.drugalcdep.2018.12.030 [DOI] [PubMed] [Google Scholar]
- 54.Santo T Jr., Campbell G, Gisev N, et al. Prevalence of mental disorders among people with opioid use disorder: A systematic review and meta-analysis. Drug Alcohol Depend. Sep 1 2022;238:109551. doi: 10.1016/j.drugalcdep.2022.109551 [DOI] [PubMed] [Google Scholar]
- 55.Friedman JR, Hansen H. Evaluation of Increases in Drug Overdose Mortality Rates in the US by Race and Ethnicity Before and During the COVID-19 Pandemic. JAMA Psychiatry. 2022;79(4):379–381. doi: 10.1001/jamapsychiatry.2022.0004 [DOI] [PMC free article] [PubMed] [Google Scholar]
- 56.Fujita-Imazu S, Xie J, Dhungel B, et al. Evolving trends in drug overdose mortality in the USA from 2000 to 2020: an age-period-cohort analysis. EClinicalMedicine. Jul 2023;61:102079. doi: 10.1016/j.eclinm.2023.102079 [DOI] [PMC free article] [PubMed] [Google Scholar]
- 57.Lagisetty PA, Ross R, Bohnert A, Clay M, Maust DT. Buprenorphine Treatment Divide by Race/Ethnicity and Payment. JAMA Psychiatry. 2019;76(9):979–981. doi: 10.1001/jamapsychiatry.2019.0876 [DOI] [PMC free article] [PubMed] [Google Scholar]
- 58.Sahker E, Pro G, Sakata M, Furukawa TA. Substance use improvement depends on Race/Ethnicity: Outpatient treatment disparities observed in a large US national sample. Drug Alcohol Depend. Aug 1 2020;213:108087. doi: 10.1016/j.drugalcdep.2020.108087 [DOI] [PubMed] [Google Scholar]
- 59.Quality CfBHSa. Racial/ethnic differences in substance use, substance use disorders, and substance use treatment utilization among people aged 12 or older (2015–2019). 2021. Publication No PEP21-07-01-001. Accessed August 1, 2022. https://www.samhsa.gov/data/report/racialethnic-differences-substance-use
- 60.Goedel WC, Shapiro A, Cerdá M, Tsai JW, Hadland SE, Marshall BDL. Association of Racial/Ethnic Segregation With Treatment Capacity for Opioid Use Disorder in Counties in the United States. JAMA Netw Open. Apr 1 2020;3(4):e203711. doi: 10.1001/jamanetworkopen.2020.3711 [DOI] [PMC free article] [PubMed] [Google Scholar]
- 61.Friedman J, Hansen H. Far From a “White Problem”: Responding to the overdose crisis as a racial justice issue. American Public Health Association; 2022. p. S30–S32. [DOI] [PMC free article] [PubMed] [Google Scholar]
- 62.Dupree LW, Schonfeld L. Substance abuse relapse prevention for older adults: A group treatment approach. US Department of Health and Human Services, Substance Abuse and Mental; …; 2005. [Google Scholar]
- 63.Bacharach SB, Bamberger PA, Cohen A, Doveh E. Retirement, social support, and drinking behavior: a cohort analysis of males with a baseline history of problem drinking. Journal of Drug Issues. 2007;37(3):525–548. [Google Scholar]
- 64.Kuerbis A, Sacco P, Blazer DG, Moore AA. Substance abuse among older adults. Clin Geriatr Med. Aug 2014;30(3):629–54. doi: 10.1016/j.cger.2014.04.008 [DOI] [PMC free article] [PubMed] [Google Scholar]
- 65.Choi NG, DiNitto DM, Marti CN, Choi BY. Associations of Mental Health and Substance Use Disorders With Presenting Problems and Outcomes in Older Adults’ Emergency Department Visits. Acad Emerg Med. Nov 2015;22(11):1316–26. doi: 10.1111/acem.12803 [DOI] [PubMed] [Google Scholar]
- 66.Snider JT, Duncan ME, Gore MR, et al. Association Between State Medicaid Eligibility Thresholds and Deaths Due to Substance Use Disorders. JAMA Network Open. 2019;2(4):e193056–e193056. doi: 10.1001/jamanetworkopen.2019.3056 [DOI] [PMC free article] [PubMed] [Google Scholar]
- 67.Suh E. What is Medicaid and am I eligible for it? https://www.policygenius.com/health-insurance/medicaid/#what-is-medicaid.
- 68.Health CfMaMSOoM. CMS Framework for Health Equity 2022–2032. 2023. https://www.cms.gov/files/document/cms-framework-health-equity-2022.pdf
- 69.Jones CM, Olsen EO, O’Donnell J, Mustaquim D. Resurgent Methamphetamine Use at Treatment Admission in the United States, 2008–2017. Am J Public Health. Apr 2020;110(4):509–516. doi: 10.2105/ajph.2019.305527 [DOI] [PMC free article] [PubMed] [Google Scholar]
- 70.Jones CM, Compton WM, Mustaquim D. Patterns and characteristics of methamphetamine use among adults—United States, 2015–2018. Morbidity and Mortality Weekly Report. 2020;69(12):317. [DOI] [PMC free article] [PubMed] [Google Scholar]
- 71.Calcaterra S, Binswanger IA. National trends in psychostimulant-related deaths: 1999–2009. Subst Abus. 2013;34(2):129–36. doi: 10.1080/08897077.2012.726959 [DOI] [PMC free article] [PubMed] [Google Scholar]
- 72.Rowe CL, Santos G-M, Kornbluh W, Bhardwaj S, Faul M, Coffin PO. Using ICD-10-CM codes to detect illicit substance use: A comparison with retrospective self-report. Drug and Alcohol Dependence. 2021/04/01/2021;221:108537. doi: 10.1016/j.drugalcdep.2021.108537 [DOI] [PMC free article] [PubMed] [Google Scholar]
- 73.Jones CM, Houry D, Han B, Baldwin G, Vivolo-Kantor A, Compton WM. Methamphetamine use in the United States: epidemiological update and implications for prevention, treatment, and harm reduction. Annals of the New York Academy of Sciences. 2021; [DOI] [PMC free article] [PubMed] [Google Scholar]
- 74.Dickson SD, Thomas IC, Bhatia HS, et al. Methamphetamine-Associated Heart Failure Hospitalizations Across the United States: Geographic and Social Disparities. Journal of the American Heart Association. 2021;10(16):e018370. [DOI] [PMC free article] [PubMed] [Google Scholar]
- 75.Ciccarone D, Unick GJ, Cohen JK, Mars SG, Rosenblum D. Nationwide increase in hospitalizations for heroin-related soft tissue infections: Associations with structural market conditions. Drug Alcohol Depend. Jun 1 2016;163:126–33. doi: 10.1016/j.drugalcdep.2016.04.009 [DOI] [PMC free article] [PubMed] [Google Scholar]
- 76.Mattson ME. Emergency department visits involving methamphetamine: 2007 to 2011. The CBHSQ report. 2014; [PubMed] [Google Scholar]
- 77.Administration SAaMHS. National Mental Health Services Survey (N-MHSS): 2020. Data on Mental Health Treatment Facilities. 2021.
Associated Data
This section collects any data citations, data availability statements, or supplementary materials included in this article.