Abstract
Since the COVID-19 pandemic, the interest in RNA-lipid nanoparticle (LNP) based drug products has increased drastically. While one RNA-LNP drug product, Onpattro, was already on the market in 2018, high volume manufacturing was only initiated end of 2020 with the approval of the mRNA-LNP vaccines, Comirnaty and Spikevax. As such, deep product knowledge for RNA-LNPs is continuously increasing. In this article the effect of large-scale mixing and lab-scale shaking on mRNA-LNP drug product quality characteristics is investigated. It is shown that mixing and shaking can have a profound impact on both LNP size distribution and mRNA encapsulation, suggesting a direct correlation between both quality characteristics, and further supported by a proposed underlying mechanism. An in-depth investigation of different drug product (DP) presentations reveals a consistent effect of headspace volume and LNP content on the shaking stress sensitivity. Results reported in this study are of utter importance for both small- and large-scale manufacturers but also for care givers and patients using these products.
Subject terms: Pharmaceutics, RNA, Nanoscale biophysics, Nanoparticles
Introduction
The COVID-19 pandemic demanded enormous supplies of vaccines, leading to the rapid development of the mRNA-LNP drug products Comirnaty and Spikevax1–3. While these approved vaccines demonstrated their efficacy and safety, the rapid development and scale-up posed various challenges due to limited product and process knowledge. This knowledge has increased substantially over the last years, with a rather one-sided focus on mRNA stability, investigating the impact of lipids4, buffers5, multivalent ions6, RNases7, and temperature and pH8, while factors influencing the LNP stability have captured less attention so far. Nevertheless, the structure and stability of the LNPs is of utmost importance due to their influence on mRNA delivery and therefore also the vaccine efficacy9.
The RNA-LNP drug products currently on the market (Onpattro, Comirnaty and Spikevax) contain 4 types of lipids. Ionizable cationic lipids interact with the negatively charged RNA backbone under acidic conditions, encapsulating the RNA, and have a prominent function in helping with endosomal escape. Two types of helper lipids, a phospholipid and cholesterol, increase the LNP stability and intracellular delivery10. Finally, PEGylated lipids provide steric hindrance, combat aggregation, and by doing so, increase circulation time and impact cellular uptake1–3. The stability provided by PEGylated lipids during formulation persists during long term storage, while LNP formulations without these lipids experience an increase in polydispersity10.
The impact of stress forces on mRNA-LNP drug product by mixing and shaking has not been extensively studied so far, firstly due to limited large-scale production experience, and secondly due to predominant storage of current formulations at freezing temperatures. Nevertheless, understanding mRNA-LNP product stability under these stress conditions is very important in relation to the manufacturing process and subsequent liquid sample handling. Previous research has shown an impact of flicking/tapping, manual shaking and vortexing of filled vials towards LNP size, polydispersity index (PDI) and mRNA encapsulation, with emphasis on correct vial handling11–13. An initial hypothesis for air–liquid interfacial stress as driver for simultaneous LNP size increase and mRNA encapsulation decrease was also set forth, using an orbital shaker and a vortex instrument14.
In this manuscript the impact of mixing and shaking on mRNA-LNP quality characteristics is investigated, with a unique focus on shifts in LNP size distribution which can be linked with mRNA encapsulation. Relevant watchouts of a large-scale mixing study are used as a driver for a more detailed lab-scale study on different DP presentations in vials performing vertical shaking. By investigating the impact of headspace volume and LNP content on LNP stress sensitivity, an underlying mechanism is proposed and strengthened.
Results and discussion
Impact of mixing on mRNA-LNP characteristics
Mixing occurs at multiple stages of the mRNA-LNP manufacturing process, mainly to ensure a homogeneous temperature and mRNA concentration during formulation, and consequently good drug product quality. Therefore, the impact of excessive mixing is investigated using a 1600 L commercial manufacturing vessel. A comparison is made between a low fill volume with low mixing speed combination and a high fill volume with high mixing speed combination. Details on the set-up are provided in Figure S1 of the supplementary material.
Impact of low volume mixing
In a first experiment, the 1600 L vessel is filled with a low volume (135 L) of homogeneous mRNA-LNP drug product, with the magnetic mixer minimally submerged, having the impellers directly below the liquid surface (see figure S1 in the supplementary material). The drug product bulk is actively cooled at 2–8 °C during 10 days of continuous mixing at 130 RPM.
A drastic and consistent linear decrease in mRNA encapsulation is observed with increasing mixing time (see Fig. 1). Regardless of this drop in mRNA encapsulation, the mRNA integrity is not impacted during the 10 days of continuous mixing. The latter can be explained by enhanced mRNA stability against hydrolysis due to the active cooling at 2–8 °C and the use of a sterile vessel, DP bulk and sampling manifold. Visual inspection during mixing shows considerable disturbances of the liquid surface, inducing air entrainment, due to the low depth of the mixer in the liquid volume (see Figure S2(a) in the supplementary material).
Fig. 1.
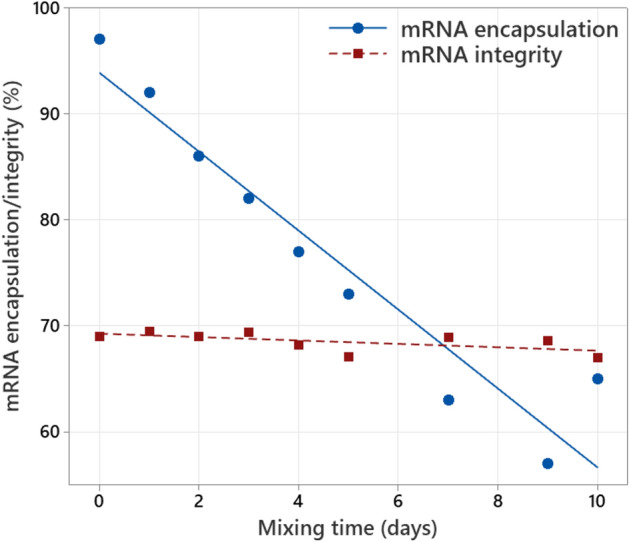
mRNA encapsulation (measured with Ribogreen) and mRNA integrity (measured with capillary gel electrophoresis) as function of mixing time for low volume mixing at 130 RPM in a 1600 L vessel. mRNA concentration is 0.1 mg/mL.
The fast decrease in mRNA encapsulation points towards a potential structural re-arrangement of the LNPs, which is further evaluated with NanoFlowSizer measurements. The particle size distribution at the start of mixing is unimodal with an average LNP size of approximately 60 nm (see Fig. 2). This unimodal distribution transforms into a bimodal distribution after one day of mixing, and further on completely shifts to a wider unimodal distribution after 4 days of mixing with an average particle size around 200 nm. The simultaneous linear drop in mRNA encapsulation and structural transformation in particle size distribution has not previously been described in the literature to the best of our knowledge. From commercial manufacturing knowledge, a hold of 10 days at 2–8 °C without mixing has no impact on these product characteristics.
Fig. 2.
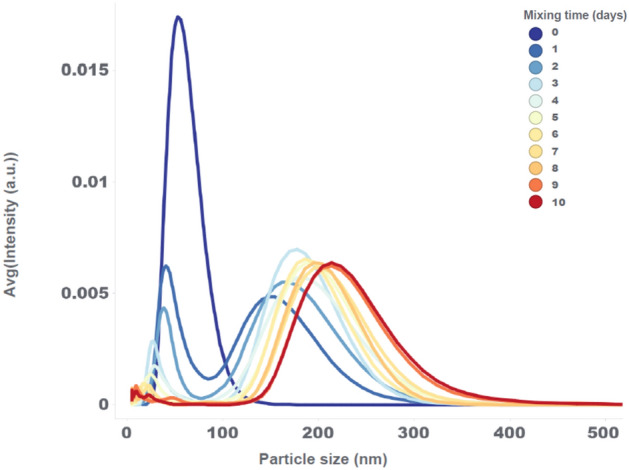
Particle size distribution of the low volume mixing experiment at 130 RPM, measured with the NanoFlowSizer at different mixing times.
As mentioned earlier, the combination of low fill volume and 130 RPM mixing speed develops considerable liquid surface disturbances, resulting in air entrainment. To investigate a possible link between this air entrainment and the observed transformation in particle size distribution, the experiment is repeated with a mixing speed of 40 RPM, almost completely removing the interaction with air as the liquid surface remains stable (no visible formation of turbulence/vortex/foam) (see Figure S2(b) in the supplementary material). In this case, the particle size distribution remains unimodal during the complete 10 days of mixing, where small variations in distribution profiles can possibly be linked to the sampling and/or measurement method (see Figure S3 in the supplementary material). This result suggests a correlation between air entrainment and the observed changes in particle size distribution.
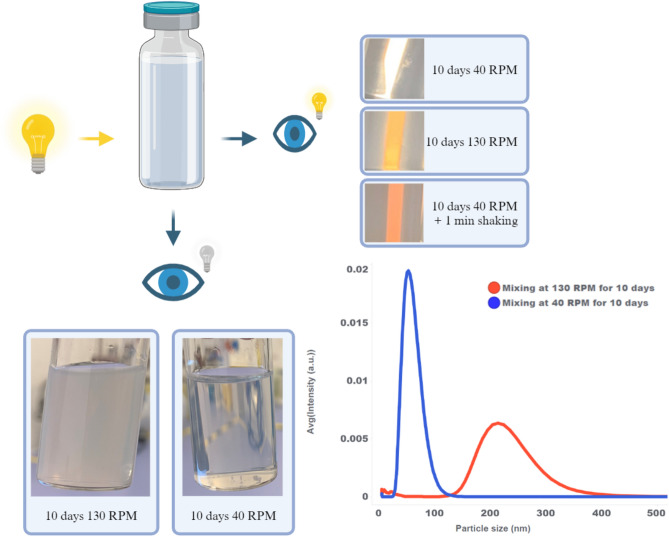
A straightforward visual inspection can be used as supplementary technique to assess the impact of mixing on the mRNA-LNP drug product. A large difference is observed between DP bulk mixed for 10 days at 130 and 40 RPM, with the 130 RPM sample being very opaque compared to the transparent 40 RPM sample (see Fig. 3 bottom left). This observation can be explained by the transfer to a larger sized particle distribution at 130 RPM (see Fig. 3 bottom right), shifting the dominant scattering regime from Rayleigh to Mie scattering, resulting in a more wavelength independent scattering. When inspecting the samples in front of a white light source, the difference can be observed by a change in light color, or change in wavelengths, passing through the sample without scattering (see Fig. 3 top right). The 40 RPM sample allows for passage of almost all the light, giving a white color, while the 130 RPM sample has increased scattering of smaller wavelengths, letting through only higher wavelengths, and therefore transmitting a yellow light. As an additional control the 40 RPM sample is vigorously shaken for one minute resulting in even more scattering, for increasing wavelengths, changing the color of passing light to red. Again, the crossover from transparent to opaque, or from white to red (using a white light source), is a visual indication for changes in particle size distribution, possibly caused by air entrainment. Supplementary to more sensitive dynamic light scattering techniques, this visual inspection can be used as a quick and efficient check for possible air entrainment during formulation or after sample handling of mRNA-LNP drug products.
Fig. 3.
Impact of mixing and shaking observed by visual inspection and linked with particle size distribution. Figure partially created with BioRender.com.
Impact of high volume mixing
To further investigate the influence of liquid surface disturbances and corresponding air entrainment, the mixing experiment is repeated with a high fill volume of 741 L drug product and an increased mixing speed of 198 RPM (see Figure S1 in supplementary material). In this case, the mRNA encapsulation drop during 10 days of mixing is much smaller compared to the low volume experiment at 130 RPM (see Fig. 4 and Fig. 1). The mRNA integrity is not affected during the complete mixing experiment as observed and explained earlier for the low volume mixing. The reduced drop in mRNA encapsulation at a higher mixing speed of 198 RPM, instead of 130 RPM, clearly shows negligible effect of mixing shear in this respect, and on the other hand highlights the impact of fill volume and corresponding air entrainment. Increasing the fill volume expands the distance between the mixer impellers and the liquid surface, minimizing disturbance of the liquid surface. This result suggests a possible link between this air entrainment and the observed mRNA encapsulation drop.
Fig. 4.
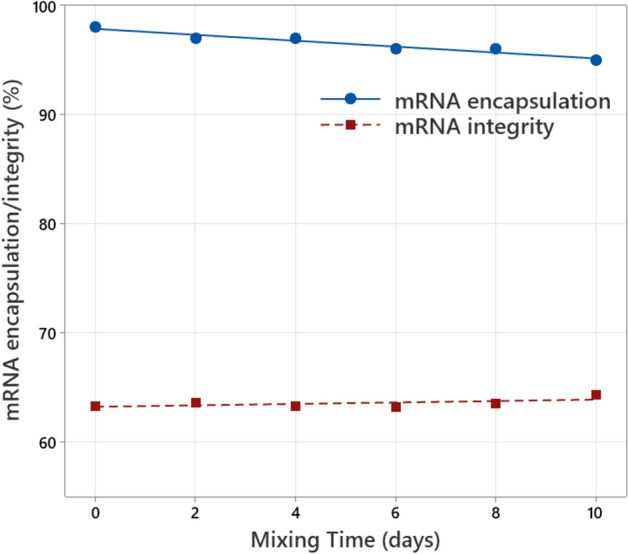
mRNA encapsulation (measured with Ribogreen) and mRNA integrity (measured with capillary gel electrophoresis) as function of the mixing time for high volume mixing at 198 RPM in a 1600 L vessel. mRNA concentration is 0.1 mg/mL.
The particle size distribution at the start of mixing is unimodal with an average LNP size of approximately 60 nm (see Fig. 5). This unimodal distribution slowly broadens, tailing to larger LNP sizes, and gradually transforms into an emerging bimodal distribution at the end of 10 days of continuous mixing. As with the mRNA encapsulation drop, also for the transition of particle size distribution a similar evolution is observed as with the small fill volume experiment, but at a much slower pace. The DP characteristics of these high fill volume samples at 10 days of mixing do not reach the situation of the low fill volume samples at 1 day of mixing. These results once again indicate a correlation between air entrainment and the simultaneous drop in mRNA encapsulation and transformation in particle size distribution.
Fig. 5.
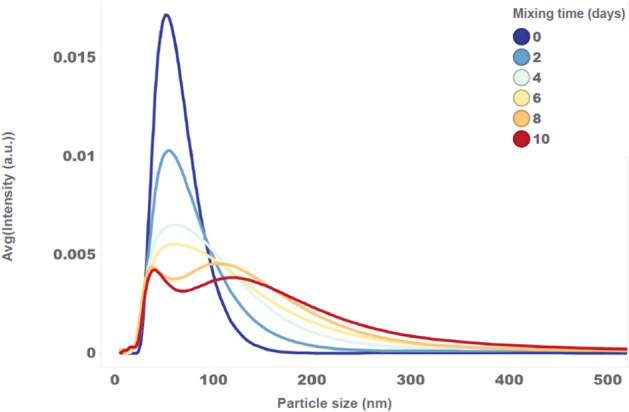
Particle size distributions of the high volume mixing experiment at 198 RPM, measured with the NanoFlowSizer at different mixing times.
In addition, samples from each mixing time point are put on stability at room temperature showing no additional impact on mRNA encapsulation nor particle size distribution, but only an expected mRNA integrity decrease due to temperature accelerated mRNA hydrolysis (see Figure S4 and S5 in supplementary material).
Impact of shaking on mRNA-LNP characteristics
In the previous section it is shown that by minimizing air entrainment during mixing, through increase of the liquid volume, the corresponding impact on mRNA encapsulation and particle size distribution is drastically reduced, even with an increased mixing speed. This indicates that the interaction with air acts as main stress force, causing an LNP size increase and mRNA encapsulation drop. Based on these findings shaking experiments are performed on liquid mRNA-LNP drug product in vials, to further elucidate the stress sensitivity of mRNA-LNP drug product and to check for possible relationships with headspace volume (or fill volume) and LNP content (or mRNA concentration). In these experiments all vials are shaken vertically in a controlled manner using a single platform laboratory shaker as shown in Figure S6 in the supplementary material and described in the materials and methods section.
As an initial experiment, an mRNA-LNP drug product presentation with a low fill volume of 0.48 mL in a 2 mL vial is used, containing 0.12 mg/mL of mRNA. When shaking vials with such a large headspace volume a similar evolution of particle size distribution is observed as with the large-scale low volume mixing experiment (see Fig. 2 and Fig. 6). The particle size distribution transitions during shaking from narrow unimodal at small LNP size, to tailing (after 10 min), over bimodal (after 30 min), to wide unimodal at larger LNP size (after 240 min).
Fig. 6.
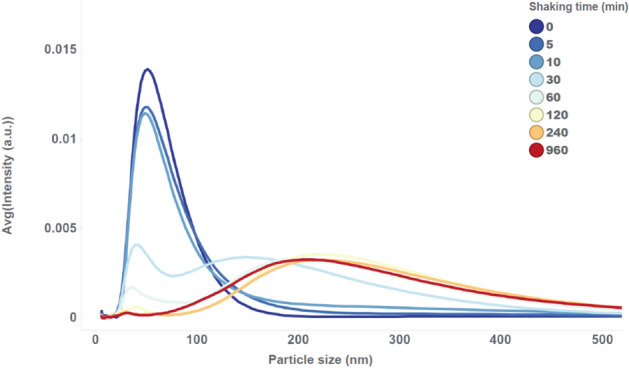
Particle size distributions of LNP drug product with 0.48 mL fill volume and 0.12 mg/mL mRNA, measured with the NanoFlowSizer at different shaking times.
In a more elaborate set of shaking experiments, the effect of headspace volume and LNP content on the stress sensitivity is further investigated. An mRNA-LNP formulation batch is split up in three different mRNA concentrations (0.12 mg/mL; 0.06 mg/mL; 0.01 mg/mL). Each of these concentrations is filled in 2 mL glass vials, one part with large headspace volume (0.48 mL fill volume) and one part with small headspace volume (2.25 mL fill volume).
While the behavior of LNP size (measured by dynamic light scattering, DLS, using Malvern Zetasizer) as function of shaking time is similar for the six drug product presentations, a large impact is seen for both fill volume and mRNA concentration (see Fig. 7). The vials with high fill volume and high mRNA concentration are more resistant against LNP size increase, compared to the ones with low fill volume and low mRNA concentration. At the highest mRNA concentration of 0.12 mg/mL, the highest impact of headspace volume is observed, while at the lower mRNA concentrations of 0.01 mg/mL and 0.06 mg/mL, the mRNA concentration becomes the main separator, with a drastic increase in stress sensitivity for the 0.01 mg/mL mRNA presentations.
Fig. 7.
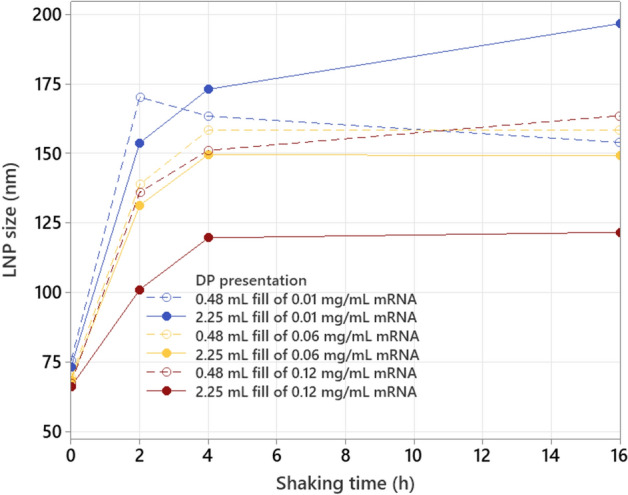
LNP size (measured with Zetasizer) as function of shaking time for different mRNA concentrations and fill volumes.
Another interesting observation is the evolution of LNP size and PDI with increasing shaking time. LNP size strongly increases the first 2 h of shaking, after which the rate of size increase starts to reduce, with a stabilization after 4 h of shaking (see Fig. 7). PDI also strongly increases during the first 2 to 4 h of shaking, after which it starts to drop (see Fig. 8). These trends are in line with the previous observations with the NanoFlowSizer where shaking effectuates a transition of the particle size distribution from narrow unimodal over bimodal towards a broader unimodal larger sized LNP population (see Fig. 6). The observed differences in LNP size and PDI at the start of shaking could be related to potential air entrapment during dilution or sample handling for which the low mRNA concentration formulations are more sensitive. Nevertheless, these differences are small compared to the observed differences caused by shaking. It should also be noted that all samples (incl. non-shaken samples) underwent the same hold time of 16 h at room temperature during the shaking experiment.
Fig. 8.
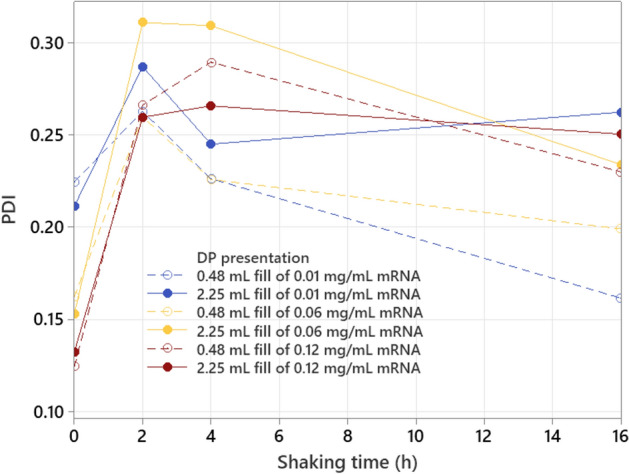
PDI (measured with Zetasizer) as function of shaking time for different mRNA concentrations and fill volumes.
An additional experiment with other mRNA concentrations (0.01, 0.1 and 0.5 mg/mL), focusing on the first 2 h of shaking, gives similar conclusions for headspace volume and LNP content impact (see Figures S7 and S8 in supplementary material). In addition, it is shown that for the low fill volume (0.48 mL), low mRNA concentration (0.01 mg/mL), presentation, the PDI already starts to drop again after 1 h of shaking, indicating the higher stress sensitivity with faster transition towards a larger sized LNP population.
When looking at the behavior of mRNA encapsulation as function of shaking time, an identical impact of fill volume and mRNA concentration is observed as shown earlier for LNP size (see Figs. 7 and 9), which is also confirmed in the additional shaking experiment with other mRNA concentrations (see Figure S9 in supplementary material). The vials with high fill volume and high mRNA concentration are more resistant against an mRNA encapsulation drop, compared to the ones with low mRNA concentration and low fill volume. The mRNA encapsulation strongly decreases the first 2 h of shaking, after which the rate of encapsulation drop starts to reduce, ending with a stabilization after 4 h of shaking for most presentations, except the 0.48 mL fill combined with 0.06 and 0.12 mg/mL mRNA. The reason for these two divergent values can either be linked with the Ribogreen analysis method, giving possible underestimation when measuring outside the calibrated range, or can either be linked with a mechanistic aspect of the imposed stress. Either way, during each shaking experiment a negative correlation between LNP size and mRNA encapsulation is present (see Fig. 10), which moves from a linear to a slightly quadratic correlation at low mRNA encapsulation values as indicated above.
Fig. 9.
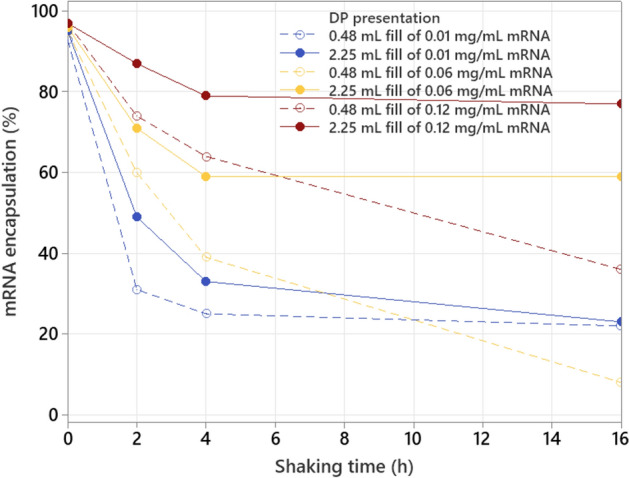
mRNA encapsulation (measured with Ribogreen) as function of shaking time for different mRNA concentrations and fill volumes.
Fig. 10.
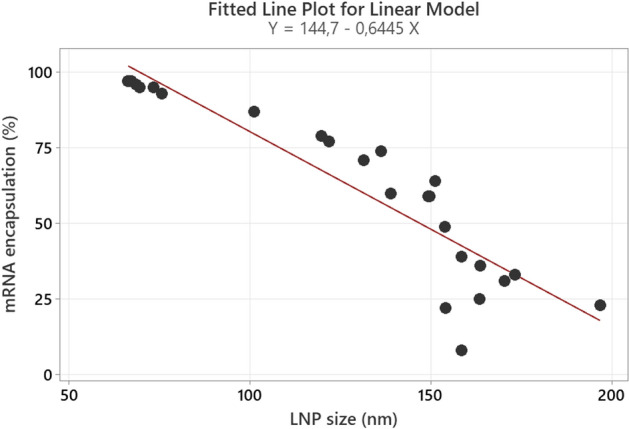
Negative linear correlation between mRNA encapsulation and LNP size for different mRNA concentrations, fill volumes and shaking times. R-sq = 81.96%; 81.96% of the variation in mRNA encapsulation can be explained by the regression model.
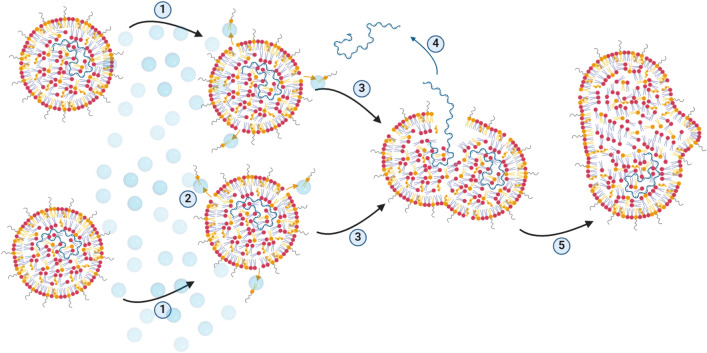
This direct negative correlation suggests that a certain fraction of the mRNA is removed from the LNP when the LNP size increases. Based on the observations described above a possible mechanism is proposed and shown in Fig. 11. Shaking with air entrainment causes air–liquid interfacial forces which can subtract parts of the PEGylated lipids on the outer surface of the LNP. The corresponding lowering of steric hindrance between neighboring LNPs causes merging of these unstable particles. During this merging process the lipid layer surrounding the mRNA gets temporarily interrupted allowing some of the mRNA strains to be removed from the LNP (either completely or partially). In the end, stable LNPs with larger size, but decreased mRNA payload, are formed.
Fig. 11.
Proposed mechanism explaining simultaneous LNP size increase and loss in mRNA encapsulation, caused by air bubbles. (1) Air bubbles bump onto LNP surface. (2) PEGylated lipids on the outer surface of LNPs are removed through air–liquid interfacial forces. (3) Decreased repulsion between neighboring LNPs causes merging. (4) Partial loss of mRNA payload during merging. (5) Stable LNPs with larger size, but decreased mRNA payload, are formed. Figure created with BioRender.com.
The slower increase in LNP size and drop in mRNA encapsulation for presentations with high fill volume and high mRNA concentration can also be explained by this proposed mechanism. A high fill volume or low headspace volume corresponds with less air bubbles per liquid volume, and therefore less interaction between air bubbles and a certain amount of LNPs. Following the same logic, a high mRNA concentration or high LNP content (due to constant N:P ratio during formulation) corresponds with a higher amount of LNPs for a certain amount of air bubbles, giving less interaction between air bubbles and LNPs. Interestingly, a similar concentration dependent impact of air entrainment is observed for monoclonal antibodies (mAbs), where hydrophobic interactions increase between neighboring proteins15,16, further supporting this proposed mechanism for LNPs. In addition, air–liquid interfacial stress has shown to be the major contributor to protein aggregation compared to shaking shear stress17. Mitigation strategies are also put forward, like reducing the air to liquid ratio for the Human Growth Hormone18, or the use of surfactants for different mAbs19.
The observation of the flattening of the LNP size and mRNA encapsulation curves, in Figs. 7 and 9 respectively, can be explained by the existing equilibrium of the PEGylated lipid, situated both in the LNP membrane and in the surrounding matrix. The active extraction of PEGylated lipids from the LNP membrane, giving merging of neighboring LNPs, alters the membrane surface properties and could therefore lead to a shift in equilibrium. The position of this equilibrium is determined by both the lipid (and therefore mRNA) concentration and the forces of the air–liquid interfacial stress from the air entrapment (and therefore headspace volume). The impact of LNP content on shake stress sensitivity is therefore twofold. On one hand, as described in the previous paragraph, a low LNP content leads to an increased air–liquid interfacial stress per LNP. On the other hand, a low LNP content corresponds with a low PEGylated lipid content and therefore easier extraction from the LNP membrane to the surrounding matrix. For a complete confirmation of the proposed re-distribution of lipids through shaking stress, a follow-up study would be required focusing on particle size separation and subsequent lipid determination.
The reproducibility of the shaking method was also assessed through execution of 3 separate runs, using 4 different mRNA-LNP drug product presentations (see Figure S10 and S11 in supplementary material). For a short shaking time of 30 min, the variation introduced by the shaking method appears negligible compared to the inherent variation of the respective measurement methods, with a standard deviation of LNP size of 2.09 nm (Zetasizer measurement), and a standard deviation of mRNA encapsulation of 0.98% (Ribogreen measurement). For this short shaking time the impact of mRNA concentration on the stress sensitivity can clearly and repeatedly be visualized. For longer shaking times, the 95% confidence intervals of 0.03 and 0.1 mg/mL mRNA (long strain length) overlap, indicating possible difficulty in assessing the impact of mRNA concentration due to increased variation of the shaking method or the measurement method at these increased LNP sizes. To see minor differences in stress resistance of different mRNA presentations, in a consistent way, it can therefore be useful to take along at least 2 shaking timepoints and to restrict the maximum shaking time while still allowing sufficient differentiation between each presentation.
Conclusions
The effect of fill volume and mixing speed is investigated in a commercial scale drug product vessel, showing a simultaneous impact on mRNA encapsulation and particle size distribution when the mixer impellers entrain air into the LNP suspension. For the first time in literature a clear correlation is shown between a decrease in mRNA encapsulation and a transformation of LNP size distribution from narrow unimodal over bimodal to broad unimodal at a higher sized population. Supplementary to using the NanoFlowSizer for accurately analyzing this shift in particle size distribution, a straightforward visual inspection can be a useful quick indicator for air entrainment in the sample and/or formulation process.
Lab-scale shaking experiments on different drug product filled vials, with varying LNP content and headspace volume, confirm the observations of the large-scale mixing experiments and in addition give a more in-depth knowledge about the underlying stress mechanism. DP presentations with high headspace volume (or low fill volume) and low LNP content (or low mRNA concentration) appear more sensitive to shaking stress, giving a faster and more pronounced impact on mRNA encapsulation and particle size distribution. Furthermore, a consistent and reproducible negative linear correlation is observed between mRNA encapsulation and LNP size. All these findings contribute to a proposed stress mechanism where air bubbles could alter the outer LNP structure through air–liquid interfacial forces, promoting merging of neighboring LNPs, with simultaneous partial removal of mRNA from the LNP core, leading to larger LNPs with lower mRNA payload. It should be noted that the test conditions in this manuscript were taken rather extreme, not corresponding with current formulation conditions and normal sample handling, to allow the reveal of this underlying stress mechanism. Although a clear parallel is drawn with studies on protein aggregation, there is still follow-up work required to completely elucidate the mechanism for mRNA-LNP merging under influence of air–liquid interfaces.
This manuscript adds considerable value to the RNA-LNP product knowledge, by focusing on potential risks, both during formulation and during subsequent sample handling. The findings highlight the importance of assessing mixing and filling parameters during formulation and create awareness for sample handling of filled vials. Reducing container headspace volume and maximizing LNP content might be interesting mitigation strategies to reduce the impact of air entrainment on product quality characteristics.
Materials and methods
mRNA-LNP formulations
mRNA-LNP formulations are prepared by dispensing mRNA in a low pH aqueous phase and 4 different lipids in an organic phase. Both phases are mixed using a T-mixer with an N:P ratio of 6. All mRNA-LNP drug products within this manuscript are prepared using the same formulation parameters (mRNA and lipid concentrations, flow rates and ratios). For this reason, the mRNA concentration is directly related to the LNP and lipid concentration. All LNPs are loaded with mRNA originating from commercial and development projects.
For all mRNA-LNP formulations the following lipids are used at fixed lipid to mRNA ratios, for 0.1 mg/mL mRNA being: i) 1.43 mg/mL ALC-0315 (((4-hydroxybutyl)azanediyl)bis(hexane-6,1-diyl)bis(2-hexyldecanoate)), ii) 0.18 mg/mL ALC-0159 (2-[(polyethylene glycol)-2000]-N,N-ditetradecylacetamide), iii) 0.31 mg/mL DSPC (1,2-distearoyl-sn-glycero-3-phosphocholine), and iv) 0.62 mg/mL cholesterol. For all mRNA-LNP formulations the final buffer composition is 10 mM TRIS and 300 mM sucrose.
Mixing experiments
Mixing experiments are performed in a 1600 L commercial scale vessel containing a mixer attached to the bottom of the vessel. A magnetic mixer driven by a Metenova ZG7 motor is used. The mixer diameter is 177 mm impeller diameter, the motor power is 0.75 kW, the gearbox ratio is 7:1 and the measuring range is 0–400 RPM. During all experiments the vessel is temperature monitored and actively cooled at 2–8 °C.
Shaking experiments
Shaking experiments are performed using a single platform laboratory shaker (Model 55 12 × 16 from Reliable Scientific) with a vial holder attached to the shaking plate to put vials in a vertical position on the shaker. The shaking speed for the laboratory shaker is set at the maximum speed of 100 upward movements per minute with tilting up to 20 degrees for the vertical positioned vials. Shaking experiments were performed at room temperature. After each shaking experiment the respective vials are frozen at − 80 °C awaiting analysis.
mRNA concentration and mRNA encapsulation measurements
Total mRNA concentration is determined through a Ribogreen based assay (Thermo Fisher Scientific). RiboGreen dye is added to the standard (mRNA reference material) and to the LNP containing samples to measure the free amount of mRNA in the LNP containing samples. Total mRNA is measured by disrupting the LNPs using a Triton X-100/ethanol mixture. The disrupted LNP solution is also dyed using RiboGreen dye and the total mRNA concentration is measured. Both free and total mRNA concentrations are calculated through a linear standard curve. All measurements described in this manuscript are performed with qualified or validated methods.
Particle size measurements
Zetasizer
Dynamic light scattering (DLS) is a technique that can be used to determine the size distribution profile of small particles in suspensions. When a laser light hits small particles, light is scattered in all directions (Rayleigh scattering). Small fluctuations occur because of Brownian motion. The frequency of the scattered intensity fluctuations depends on the particle size, this is: smaller particles diffuse more rapidly and thus produce higher frequencies, which means that the temporal fluctuations hold information on particle size.
NanoFlowSizer (NFS)
A limitation of traditional DLS is that it cannot be applied to relative turbid suspension without dilution. To overcome this limitation, the NFS makes use of Spatially Resolved Dynamic Light Scattering (SR-DLS), which allows for particle size characterization of samples with higher turbidity. SR-DLS makes use of the light scattering information as a function of optical path length and is corrected with an algorithm that considers multiple scattered light to account for highly turbid samples. The NFS is a non-invasive nanoparticle size analyzer capable of measuring particle size distributions without sample extraction and preparation (e.g., dilution) in less than 5 min, or even continuously with in-line measurements.
Since the NanoFlowSizer is a SR-DLS method, and not a traditional DLS method, it has different measurement parameters compared to the Zetasizer. The NFS uses a different wavelength and scans a larger particle size range. In addition, NFS samples are analyzed without dilution, which makes them more affected by viscosity changes between samples, whereas the Zetasizer controls the viscosity of the sample through dilution with a controlled buffer with known viscosity. Therefore, a difference in average particle size and PDI can be expected between a sample measured with SR-DLS versus conventional DLS. Because of this, the NanoFlowSizer data is solely used to compare particle size distribution profiles and is not used to compare with Zetasizer data.
mRNA integrity measurements with capillary gel electrophoresis
In capillary gel electrophoresis components are separated based on the differential migration of RNA of different molecular weights in an applied electric field. In this procedure, the lipid nanoparticle-mRNA test sample is subjected to a mixture of Triton X-100/alcohol to saponify the lipid nanoparticle and enable further analysis of the mRNA. Secondly, the saponified sample is subjected to a denaturant containing formamide (diluent marker) that unfolds the RNA and dissociates non-covalent complexes. When subjected to an electric field, the denatured RNA species migrate through the gel matrix, as a function of length and size, towards the anode. An intercalating dye binds to RNA and associated fragments during migration allowing for fluorescence detection. The intact RNA is separated from any fragmented species, allowing for the quantitation of RNA integrity by determining the relative percent time corrected area for the intact (main) peak.
Supplementary Information
Acknowledgements
R.V.P. acknowledges Robin De Corte for assisting in the mixing experiments and Karen Ghys for unconditional support during preparation and writing of the manuscript. All authors acknowledge Gudrun Coppens, Karen Ghys, Marjoh Nauta, Nick Watzeels and Sven Verdonck for review of the manuscript, and the EPP lab team for all the analytical work.
Author contributions
R.V.P., R.M. and B.G. designed and executed the mixing and shaking experiments. All authors helped in interpretation of data, and preparation and writing of the manuscript.
Data availability
The data generated and evaluated in this manuscript are included in the published article and its supplementary materials.
Competing interests
The authors declare no competing interests.
Footnotes
Publisher's note
Springer Nature remains neutral with regard to jurisdictional claims in published maps and institutional affiliations.
These authors contributed equally: Roman Matthessen and Robbe Van Pottelberge.
Supplementary Information
The online version contains supplementary material available at 10.1038/s41598-024-70680-4.
References
- 1.Vogel, A. B. et al. BNT162b vaccines protect rhesus macaques from SARS-CoV-2. Nature592, 283–289. 10.1038/s41586-021-03275-y (2021). 10.1038/s41586-021-03275-y [DOI] [PubMed] [Google Scholar]
- 2.Corbett, K. S. et al. Evaluation of the mRNA-1273 Vaccine against SARS-CoV-2 in Nonhuman Primates. New Engl. J. Med.383, 1544–1555. 10.1056/NEJMoa2024671 (2020). 10.1056/NEJMoa2024671 [DOI] [PMC free article] [PubMed] [Google Scholar]
- 3.Akinc, A. et al. The Onpattro story and the clinical translation of nanomedicines containing nucleic acid-based drugs. Nat. Nanotechnol.14, 1084–1087. 10.1038/s41565-019-0591-y (2019). 10.1038/s41565-019-0591-y [DOI] [PubMed] [Google Scholar]
- 4.Packer, M., Gyawali, D., Yerabolu, R., Schariter, J. & White, P. A novel mechanism for the loss of mRNA activity in lipid nanoparticle delivery systems. Nat. Commun.12, 6777. 10.1038/s41467-021-26926-0 (2021). 10.1038/s41467-021-26926-0 [DOI] [PMC free article] [PubMed] [Google Scholar]
- 5.Chheda, U. et al. Factors affecting stability of RNA – temperature, length, concentration, pH, and buffering species. J. Pharm. Sci.113, 377–385. 10.1016/j.xphs.2023.11.023 (2024). 10.1016/j.xphs.2023.11.023 [DOI] [PubMed] [Google Scholar]
- 6.Guth-Metzler, R. et al. Goldilocks and RNA: where Mg2+ concentration is just right. Nucleic Acids Res.8, 3529–3539. 10.1093/nar/gkad124 (2023). 10.1093/nar/gkad124 [DOI] [PMC free article] [PubMed] [Google Scholar]
- 7.Emilsson, G. M., Nakamura, S., Roth, A. & Breaker, R. R. Ribozyme speed limits. RNA9, 907–918. 10.1261/rna.5680603 (2003). 10.1261/rna.5680603 [DOI] [PMC free article] [PubMed] [Google Scholar]
- 8.Le Vay, K., Salibi, E., Song, E. Y. & Mutschler, H. Nucleic acid catalysis under potential prebiotic conditions. Chem. Asian J.15, 214–230. 10.1002/asia.201901205 (2020). 10.1002/asia.201901205 [DOI] [PMC free article] [PubMed] [Google Scholar]
- 9.Schoenmaker, L. et al. mRNA-lipid nanoparticle COVID-19 vaccines: Structure and stability. Int. J. Pharm.601, 120586. 10.1016/j.ijpharm.2021.120586 (2021). 10.1016/j.ijpharm.2021.120586 [DOI] [PMC free article] [PubMed] [Google Scholar]
- 10.Albertsen, C. H. et al. The role of lipid components in lipid nanoparticles for vaccines and gene therapy. Adv. Drug Deliv. Rev.188, 114416. 10.1016/j.addr.2022.114416 (2022). 10.1016/j.addr.2022.114416 [DOI] [PMC free article] [PubMed] [Google Scholar]
- 11.Kudsiova, L. et al. Stability testing of the Pfizer-BioNTech BNT162b2 COVID-19 vaccine: A translational study in UK vaccination centres. BMJ Open Sci.5, e100203. 10.1136/bmjos-2021-100203 (2021). 10.1136/bmjos-2021-100203 [DOI] [PMC free article] [PubMed] [Google Scholar]
- 12.Brader, M. L. et al. Encapsulation state of messenger RNA inside lipid nanoparticles. Biophys. J.120, 1–5. 10.1016/j.bpj.2021.03.012 (2021). 10.1016/j.bpj.2021.03.012 [DOI] [PMC free article] [PubMed] [Google Scholar]
- 13.Kamiya, M. et al. Stability study of mRNA-lipid nanoparticles exposed to various conditions based on the evaluation between physicochemical properties and their relation with protein expression ability. Pharmaceutics14, 2357. 10.3390/pharmaceutics14112357 (2022). 10.3390/pharmaceutics14112357 [DOI] [PMC free article] [PubMed] [Google Scholar]
- 14.Ruppl, A. et al. Don’t shake it! mechanical stress testing of mRNA-lipid nanoparticles. Eur. J. Pharm. Biopharm.198, 114265. 10.1016/j.ejpb.2024.114265 (2024). 10.1016/j.ejpb.2024.114265 [DOI] [PubMed] [Google Scholar]
- 15.Treuheit, M. J., Kosky, A. A. & Brems, D. N. Inverse relationship of protein concentration and aggregation. Pharm. Res.19, 511–516. 10.1023/A:1015108115452 (2002). 10.1023/A:1015108115452 [DOI] [PubMed] [Google Scholar]
- 16.Sreenivasan, S., Jiskoot, W. & Rathore, A. S. Rapid aggregation of therapeutic monoclonal antibodies by bubbling induced air/liquid interfacial and agitation stress at different conditions. Eur. J. Pharm. Biopharm.169, 97–109. 10.1016/j.ejpb.2021.08.010 (2021). 10.1016/j.ejpb.2021.08.010 [DOI] [PubMed] [Google Scholar]
- 17.Dasnoy, S., Illartin, M., Queffelec, J., Nkunku, A. & Peerboom, C. Combined effect of shaking orbit and vial orientation on the agitation-induced aggregation of proteins. J. Pharm. Sci.113, 669–679. 10.1016/j.xphs.2023.08.016 (2024). 10.1016/j.xphs.2023.08.016 [DOI] [PubMed] [Google Scholar]
- 18.Wiesbauer, J., Cardinale, M. & Nidetzky, B. Shaking and stirring: Comparison of controlled laboratory stress conditions applied to the human growth hormone. Process Biochem.48, 33–40. 10.1016/j.procbio.2012.11.007 (2013). 10.1016/j.procbio.2012.11.007 [DOI] [Google Scholar]
- 19.Vargo, K. B. et al. Surfactant impact on interfacial protein aggregation and utilization of surface tension to predict surfactant requirements for biological formulations. Mol. Pharm.18, 148–157. 10.1021/acs.molpharmaceut.0c00743 (2020). 10.1021/acs.molpharmaceut.0c00743 [DOI] [PubMed] [Google Scholar]
Associated Data
This section collects any data citations, data availability statements, or supplementary materials included in this article.
Supplementary Materials
Data Availability Statement
The data generated and evaluated in this manuscript are included in the published article and its supplementary materials.


