

Abstract
Immunoglobulin E (IgE) plays pivotal roles in allergic diseases through interaction with a high-affinity receptor (FcεRI). We established that Fab fragments of anti-IgE antibodies (HMK-12 Fab) rapidly dissociate preformed IgE-FcεRI complexes in a temperature-dependent manner and inhibit IgE-mediated anaphylactic reactions, even after allergen challenge. X-ray crystallographic studies revealed that HMK-12 Fab interacts with each of two equivalent epitopes on the Cε2 homodimer domain involved in IgE F(ab’)2. Consequently, HMK-12 Fab-mediated targeting of Cε2 reduced the binding affinity of Fc domains and resulted in rapid removal of IgE from the receptor complex. This unexpected finding of allosteric inhibition of IgE-FcεRI interactions by simultaneous targeting of two epitope sites on the Cε2 homodimer domain of IgE F(ab’)2 may have implications for the development of novel therapies for allergic disease.
Subject terms: Immunization, Allergy
The authors show that the allosteric inhibition of the interactions between Immunoglobulin E and the high-affinity receptor FcεRI by targeting two epitope sites of IgE may have implications for the development of novel therapies for allergic diseases.
Introduction
The worldwide prevalence of allergic diseases has increased dramatically over the last few decades in both developed and developing countries1. In 1966, a new class of immunoglobulin, now known as immunoglobulin E (IgE), was discovered by Ishizaka et al.2,3 and shown to play pivotal roles in allergic diseases, such as hay fever, atopic dermatitis, asthma, and anaphylaxis4–7. IgE is one of the five established classes of immunoglobulins (IgM, IgG, IgD, IgA, IgE) featuring pairs of light and heavy chains covalently linked by intermolecular disulfide bonds. The antigen-binding site of IgE is formed by the association of variable regions of light and heavy chains. On the other hand, its Fc region consists of disulfide-linked dimers of Cε2, Cε3 and Cε4 domains. However, unlike IgA, IgD, and IgG, a hinge region of IgE is replaced by Cε2. Therefore, digestion of IgE by pepsin occurs below the C terminal regions of Cε2 domain, resulting in F(ab’)2 fragments.
Structural analysis revealed that IgE Fc adopts an asymmetrically bent conformation, with the two Cε2 domains folding back onto the Cε3 and Cε4 domains8–12. Cross-linking of IgE bound to the high-affinity receptor (FcεRI) with multivalent allergens is known to cause release of histamine and other chemical mediators, resulting in Type I immediate hypersensitivity reactions13–15. Although several potential therapeutic approaches have been developed16, IgE neutralization with anti-IgE monoclonal antibodies appears to be the most promising strategy to prevent allergic diseases. Omalizumab, one of the most widely used anti-IgE antibody drugs17–21, binds to the Cε3 domains of IgE overlapping with the FceRI binding site, and positive clinical effects have been demonstrated, for example, against asthma and chronic urticarial disease19,22–25.
Our previous studies showed a Fab fragment of the anti-murine IgE antibody (6HD5 Fab) to inhibit passive cutaneous anaphylaxis (PCA) in vivo, as well as spleen tyrosine kinase (Syk) activity and β-hexosaminidase release from basophilic leukemia cells in vitro26. FACS analysis and deletion-mapping studies further revealed conformational epitopes on the Cε2 domains of IgE. Although the Cε2 domain has not previously been considered important for interactions between IgE and FcεRI, reports that its deletion from the IgE heavy chain increased the dissociation rate of IgE from FcεRI suggest a key stabilizing role27. The results also indicated that specific binding of Fab-6HD5 to the Cε2 domains may not only neutralize free IgE but also prevent allergic reactions by destabilizing preformed IgE-FcεRI complexes. There have also been reports that engineered IgE inhibitors or high concentrations of omalizumab similarly accelerate the dissociation of IgE from FcεRI28–31. In addition, an anti-IgE single-domain antibody has been shown to inhibit interactions between IgE and the two receptors, FcεRI and CD2332,33. These results have led to the hypothesis that such dissociation offers a better option for preventing allergic diseases, implying the need for further research aimed at novel therapeutic strategies.
Here, we explored what promises to be a more efficient and less harmful anti-IgE biological agent, the HMK-12 rat anti-murine IgE monoclonal antibody. HMK-12 was originally generated to analyze anaphylactic reactions elicited by IgE34,35. In this study, we focused on its Fab fragment (HMK-12 Fab) and reconfirmed that even a small amount of HMK-12 Fab can dissociate preformed IgE-FcεRI complexes on the surfaces of mast cells. In addition, it proved to be highly efficient at inhibiting IgE-mediated anaphylactic reactions, even after exposure to allergen challenge. While functional significance is clear, the mechanisms by which HMK-12 removes IgE molecules from FcεRI on mast cells have yet to be resolved in detail. To address this question, we focused on the identification of the HMK-12 epitope on IgE. Protein analysis using reducing agents and the endopeptidase pepsin indicated location in the IgE F(ab’)2 regions. Furthermore, X-ray crystallographic studies revealed that HMK-12 Fab fragment features a site for interactions with each of two equivalent epitopes resides on the Cε2 homodimer domain. Finally, these interactions could be shown to reduce the binding affinity of IgE-Fc domains and cause rapid removal of IgE from receptor complexes. These findings suggest that simultaneous targeting of two distinct epitopes on the Cε2 homodimer domain of a single IgE F(ab’)2 molecule dissociates IgE-FcεRI complexes in an allosteric manner and may offer insights into a promising therapeutic approach for severe allergic reactions.
Results
The binding epitopes of HMK-12 Fab reside on the IgE F(ab’)2 regions
To investigate the effect of HMK-12 Fab on the binding of IgE to FcεRI, various concentrations of Alexa 488-labeled SPE-7 IgE (an anti-DNP murine IgE antibody) were premixed with excess HMK-12 Fab or IgG2a Fab. The mixtures were then added to PT18 mouse mast cells and incubated for 20 min at 37 °C. Following the wash step, the cells were subjected to flow cytometry analysis. As shown in Fig. 1a, HMK-12 Fab but not rat IgG2a Fab clearly inhibited the binding of SPE-7 IgE to PT18 cells in a dose-dependent manner. Since we have previously shown that HMK-12 Fab interacts with preformed IgE-FcεRI complexes at low temperature26, one possible explanation might be that it causes alteration in the IgE-Fc domains required to interact with FcεRI.
Fig. 1. HMK-12 Fab recognizes IgE F(ab’)2 regions and inhibits the IgE-FcεRI interactions.

a Various concentrations of Alexa 488-labeled SPE-7 IgE were premixed with an excess (2 μM) of HMK-12 Fab or IgG2a Fab and incubated for 15 min at 37 °C. The mixtures were then added to 1 × 10⁵ PT18 cells and incubated for 20 min at 37 °C. The cells were washed with PBS and the fluorescent intensity assessed using a FACSCelesta (Becton-Dickenson, CA, USA). b Reduced and non-reduced SPE-7 IgE were coated onto the microplate and non-specific interactions were blocked using a blocking reagent, Block Ace. After washing, the microplate was probed with biotinylated HMK-12 Fab or 6HD5 Fab. The level of these anti-IgE antibodies bound to SPE-7 IgE was detected by ELISA using horseradish peroxidase (HRP)-conjugated streptavidin, followed by TMB substrate solution. The color change was measured spectrophotometrically at a wavelength of 450 nm. c SPE-7 IgE protein was treated with serial dilutions of dithiothreitol (DTT: 5–20 mM) for 60 min at room temperature. After dialysis, the samples were subjected to SDS-PAGE under non-reducing conditions, transferred to a PVDF membrane and probed with HMK-12 Fab, 6HD5 Fab and the anti-rat λ chain followed by HRP goat anti-rat IgG. d To determine HMK-12 Fab reactivity against pepsin-digested IgE, SPE-7 IgE was digested with pepsin at pH 3.8 or pH 4.5. The digests were then analyzed for reactivity to HMK-12 Fab with SDS-PAGE under non-reducing conditions followed by western blot analysis.
To further address this question, we explored HMK-12 Fab binding epitopes on the IgE molecule using enzyme-linked immunosorbent assay (ELISA). First, the microplate was coated with reduced and non-reduced SPE-7 IgE, and then non-specific interactions were blocked using a blocking reagent. After washing, the microplate was incubated with biotinylated HMK-12 Fab or 6HD5 Fab. The level of these anti-IgE antibodies bound to SPE-7 IgE was detected by horseradish peroxidase (HRP)-conjugated streptavidin, followed by TMB substrate solution. The color change was then measured spectrophotometrically at a wavelength of 450 nm. The results shown in Fig. 1b clearly indicate that 6HD5 Fab detects both reduced and non-reduced SPE-7 IgE. Whereas HMK-12 Fab reacted only with the non-reduced SPE-7 IgE, but not with the reduced one.
We then examined how the anti-IgE antibodies might react with IgE during the process of reduction. First, SPE-7 IgE protein was treated with a serial dilution of dithiothreitol (DTT: 5–20 mM) for 60 min at room temperature. After dialysis, the samples were subjected to SDS‒PAGE under non-reducing conditions, followed by western blotting. As shown in Fig. 1c, 6HD5 Fab detected whole IgE molecules (200 kDa) as well as the partially reduced IgE heavy chain (70 kDa) in a DTT dose-dependent manner. Likewise, the anti-rat λ chain detected whole IgE molecules and IgE heavy and light chains (25 kDa). However, HMK-12 Fab reacted only with the whole IgE molecules and not with the reduced IgE heavy chains, indicating that the binding epitopes reside on IgE homodimers and not on monomers.
To define the epitopes on the IgE dimers recognized by HMK-12 Fab, we digested SPE-7 IgE with pepsin to generate F(ab’)2 fragments and then analyzed HMK-12 Fab reactivity by performing SDS‒PAGE under non-reducing conditions followed by western blotting (Fig. 1d). Only the anti-rat λ could detect Fab (50 kDa) when digestion was carried out at pH 3.8. On the other hand, HMK-12 Fab could detect large fragments between 75 kDa and 150 kDa at pH 4.5. Above all, HMK-12 Fab most strongly reacted with 150 kDa bands corresponding to IgE F(ab’)2.
To further confirm these results, we first purified HMK-12 Fab and SPE-7 IgE F(ab’)2 using a Superose 12 10/300 GL column equilibrated with 20 mM HEPES-NaOH (pH 7.5) containing 0.15 M NaCl and 0.001 mM β-octylglucoside (Supplementary Fig. 1a) and mixed them at a molar ratio of 2.1:1. After incubation for 8 hours at 4 °C, samples were applied to HiPrep 16/60 Sephacryl S-300 HR equilibrated with the same buffer for Superose 12 10/300 GL to remove uncomplexed Fab and particles with unexpectedly short retention times (Supplementary Fig. 1b). Then, the peak fractions (fractions 9–14) were run on SDS‒PAGE under non-reducing conditions. Two bands, 150 kDa and 45 kDa, corresponding to IgE F(ab’)2 and HMK-12 Fab, respectively, were observed (Supplementary Fig. 1c), providing compelling evidence that the binding epitopes of HMK-12 Fab reside in the IgE F(ab’)2 region.
The crystal structure of HMK-12 Fab/IgE F(ab’)2 complexes
We then determined the crystal structure of HMK-12 Fab/IgE F(ab’)2 complexes at 2.9 Å resolution with R and Rfree values of 0.228 and 0.267, respectively (Fig. 2). Crystallographic data are summarized in Table 1. The complex comprised one IgE F(ab’)2 and two HMK-12 Fab elements binding to its Cε2 homodimer. One half of the complex, consisting of one pair of heavy and light chains in IgE F(ab’)2 and one HMK-12 Fab, relates to the other half by a crystallographic twofold rotation symmetry axis located at the center of the Cε2 homodimer (Fig. 2).
Fig. 2. Crystal structure of HMK-12 Fab–IgE F(ab’)2 complex.
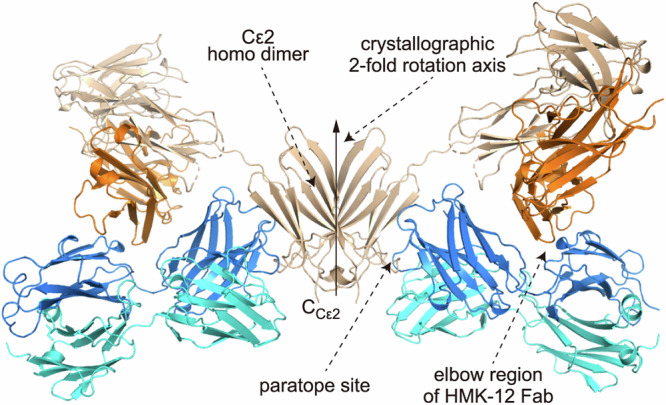
The heavy and light chains of HMK-12 Fab are shown in blue and cyan, respectively. The Fv portion and Cε2 domain of heavy chains of IgE F(ab’)2 are in khaki and beige, respectively. The light chain of IgE F(ab’)2 is in orange. The crystallographic twofold rotation symmetry axis is indicated by a solid thick arrow. The C-terminal end of Cε2 domain is shown by the label “CCε2”. Gray cartoon model is the crystallographic twofold rotation symmetry mate.
Table 1.
Data collection and refinement statistics
| Wavelength (Å) | 1.0 |
|---|---|
| Resolution range (Å) | 49.6–2.9 (3.0–2.9) |
| Space group | C 1 2 1 |
| Unit cell | 282.1 Å, 86.1 Å, 56.1 Å, 90.0°, 97.2°, 90.0° |
| Total reflections | 1900,387 (194,314) |
| Unique reflections | 29,738 (2956) |
| Multiplicity | 63.9 (65.6) |
| Completeness (%) | 99.85 (99.70) |
| Mean I/sigma(I) | 17.77 (3.05) |
| Wilson B-factor (Å2) | 43.82 |
| R-merge | 0.4627 (2.435) |
| R-meas | 0.4663 (2.453) |
| R-pim | 0.05702 (0.2987) |
| CC1/2 | 0.996 (0.898) |
| CC* | 0.999 (0.973) |
| Reflections used in refinement | 29,725 (2956) |
| Reflections used for Rfree | 1920 (185) |
| Rwork | 0.2256 (0.2993) |
| Rfree | 0.2674 (0.3700) |
| CCwork | 0.927 (0.875) |
| CCfree | 0.884 (0.806) |
| Number of non-hydrogen atoms | 7560 |
| macromolecules | 7400 |
| ligands | 84 |
| solvent | 76 |
| Protein residues | 957 |
| RMS (bonds) (Å) | 0.002 |
| RMS (angles) (°) | 0.61 |
| Ramachandran favored (%) | 95.66 |
| Ramachandran allowed (%) | 3.92 |
| Ramachandran outliers (%) | 0.42 |
| Rotamer outliers (%) | 0.48 |
| Clash score | 3.19 |
| Average B-factor (Å2) | 64.91 |
| macromolecules (Å2) | 65.31 |
| ligands (Å2) | 54.16 |
| solvent (Å2) | 37.85 |
| Number of TLS groups | 9 |
Statistics for the highest-resolution shell are shown in parentheses.
Three hundred forty-eight crystals were used in small wedge data collection with a total oscillation angle of 10°/crystal. *Values in parentheses are for the highest-resolution shell.
In the complex particle, HMK-12 Fab provides two sites for intermolecular interaction with one IgE F(ab’)2 molecule. One major site is paratopic, through which HMK-12 Fab binds to the surface neighboring the C-terminal end of the Cε2 (shown by “CCε2” in Fig. 2) (Fig. 2). The interaction surface area is 975.3 Å2 (Nos. 4, 6, 7, and 8 in Supplementary Table S1). The binding energy gain, Δ’G, regarding this interaction, was calculated to be −5.8 kcal/mol. The other additional site is concave, existing at the elbow region of the heavy chain of HMK-12 Fab which accommodates the loop structure of the IgE F(ab’)2 light chain with an interaction surface area of 437.9 Å2 (No. 5 in Supplementary Table S1 and Fig. 3). From the calculated binding energy gain of −2.4 kcal/mol, interaction between the epitope site of IgE F(ab’)2 and the paratope site of HMK-12 Fab mainly contributes to complex formation. The crystallographic atomic positional displacement factor averaged over the Cα atoms of HMK-12 Fab was almost the same as that of Cε2 domain of IgE F(ab’)2 (45.6 Å2 and 47.5 Å2, respectively), in line with tight binding between HMK-12 Fab and the Cε2 domain of IgE F(ab’)2 behaving just like a single particle in the crystal. In contrast, the crystallographic atomic positional displacement factor averaged over the Cα atoms of Fab portion of IgE F(ab’)2 was 81.6 Å2. Thus the Fab portion of IgE F(ab’)2 appears more disordered in crystal structure. The major factor in complex formation would therefore be expected to be interaction between the epitope site of IgE F(ab’)2 and the paratope site of HMK-12 Fab.
Fig. 3. Omit electron density map around the interaction between the heavy chain of HMK-12 Fab and light chain of IgE F(ab’)2.

The heavy chain of HMK-12 Fab and light chain of IgE F(ab’)2 are shown by blue and orange carbons, respectively. Omit electron density maps (m|Fo | -D|Fcomit | ) of the heavy chain of HMK-12 Fab and light chain of IgE F(ab’)2 contoured at 2σ are colored in khaki and violet, respectively. There are pairs of amino acid residues with possible hydrogen bonding shown by dashed lines. Those are carbonyl oxygen of P9/ND1 of H203 with distance of 2.7 Å, carbonyl oxygen of P208/OG of T199 with distance of 3.3 Å, OG of S211/OG of T148 with distance of 2.9 Å, and NZ of K213/carboxyl oxygen of D150 with a distance of 3.2 Å. The side chains of F11 and H203 are partially stacked with an inter-ring distance of 4.2 Å.
Although there may be some concern about the actual contribution of calculated binding energy on the formation of a complex particle, the calculated binding energy value of minus a few kcal/mol of the additional interaction between the concave existing at the elbow region of the heavy chain of HMK-12 Fab and the light chain of IgE F(ab’)2 suggests that the interaction could have some contribution to formation of crystallizable particles. The linker peptide chain connecting the Cε2 domain and the Fab portion in IgE F(ab’)2 as a long-extended peptide chain with less interaction to other parts of IgE F(ab’)2 in the crystal structure would have some structural flexibility in solution and could be a cause for change of relative location between Fab and Fc portions of IgE, in line with electron microscopic observation of negative stained intact IgEs in free and Fab complexed forms36. Although it remains to be clarified whether or not the interaction between the elbow region of the heavy chain of HMK-12 Fab and the light chain of IgE F(ab’)2 with the preferred binding energy change is maintained in a certain fraction in solution, the interaction would contribute to form a crystallizable particle with lower structural flexibility in the course of crystal growth.
Epitope recognition
Five peptide fragments whose amino acid residues showed reduced water-accessible surface areas on binding of HMK-12 Fab were selected as epitope subsites forming an epitope. Four (epitope subsite (ES) 1: 219-EPTL-222, ES 3: 259-DDR-261, ES 4: 296-ESTFTCK-302, ES 5: 307-GVDYLAHTR-315) belonged to a monomer in the Cε2 homodimer and the other (ES 2: 230-DPNAFH-235) to the other monomer (Fig. 4a). The amino acid residues in HMK-12 Fab whose water-accessible surface areas were reduced by binding to IgE F(ab’)2 were selected as the amino acid resides forming a paratope as the counterpart of the epitope. Calculations of water-accessible surface areas and binding energy gain Δ’G, and detection of possible hydrogen bonding, were performed by PISA37. Data are summarized in Supplementary Table S2.
Fig. 4. Detail of interactions between the Cε2 homodimer domain of IgE F(ab’)2 and HMK-12 Fab.

Amino acid residues which have buried surface areas upon complex formation were selected as responsible candidates. In panel a, the surface shows the putative paratope site of HMK-12. The surface areas colored in cyan and ivory correspond to the heavy and light chains of HMK-12 Fab, respectively. Thick stick models are putative epitope subsites of IgE F(ab’)2 interacting with the putative paratope sites. The difference in color shows which monomers the subsites belong to in the Cε2 homodimer. Green peptide chains belong to the Cε2 monomer adjacent to HMK-12 Fab and yellow one belongs to the other Cε2 monomer locating distal side of the Cε2 homodimer from the HMK-12 Fab. The putative epitope fragments are numbered (ES 1 to ES 5) in order from the N-terminal to the C-terminal in the amino acid sequence in the Cε2 monomer. In panels b to f, covering binding details of the putative epitope subsites 1 to 5, the coloring scheme follows panel a. The potential hydrogen bonds detected by PISA are shown by dashed lines. The number in parenthesis following one-letter code of amino acid residue and whose sequence number shows the CDR number as the appearing order of CDR in the amino acid sequence.
The ES 1 (219-EPTL-222) which is the N-terminal side of β-strand 1 in a Cε2 domain interacts only with the heavy chain of HMK-12 Fab with an interface area of 108.4 Å2 (Fig. 4b, Supplementary Fig. 2a, and Supplementary Table S2). The amino acid residues of HMK-12 Fab whose water-accessible surface areas were reduced by the ES 1 were S28, T30, A31, and S32 from the complementarity determining region (CDR) 1 and Y55 from CDR 2 of the heavy chain of HMK-12 Fab. The amino acid sequences of the CDRs are shown in Supplementary Fig. 3. Three hydrogen bonds were detected by PISA, though bond distances between S32 and P220 or L222 were longer than 3.3 Å. Binding energy gain was calculated to be 0.0 kcal/mol, implying a limited contribution of this interaction regarding the ES 1 to the complex formation.
The ES 2 (230-DPNAFH-235) is a loop connecting β-strands 1 and 2 in the Cε2 domain forming a homodimer with the other domain containing all other fragments (Fig. 4c, Supplementary Fig. 2b, and Supplementary Table S2). The majority of the paratope site interacting with the ES 2 is composed of amino acid residues of the heavy chain of HMK-12 Fab (S33 and F35 from CDR 1, Y52, Y55, S58, and Y60 from CDR 2, H100, Y103, S104, S105, and R106 from CDR 3). The light chain of HMK-12 Fab participates in the formation of the paratope site through only one amino acid residue, F94 from CDR 3. Six hydrogen bonds were detected between the amino acid residues of the ES 2 and those of the heavy chain of HMK-12 Fab. One of these had a slightly longer bond distance, i.e., 3.5 Å. The large decrease of binding energy gain (−2.9 kcal/mol for binding with the heavy chain of HMK-12 Fab and −1.6 kcal/mol for binding with the light chain of HMK-12 Fab) suggests that the interaction between the ES 2 and corresponding paratope site is one of the major interactions for the complex formation.
The ES 3 (259-DDR-261) is the turn following β-strand 3 in the Cε2 domain. The paratope site is formed by 9 amino acid residues, four of which (Y102, Y103 S104, and S105) are in CDR 3 of the heavy chain of HMK-12 Fab, and the other 5 being R31 and Y32 from CDR 1, F49, S50, and T53 from CDR 2 of the light chain of HMK-12 Fab (Fig. 4d, Supplementary Fig. 2c, and Supplementary Table S2). Each light and heavy chain HMK-12 Fab features two detected possible hydrogen bonds. One between D259 of the Cε2 domain and two conformers of the side chain of R31 of the light chain of HMK-12 Fab featured a bonding distance of 3.0 Å and 3.4 Å. The other ones between the side chain carbonyl oxygens of D260 of the Cε2 domain and S104 of the heavy chain of HMK-12 Fab were 2.9 Å. Interface area and binding energy gain between the ES 3 and a part of the paratope site formed by the amino acid residues of the heavy chain were found to be 61.7 Å2 and 0.0 kcal/mol, respectively (Supplementary Table S2). The interface area and binding energy gain between the putative epitope 3 and the part of the paratope site formed by the amino acid residues of the light chain were 73.6 Å2 and −0.3 kcal/mol, respectively. There would thus be a weak attractive force between the ES 3 and the paratope site of HMK-12 Fab.
The ES 4 (296-ESTFTCK-302) is two-thirds of the N-terminal side of the β strand 6 in the Cε2 domain. The paratope consists of 6 amino acid residues of HMK-12 Fab–Y102, S104, S105, and R106 from the heavy chain CDR 3 (Fig. 4e and Supplementary Fig. 2d), along with R31 and Y32 from the light chain CDR 1. Accessible area and binding energy gain Δ’G between the ES 4 and a part of the paratope site formed by the amino acid residues from the heavy chain were 88.6 Å2 and 0.2 kcal/mol, respectively (Supplementary Table S2). Those between the ES 4 and a part of the paratope site formed by the amino acid residues of the light chain were 33.4 Å2 and 0.2 kcal/mol. Though amino acid resides exist whose water-accessible area decreases upon complex formation between the ES 4 and the corresponding paratope site, regarding the complex formation, the interaction would not appear to have an important role.
The ES 5 (307-GVDYLAHTR-315) is β strand 7 in the Cε2 domain. A major part of the corresponding paratope site consists of the amino acid residues of the heavy chain of HMK-12 Fab, that is, G26, Y27, T31, S32, S33 from CDR 1, and G101, Y102, Y103, S104, and R106 from CDR 3 (Fig. 4f and Supplementary Fig. 2e). The interaction surface area, where many amino acid residues participate, is 287.3 Å2 (Supplementary Table S2. Six possible hydrogen bonds detected by the analysis using PISA are those between the ES 5 and the amino acid residues of the heavy chain of HMK-12 Fab. Though the light chain of HMK-12 Fab has two amino acid residues of Y32 from CDR 1 and N92 from CDR 3 in this interaction surface, the interaction surface area is only 3.1 Å2. The values of calculated binding energy gain between the ES 5 and a part of the paratope site formed by the heavy or the light chains were −1.8 kcal/mol and 0.0 kcal/mol, respectively. The attractive force between ES 5 and the paratope site appears to depend on the interaction with the heavy chain of HMK-12 Fab.
Taking these observations on the structural characteristics of the interactions related to the antigen recognition of HMK-12 Fab together, it seems that the ES 2 and CDRs from both heavy and light chains of HMK-12 Fab and the ES 5 and CDRs from the heavy chain of HMK-12 Fab mainly contribute to maintaining the complex. The interaction between the ES 3 and the light chain of HMK-12 Fab might have an additional role in complex stabilization.
The structure of the Cε2 homodimer domain of IgE F(ab’)2 provides the epitope site recognized by one HMK-12 Fab. The ES 1, 3, 4, 5 of a monomer in the Cε2 homodimer domain and the ES 2 of the other monomer in the Cε2 homodimer domain as the twofold rotation symmetry mate of the first Cε2 monomer form one epitope site. The ES 2 may contribute to stable binding through lowering the binding energy. The structure of the Cε2 homodimer domain appears crucial for stable complex formation with HMK-12 Fab, which is a type of Fab recognizing three-dimensional structures of antigens.
HMK-12 may have low Kd in binding IgE undergone SDS-page as long as without cleavage of disulfide bridge. Figure 1c shows that HMK-12 could recognize some of the epitope subsites in non-native state but where disulfide bridge is maintained. The requirement of disulfide bridge suggests that epitope subsite itself does not have enough potential as to be an epitope, but it in an environment prepared through some interaction with other part of peptide of IgE could be an epitope. It would not necessarily be inconsistent with the conformational nature of the epitope shown by the crystal structure analysis.
HMK-12 Fab rapidly dissociates IgE-FcεRI complexes and inhibits anaphylactic reactions
IgE binds with high affinity (dissociation constant, Kd = 10−10 M) to FcεRI on the surfaces of mast cells and basophils37. This affinity is thought to be at least several orders of magnitude higher than that of IgG for Fc γ receptors (FcγRs) or IgE for the low-affinity receptor, CD2338,39. Despite this tight association between IgE and FcεRI, preliminary studies have shown that HMK-12 Fab has the peculiar property of being able to dissociate IgE from FcεRI34. To gain further insight into these phenomena, we investigated the dissociation efficiency of preformed IgE-FcεRI complexes by HMK-12 Fab. For this purpose, PT18 cells were preincubated with 0.2 μM Alexa 488-labeled SPE-7 IgE for 15 min at 37 °C. The cells were then washed twice to remove excess unbound antibodies, incubated with different concentrations of HMK-12 Fab or IgG2a Fab (0.02 μM, 0.2 μM, 2 μM) at various temperatures (2, 25, and 37 °C) for 5, 15, and 75 min, and assessed for fluorescence intensity using a FACSCelesta flow cytometer. The values for SPE-7 IgE+ PT18 cells dramatically decreased by 46, 73, and 89% after incubation with 2 μM HMK-12 Fab at 37 °C for 5, 15, and 75 min, respectively (Fig. 5a). However, this change was not observed after incubation at 2 °C.
Fig. 5. HMK-12 Fab rapidly dissociates IgE–FcεRI complexes and inhibits anaphylactic reactions.

a PT18 cells were preincubated with 0.2 μM Alexa 488-labeled SPE-7 IgE for 15 min at 37 °C, washed twice to remove excess antibodies, and incubated with different concentrations of HMK-12 Fab or IgG2a Fab (0.02 μM, 0.2 μM, 2 μM) at various temperatures (2, 25, and 37 °C) for 5, 15, and 75 min. After washing, fluorescent intensity was determined using a FACSCelesta flow cytometer. b PT18 cells were preincubated with 0.2 μM Alexa 488-labeled SPE-7 IgE for 15 min at 37 °C, washed twice to remove excess antibodies, and incubated with 2 μM HMK-12 Fab or IgG2a Fab at 37 °C for 15 and 60 min. After washing, fluorescent intensity was determined (upper figure) and levels of SPE-7 IgE/HMK-12 Fab immune complexes in the culture supernatant were measured by ELISA using HRP-labeled anti-rat IgG (Fab’)2 secondary antibodies (lower figure). IC: Immune Complex. c PCA reactions before and after antigen stimulation. Before Challenge: Two days after intradermal injection of SPE-7 IgE (1 μg/ml), 5 μg/ml aliquots of HMK-12 Fab or anti-κ Fab (control) were injected into the same sites. Fifteen minutes later, the rats were intravenously challenged with DNP-BSA in saline (1 mg/ml) containing 0.5% Evans blue. After Challenge: Two days after intradermal injection of SPE-7 IgE, four rats were intravenously challenged with DNP-OVA in saline (1 mg/ml) containing 0.5% Evans blue. Immediately after the challenge, 10 μg/ml of HMK-12 Fab or anti-κ Fab was injected intradermally into the rats. In both cases, extravasation of Evans blue from blood vessels into tissues was quantified by measuring absorbance at 620 nm wavelength. The level of extravasated Evans Blue after injection with anti-κ Fab was set to 100%. Statistical analysis was performed using GraphPad PRISM7 software.
To confirm that the decreased fluorescence intensity was due to the dissociation of IgE–FcεRI complexes, we analyzed the culture supernatants for dissociated SPE-7 IgE by ELISA. For this purpose, PT18 cells preincubated with Alexa 488-labeled SPE-7 IgE were washed and incubated with 2 μM HMK-12 Fab or IgG2a Fab at 37 °C. After incubation with the former at 37 °C for 15 and 60 min, flow cytometry analysis indicated that the intensity of SPE-7 IgE+ PT18 cells decreased by 76 and 85%, respectively (Fig. 5b, upper figure). We next performed ELISA experiments to analyze the cell culture supernatant after incubation with HMK-12 Fab. At the 15 and 60 min time points, the concentrations of SPE-7 IgE/HMK-12 Fab immune complexes in the culture supernatants were 1.5 nM and 2 nM, respectively (Fig. 5b, lower figure). We next performed ELISA experiments to analyze the cell culture supernatant after incubation with HMK-12 Fab. At the 15 and 60 min time points, the concentrations of SPE-7 IgE/HMK-12 Fab immune complexes in the culture supernatants were 1.5 nM and 2 nM, respectively (Fig. 5b, lower figure). However, immune complexes were not detected when SPE-7+ PT18 cells were incubated with IgG2a Fab. In summary, these results clearly demonstrated that a small amount of HMK-12 Fab rapidly dissociates preformed IgE–FcεRI complexes in a temperature-dependent manner.
To further address the role of the HMK-12 Fab fragment (HMK-12 Fab) in allergic reactions, we investigated the in vivo effects of HMK-12 Fab on IgE-mediated anaphylactic reactions using a passive cutaneous anaphylaxis (PCA) assay. First, we injected 1 μg/ml SPE-7 IgE intradermally into rats. Two days later, 5 μg/ml aliquots of HMK-12 Fab or anti-κ Fab were injected into the same sites. Fifteen minutes later, the rats were intravenously challenged with DNP-BSA in saline (1 mg/ml) containing 0.5% Evans blue. Then, the extravasation of Evans blue from blood vessels into tissues was quantified by measuring the absorbance at 620 nm. The results shown in Fig. 5c (before the challenge) indicated that a small amount of HMK-12 Fab could inhibit PCA reactions, whereas there was no inhibition of PCA reactions with anti-κ Fab. Second, two days after intradermal injection of SPE-7 IgE, rats were intravenously challenged with DNP-OVA in saline (1 mg/ml) containing 0.5% Evans blue. Immediately after the challenge, 10 μg/ml HMK-12 Fab or anti-κ Fab was injected intradermally into the rats. Quantitative evaluation of extravasated Evans blue revealed that HMK-12 Fab could inhibit PCA reactions, whereas there was no inhibition with anti-κ Fab (after challenge).
Discussion
We can conclude from our results that the Fab fragment of the monoclonal anti-IgE antibody, HMK-12 Fab, is novel in several respects. First, the binding epitopes reside in the IgE F(ab’)2 regions. Second, HMK-12 Fab can rapidly dissociate preformed IgE–FcεRI complexes and inhibit IgE-mediated anaphylactic reactions even after exposure to allergen challenge. Finally, X-ray crystallographic studies revealed that HMK-12 Fab mediates targeting of two equivalent epitopes which are in a twofold rotation symmetry relationship in the Cε2 homodimer domain of IgE F(ab’)2, which makes it difficult for IgE to take the asymmetric Fc conformation reported when IgE binds to FcεR (12, 35, 36), promoting dissociation of IgE from receptor complexes in an allosteric manner. Since the discovery of IgE, a number of monoclonal anti-IgE antibodies have been generated for therapeutic purposes, including omalizumab, ligelizumab, quilizumab etc.40. However, most of the binding epitopes of these antibodies were found within the Cε3 and Cε4 domains overlapping with FcεRI binding sites. Therefore, in contrast to HMK-12 Fab, they can not efficiently interact with preformed IgE–FcεRI complexes. Our competition experiments revealed that HMK-12 Fab effectively blocks the binding of IgE to FcεRI on mast cells in a dose-dependent manner, facilitating the identification of the IgE epitopes which it recognizes. Subsequent protein analysis under reducing and non-reducing conditions indicated that HMK-12 Fab binding epitopes reside on IgE dimers but not monomers. Furthermore, pepsin digestion studies surprisingly revealed that HMK-12 Fab binding epitopes reside in the IgE F(ab’)2 regions. This observation was confirmed by X-ray crystallographic studies indicating that HMK-12 Fab fragment recognizes an epitope site consisted of the epitope subsites from both monomers in the Cε2 homodimer in which a disulfide bond bridges two IgE heavy chains.
Another striking finding was the HMK-12 Fab-mediated removal of IgE from receptor complexes, presumably related to reduced diversity in the spatial links between Cε2 and Cε3 domains. This is most likely due to binding epitopes of HMK-12 Fab located on the bottom half of the Cε2 domain being juxtaposed to the Cε3 domain via a short linker region of intact IgE. Figure 6a, b illustrates crystal structure superimpositions of the IgE-Fc/FcεRI (PDB ID: 2Y7Q) and HMK-12/IgE F(ab’)2 complexes determined in this work. In the complex structure of IgE-Fc-FcεRI, two Fc fragments form a structurally asymmetric dimer in which the Cε3 domain interacts with the Cε2 domain in different spatial arrangements. Consequently, the space formed between two Cε3 domains (green and violet cartoon models in Fig. 6a, b) is thought to accommodate the binding of FcεRl41. In the superimposition of Cε2 of IgE in this work on Cε2 of the receptor complex, the Fv domain of the light chain of HMK-12 Fab was found to overlap with the Cε3 domain in the receptor complex structure (Fig. 6a). In the superimposition of Cε2 of IgE in this work on the other Cε2 of the receptor complex (Fig. 6b), the Fv domain of heavy chain of HMK-12 Fab overlaps with the other Cε3 domain in the receptor complex structure. The HMK-12 Fab binding to Cε2 domain of IgE would force the Fc fragments of IgE to take a spatial arrangement different from that observed in the crystal structure of Fc and the FcεRI complex.
Fig. 6. The molecular shape in twofold rotation symmetry formed by HMK-12 Fab binding to Cε2 homodimer domain potentially disturbing taking binding conformation observed in IgE-Fc/FcεRI complex.

Superimposition of the HMK-12 Fab/IgE F(ab’)2 and IgE-Fc/FcεRI complexes (a, b). a The Cε2 monomer of IgE F(ab’)2 in a crystallographic asymmetric unit in this work (cartoon model colored in pink) is superimposed on a Cε2 monomer (cartoon model colored in light green) in the Cε2 homodimer domain of IgE-Fc/FcεRI complex (PDB ID: 2Y7Q). b The Cε2 monomer of IgE F(ab’)2 in this work (cartoon model colored in pink) is superimposed on the other Cε2 monomer (cartoon model colored in dark blue-green) in the Cε2 homodimer domain of the IgE- Fc/FcεRI complex. The surface of the heavy and the light chains of HMK-12 Fab are colored in ivory and red, respectively. The cartoon models of two Cε3 domains of the IgE-Fc/FcεRI complex are colored in dark green and violet, respectively. The surface model colored in cyan shows the FcεRI. The overlaps between HMK-12 Fab and Cε3 domain in the IgE-Fc/FcεRI complex are shown by dashed circles in (a, b). Shape of the surface of the HMK-12 Fab/IgE F(ab’)2 complex facing to the Cε3 domain. HMK-12 Fab heavy and light chains are colored in ivory and red, respectively, and IgE F(ab’)2 heavy and light chains in green and cyan. The arrow indicates the twofold axis through the center of the Cε2 homodimer.
Recent progress has demonstrated the importance of asymmetric spatial arrangement of IgE-Fc domains for the exceptionally slow dissociation rate of IgE–FcεRI complexes12,41,42. The surface of the IgE/HMK-12 Fab complex, which would face Cε3 domains in the case of intact IgE, adopts a twofold rotation symmetric concave shape (Fig. 6c). Because the C-terminal ends of two Cε2 domains (shown by “CCε2” in Fig. 6c) exist at the bottom of the twofold rotation symmetric concave, the twofold rotation symmetric concave shape seems to be able to impose twofold rotation symmetry like restriction on spatial arrangement of Cε3 domains connecting to the C-terminal ends leading to some distortion of the asymmetric spatial arrangement of IgE-Fc domains. This might be a cause of the removal of IgE from the receptor complex or inhibition of receptor complex formation. Twofold rotation symmetry as a structural feature is generally expected for a homodimer. Thus, antibodies which recognize the half of Cε2 facing to Cε3 could have a characteristic similar to HMK-12.
Further characterization of HMK-12 Fab might explain why this antibody could inhibit anaphylactic reactions even after exposure to allergen challenge. In the near future, allosteric regulation of IgE–FcεRI interactions in human IgE system may offer promising therapeutic options for prevention and treatment of allergic diseases.
Methods
Animals and cells
Female Sprague‒Dawley rats (male, 6–10 weeks) were purchased from SLC Inc., Japan and maintained under specific pathogen-free (SPF) conditions at the animal facility of Juntendo University. To perform experiments under the same conditions without bias, they were allowed to acclimate for 7 days before being assigned. All animal studies were performed according to the National Institute of Health Guidelines for Care and Use of Laboratory Animals. The experimental protocol was approved by the Animal Experimentation Committee of Juntendo University (Registration Number 1181, Approval Number 260229). We have complied with all relevant ethical regulations for animal use.
Mouse mast cells (PT18), generous gifts from Dr. C. Ra (Department of Immunology, Nippon University, Tokyo, Japan), were cultured in Dulbecco’s Modified Eagle Medium (DMEM) (Gibco, Carlsbad, CA) supplemented with 10% heat-inactivated FCS, 3 mM l-glutamine, 1 mM sodium pyruvate with penicillin (100 U/ml), and streptomycin (100 μg/ml) and maintained in a humidified incubator (5% CO2) at 37 °C.
Monoclonal antibodies
SPE-7 IgE (anti-DNP murine IgE antibody) and SPE-7 IgE F(ab’)2 were purchased from Sigma‒Aldrich Co. LLC (USA) and Immuno-Biological Laboratories Co., Ltd. (Gunma, JAPAN), respectively. The rat monoclonal antibody HMK-12 (specific for murine IgE) was used as described previously43,44. Rat IgG anti-murine κ antibodies and HRP-labeled goat anti-rat IgG were purchased from BioLegend (CA, USA) and Jackson ImmunoResearch (PA, USA), respectively. Highly purified Fab fragments of HMK-12 were prepared using Ficin, a cysteine protease isolated from fig latex. Briefly, HMK-12 from rat ascites was purified by combined stepwise caprylic acid and ammonium sulfate treatment. The purified HMK-12 was dialyzed against 0.1 M citrate buffer (pH 6.0), and then n-octyl-β-D-glucoside (DOTITE) and L-cysteine (Wako) were added to bring their concentrations to 0.5 mM and 25 mM, respectively. HMK-12 (1 mg/ml) then twice digested 0.5 ml of the immobilized Ficin resin slurry (Thermo Scientific prod. # 44881) in the presence of 25 mM cysteine/citrate buffer. The samples were then centrifuged and purified with vivaspin (1,000,000) (Sartorius AG) to remove resin or undigested IgG. The resulting HMK-12 Fab fragments were further purified with Protein G columns (Thermo Fisher Scientific Inc.).
PCA reactions
PCA reactions were performed as previously described43–45. Several sites of freshly shaved skin of three rats for each group were injected intradermally with 0.2 ml of SPE-7 IgE (1 μg/ml). Two days later, 0.2 ml of HMK-12 Fab or anti-κ Fab (10 μg/ml) were injected before challenge with 1 ml of DNP-BSA in saline (1 mg/ml) containing 0.5% Evans blue. Extravasation of Evans blue from blood vessels into tissues was quantified by measuring absorbance at 620 nm. Absorbance values were compensated based on the tissue weight, and then a paired-samples t test was conducted to determine if there is a statistically significant difference between the means of two groups injected with HMK-12 Fab and anti-k Fab.
Flow cytometry analysis
Various concentrations of Alexa 488-labeled SPE-7 IgE were premixed with an excess (2 μM) of HMK-12 Fab or IgG2a Fab and incubated for 15 min at 37 °C. These mixtures were then added to PT18 mouse mast cells. After incubation for 20 min at 37 °C, the cells were washed twice with PBS and analyzed using a FACSCelesta flow cytometer (Becton-Dickenson, CA, USA) (Supplementary Fig. 4).
To investigate the dissociation efficiency of preformed IgE–FcεRI complexes by HMK-12 Fab, 1 × 10⁷ PT18 cells were preincubated with 0.2 μM Alexa 488-labeled SPE-7 IgE for 15 min at 37 °C. The cells were washed twice to remove excess unbound antibodies and incubated with HMK-12 Fab or IgG2a Fab at various temperatures (2, 25, and 37 °C) for 5, 15, and 75 min, then further washed and analyzed using a FACSCelesta flow cytometer.
To reconfirm the dissociation of IgE–FcεRI complexes, 1 × 10⁷ PT18 cells were preincubated with 0.2 μM Alexa 488-labeled SPE-7 IgE for 15 min at 37 °C. After a washing step, they were incubated with HMK-12 Fab or IgG2a Fab at 37 °C for 15 and 60 min, and the fluorescence intensity was determined using a FACSCelesta flow cytometer. To measure the level of dissociated SPE-7 IgE, culture supernatants were added to DNP-BSA-coated plates to capture SPE-7 IgE/HMK-12 Fab immune complexes and assessed by ELISA using HRP-labeled anti-rat IgG (Fab’)2 secondary antibodies.
ELISA and western blot analysis
SPE-7 IgE was reduced with 2.5% 2-mercaptoethanol (2-ME) for 1 hr at 37 °C. Reduced and non-reduced SPE-7 IgE (2 μg/ml) were plated onto ELISA microplate (Corning 3690, Costar Assay Plate 96 Well Clear Flat Bottom Half Area High Binding). The microplate was washed with 0.05% Tween/PBS (T-TBS) and incubated with biotinylated HMK-12 Fab or 6HD5 Fab for 1 h at room temperature. After washing with T-TBS, the microplate was blocked with Block Ace (KAC Co., LTD) and incubated with horseradish peroxidase (HRP)-conjugated streptavidin (Jackson Laboratory), followed by TMB Peroxidase EIA Substrate Kit (BIORAD). The color change was then measured spectrophotometrically at a wavelength of 450 nm using SpectraMAX ABS Plus (Molecular Devices).
To examine how HMK-12 Fab reacts with IgE during the process of reduction, SPE-7 IgE was treated with a serial dilution of dithiothreitol (DTT: 5–20 mM) for 60 min at room temperature. The samples were then incubated with 5 μl of 1.5 M Tris-HCl (pH 8.8) and 10 μl of iodoacetamide (IAA) for 30 min on ice. After dialysis, the samples were subjected to SDS‒PAGE under non-reducing conditions, followed by western blot analysis. To define the epitopes on the IgE dimers recognized by HMK-12 Fab, SPE-7 IgE was digested with pepsin at pH 3.8 or pH 4.5 and then analyzed for HMK-12 Fab reactivity with SDS‒PAGE under non-reducing conditions followed by western blot analysis.
Crystallization
The peak fractions in Supplementary Fig. S1C containing HMK-12 Fab/IgE F(ab’)2 complexes were mixed and used for crystallographic studies. After addition of sodium azide at a final concentration of 0.001%(w/v), mixed fractions were concentrated to 13.3 mg/ml by Viva spin with Mwco 10,000 and equilibrated with 20 mM Hepes-NaOH (pH 7.5) containing 0.15 M NaCl and 0.001 mM β-octylglucoside.
Crystallization was performed by the hanging drop vapor diffusion method. Droplets were prepared by mixing 0.1 µl of the concentrated complex sample with 0.1 µl of a reservoir solution (14% (w/v) PEG3350, 0.09 M MES-NaOH (pH 6.5), 0.09 M Magnesium acetate, and 0.09% (w/v) β-octylglucoside, 0.1 M NDSB-256), and equilibrated in 50 µl of reservoir solution at 4 °C. Prior to crystal freezing for X-ray diffraction experiments, 0.2 µl cryoprotectant solution (15% (w/v) PEG3350, 0.1 M MES-NaOH (pH 6.5), 0.1 M Magnesium acetate, and 0.1% (w/v) β-octylglucoside, 0.1 M NDSB-256, 40% (v/v) ethylene glycol) were added to crystallization droplets containing needle-like micro-crystals with dimensions of several tens of µm long and a few µm thickness.
Diffraction experiments and structure analysis
X-ray diffraction experiments and diffraction image processing were performed with BL32XU/SPring-8 automatically using the ZOO system in the multi-crystal data collection mode46. The X-ray wavelength was 1.0 Å and diffraction images were collected for 348 crystals maintained in a 100 K N2 gas stream. Processing was to a diffraction intensity data at 2.9 Å resolution with CC0.5 of 0.899 at the highest-resolution shell from 3.00 Å to 2.90 Å. Details of diffraction intensity data are provided in Supplementary Table S1.
The molecular replacement method using program phenix.phaser with initial models of PDB ID 1i9i for IgG Fab, PDB ID 2vxq for IgE Fab and PDB ID 1o0v for IgE Cε2 was employed for initial phase calculation45. Structural refinement with programs of phenix.refine and phenix.rosetta_refine and manual model modification using COOT were performed iteratively until crystallographic R and Rfree factors converged to 0.228 and 0.267, respectively47–50. Ramachandran plot analysis showed that 95.7%, 3.9%, and 0.4% of amino acid residues were in favored, allowed and outliers areas, respectively. Details of statistics of structural refinement are given in Table 1. Program Pymol was used to prepare figures for structural models in this work. PISA provided by EMBL-EBI was used for protein–protein interface analysis37.
Reporting summary
Further information on research design is available in the Nature Portfolio Reporting Summary linked to this article.
Supplementary information
Description of Additional Supplementary Files
Acknowledgements
The authors are grateful to Dr. Junichiro Matsuda and Dr. Yoichi Shinkai for valuable advice regarding our research collaboration. This study was supported by the Japan Society for the Promotion of Science (JSPS): Grant Number: 21K08447. The authors are grateful to the beamline staff of SPring-8 BL32XU (Hyogo, Japan) for supporting the X-ray diffraction data collection. This research was partially supported by the Platform Project for Supporting Drug Discovery and Life Science Research (Basis for Supporting Innovative Drug Discovery and Life Science Research (BINDS)) from AMED under Grant Number JP21am0101070.
Author contributions
Conceptualization: T.H., A.K., M.K., K.O., and J.K. Methodology: T.H., A.K., and H.A. Funding acquisition: T.H. and M.Y. Project administration: T.H. and A.K. Supervision: K.O., M.Y., and J.K. Writing: T.H., A.K., M.K., H.A., and M.Y. All authors discussed the data, read, and edited the manuscript.
Peer review
Peer review information
Communications Biology thanks the anonymous reviewers for their contribution to the peer review of this work. Primary Handling Editors: Theam Soon Lim, Anam Akhtar, and Dario Ummarino. A peer review file is available.
Data availability
The structural coordinates and the structure factors were deposited to the protein data bank with PDB ID 8XX0. The numerical source data behind the main figures are available in Supplementary Data. All data displayed in the Supplementary Figs. are available from the corresponding author upon reasonable request.
Competing interests
The authors declare no competing interests.
Footnotes
Publisher’s note Springer Nature remains neutral with regard to jurisdictional claims in published maps and institutional affiliations.
Supplementary information
The online version contains supplementary material available at 10.1038/s42003-024-06633-4.
References
- 1.Prescott, S. L. et al. A global survey of changing patterns of food allergy burden in children. World Allergy Organ J.6, 21 (2013). 10.1186/1939-4551-6-21 [DOI] [PMC free article] [PubMed] [Google Scholar]
- 2.Ishizaka, K., Ishizaka, T. & Hornbrook, M. M. Physico-chemical properties of human reaginic antibody. IV. Presence of a unique immunoglobulin as a carrier of reaginic activity. J. Immunol.97, 75–85 (1966). 10.4049/jimmunol.97.1.75 [DOI] [PubMed] [Google Scholar]
- 3.Ishizaka, K. & Ishizaka, T. Identification of IgE. J. Allergy Clin. Immunol.137, 1646–1650 (2016). 10.1016/j.jaci.2015.12.1343 [DOI] [PubMed] [Google Scholar]
- 4.Gould, H. J. et al. The biology of IGE and the basis of allergic disease. Annu. Rev. Immunol.21, 579–628 (2003). 10.1146/annurev.immunol.21.120601.141103 [DOI] [PubMed] [Google Scholar]
- 5.Turner, P. J. et al. Increase in anaphylaxis-related hospitalizations but no increase in fatalities: an analysis of United Kingdom national anaphylaxis data, 1992-2012. J. Allergy Clin. Immunol.135, 956–963 (2015). 10.1016/j.jaci.2014.10.021 [DOI] [PMC free article] [PubMed] [Google Scholar]
- 6.Jerschow, E., Lin, R. Y., Scaperotti, M. M. & McGinn, A. P. Fatal anaphylaxis in the United States, 1999-2010: temporal patterns and demographic associations. J. Allergy Clin. Immunol.134, 1318–1328 (2014). 10.1016/j.jaci.2014.08.018 [DOI] [PMC free article] [PubMed] [Google Scholar]
- 7.Sanjuan, M. A., Sagar, D. & Kolbeck, R. Role of IgE in autoimmunity. J. Allergy Clin. Immunol.137, 1651–1661 (2016). 10.1016/j.jaci.2016.04.007 [DOI] [PubMed] [Google Scholar]
- 8.Holowka, D. & Baird, B. Structural studies on the membrane-bound immunoglobulin E-receptor complex. 1. Characterization of large plasma membrane vesicles from rat basophilic leukemia cells and insertion of amphipathic fluorescent probes. Biochemistry22, 3466–3474 (1983). 10.1021/bi00283a025 [DOI] [PubMed] [Google Scholar]
- 9.Zheng, Y., Shopes, B., Holowka, D. & Baird, B. Conformations of IgE bound to its receptor Fc epsilon RI and in solution. Biochemistry30, 9125–9132 (1991). 10.1021/bi00102a002 [DOI] [PubMed] [Google Scholar]
- 10.Drinkwater, N. et al. Human immunoglobulin E flexes between acutely bent and extended conformations. Nat. Struct. Mol. Biol.21, 397–404 (2014). 10.1038/nsmb.2795 [DOI] [PMC free article] [PubMed] [Google Scholar]
- 11.Beavil, A. J., Young, R. J., Sutton, B. J. & Perkins, S. J. Bent domain structure of recombinant human IgE-Fc in solution by X-ray and neutron scattering in conjunction with an automated curve fitting procedure. Biochemistry34, 14449–14461 (1995). 10.1021/bi00044a023 [DOI] [PubMed] [Google Scholar]
- 12.Wan, T. et al. The crystal structure of IgE Fc reveals an asymmetrically bent conformation. Nat. Immunol.3, 681–686 (2002). 10.1038/ni811 [DOI] [PubMed] [Google Scholar]
- 13.Ishizaka, T. & Ishizaka, K. Activation of mast cells for mediator release through IgE receptors. Prog. Allergy34, 188–235 (1984). [PubMed] [Google Scholar]
- 14.Serafin, W. E. & Austen, K. F. Mediators of immediate hypersensitivity reactions. New Engl. J. Med.317, 30–34 (1987). 10.1056/NEJM198707023170106 [DOI] [PubMed] [Google Scholar]
- 15.Metzger, H. The receptor with high affinity for IgE. Immunol. Rev.125, 37–48 (1992). 10.1111/j.1600-065X.1992.tb00624.x [DOI] [PubMed] [Google Scholar]
- 16.Zellweger, F. & Eggel, A. IgE-associated allergic disorders: recent advances in etiology, diagnosis, and treatment. Allergy71, 1652–1661 (2016). 10.1111/all.13059 [DOI] [PubMed] [Google Scholar]
- 17.Stokes, J. R. & Casale, T. B. The use of anti-IgE therapy beyond allergic asthma. J. Allergy Clin. Immunol. Pr.3, 162–166 (2015). 10.1016/j.jaip.2014.10.010 [DOI] [PubMed] [Google Scholar]
- 18.Kawakami, T. & Blank, U. From IgE to Omalizumab. J. Immunol.197, 4187–4192 (2016). 10.4049/jimmunol.1601476 [DOI] [PMC free article] [PubMed] [Google Scholar]
- 19.Chipps, B. E. et al. Omalizumab in children with uncontrolled allergic asthma: Review of clinical trial and real-world experience. J. Allergy Clin. Immunol.139, 1431–1444 (2017). 10.1016/j.jaci.2017.03.002 [DOI] [PubMed] [Google Scholar]
- 20.MacGinnitie, A. J. et al. Omalizumab facilitates rapid oral desensitization for peanut allergy. J. Allergy Clin. Immunol.139, 873–881 (2017). 10.1016/j.jaci.2016.08.010 [DOI] [PMC free article] [PubMed] [Google Scholar]
- 21.Lawrence, M. G. et al. Half-life of IgE in serum and skin: consequences for anti-IgE therapy in patients with allergic disease. J. Allergy Clin. Immunol.139, 422–428 (2017). 10.1016/j.jaci.2016.04.056 [DOI] [PMC free article] [PubMed] [Google Scholar]
- 22.Presta, L. G. et al. Humanization of an antibody directed against IgE. J. Immunol.151, 2623–2632 (1993). 10.4049/jimmunol.151.5.2623 [DOI] [PubMed] [Google Scholar]
- 23.Jardieu, P. M. & Fick, R. B. Jr. IgE inhibition as a therapy for allergic disease. Int. Arch. Allergy Immunol.118, 112–115 (1999). 10.1159/000024043 [DOI] [PubMed] [Google Scholar]
- 24.Boulet, L. P. et al. Inhibitory effects of an anti-IgE antibody E25 on allergen-induced early asthmatic response. Am. J. Respir. Crit. Care Med.155, 1835–1840 (1997). 10.1164/ajrccm.155.6.9196083 [DOI] [PubMed] [Google Scholar]
- 25.Maurer, M. et al. Omalizumab treatment in patients with chronic inducible urticaria: a systematic review of published evidence. J. Allergy Clin. Immunol.141, 638–649 (2018). 10.1016/j.jaci.2017.06.032 [DOI] [PubMed] [Google Scholar]
- 26.Hirano, T. et al. The Fab fragment of anti-IgE Cε2 domain prevents allergic reactions through interacting with IgE-FcεRIα complex on rat mast cells. Sci. Rep.8, 14237 (2018). 10.1038/s41598-018-32200-z [DOI] [PMC free article] [PubMed] [Google Scholar]
- 27.McDonnell, J. M. et al. The structure of the IgE Cepsilon2 domain and its role in stabilizing the complex with its high-affinity receptor FcepsilonRIalpha. Nat. Struct. Biol.8, 437–441 (2001). 10.1038/87603 [DOI] [PubMed] [Google Scholar]
- 28.Eggel, A. et al. Accelerated dissociation of IgE-FcεRI complexes by disruptive inhibitors actively desensitizes allergic effector cells. J. Allergy Clin. Immunol.133, 1709–1719 (2014). 10.1016/j.jaci.2014.02.005 [DOI] [PMC free article] [PubMed] [Google Scholar]
- 29.Davies, A. M. et al. Allosteric mechanism of action of the therapeutic anti-IgE antibody omalizumab. J. Biol. Chem.292, 9975–9987 (2017). 10.1074/jbc.M117.776476 [DOI] [PMC free article] [PubMed] [Google Scholar]
- 30.Pennington, L. F. et al. Structure-guided design of ultrapotent disruptive IgE inhibitors to rapidly terminate acute allergic reactions. J. Allergy Clin. Immunol.148, 1049–1060 (2021). 10.1016/j.jaci.2021.03.050 [DOI] [PMC free article] [PubMed] [Google Scholar]
- 31.Laffer, S. et al. A high-affinity monoclonal anti-IgE antibody for depletion of IgE and IgE-bearing cells. Allergy63, 695–702 (2008). 10.1111/j.1398-9995.2008.01664.x [DOI] [PubMed] [Google Scholar]
- 32.Jabs, F. et al. Trapping IgE in a closed conformation by mimicking CD23 binding prevents and disrupts FcεRI interaction. Nat. Commun.9, 7 (2018). 10.1038/s41467-017-02312-7 [DOI] [PMC free article] [PubMed] [Google Scholar]
- 33.McDonnell, J. M., Dhaliwal, B., Sutton, B. J. & Gould, H. J. IgE, IgE receptors and anti-IgE biologics: protein structures and mechanisms of action. Annu. Rev. Immunol.41, 255–275 (2023). 10.1146/annurev-immunol-061020-053712 [DOI] [PubMed] [Google Scholar]
- 34.Miyajima, H., Watanabe, N., Ovary, Z., Okumura, K. & Hirano, T. Rat monoclonal anti-murine IgE antibody removes IgE molecules already bound to mast cells or basophilic leukemia cells, resulting in the inhibition of systemic anaphylaxis and passive cutaneous anaphylaxis. Int. Arch. Allergy Immunol.128, 24–32 (2002). 10.1159/000058000 [DOI] [PubMed] [Google Scholar]
- 35.Hirano, T. et al. Studies on murine IgE with monoclonal antibodies. I. Characterization of rat monoclonal anti-IgE antibodies and the use of these antibodies for determinations of serum IgE levels and for anaphylactic reactions. Int. Arch. Allergy Appl Immunol.85, 47–54 (1988). 10.1159/000234473 [DOI] [PubMed] [Google Scholar]
- 36.Jensen, R. K. et al. Structure of intact IgE and the mechanism of ligelizumab revealed by electron microscopy. Allergy75, 1956–1965 (2020). 10.1111/all.14222 [DOI] [PubMed] [Google Scholar]
- 37.Krissinel, E. & Henrick, K. Inference of macromolecular assemblies from crystalline state. J. Mol. Biol.372, 774–797 (2007). 10.1016/j.jmb.2007.05.022 [DOI] [PubMed] [Google Scholar]
- 38.Metzger, H. Fc receptors and membrane immunoglobulin. Curr. Opin. Immunol.3, 40–46 (1991). 10.1016/0952-7915(91)90074-B [DOI] [PubMed] [Google Scholar]
- 39.Ravetch, J. V. & Kinet, J. P. Fc receptors. Annu. Rev. Immunol.9, 457–492 (1991). 10.1146/annurev.iy.09.040191.002325 [DOI] [PubMed] [Google Scholar]
- 40.Guntern, P. & Eggel, A. Past, present, and future of anti-IgE biologics. Allergy75, 2491–2502 (2020). 10.1111/all.14308 [DOI] [PMC free article] [PubMed] [Google Scholar]
- 41.Holdom, M. D. et al. Conformational changes in IgE contribute to its uniquely slow dissociation rate from receptor FcɛRI. Nat. Struct. Mol. Biol.18, 571–576 (2011). 10.1038/nsmb.2044 [DOI] [PMC free article] [PubMed] [Google Scholar]
- 42.Garman, S. C., Wurzburg, B. A., Tarchevskaya, S. S., Kinet, J. P. & Jardetzky, T. SStructure of the Fc fragment of human IgE bound to its high-affinity receptor Fc epsilon RI alpha. Nature406, 259–266 (2000). 10.1038/35018500 [DOI] [PubMed] [Google Scholar]
- 43.Ovary, Z., Caiazza, S. S. & Kojima, S. PCA reactions with mouse antibodies in mice and rats. Int. Arch. Allergy Appl. Immunol.48, 16–21 (1975). 10.1159/000231289 [DOI] [PubMed] [Google Scholar]
- 44.Usui, M. et al. Construction of a monoclonal antibody against Igh-7a. Immunogenetics37, 301–304 (1993). 10.1007/BF00187459 [DOI] [PubMed] [Google Scholar]
- 45.Katayama, S., Shionoya, H. & Ohtake, S. A new method for extraction of extravasated dye in the skin and the influence of fasting stress on passive cutaneous anaphylaxis in guinea pigs and rats. Microbiol. Immunol.22, 89–101 (1978). 10.1111/j.1348-0421.1978.tb00352.x [DOI] [PubMed] [Google Scholar]
- 46.Hirata, K. et al. ZOO: an automatic data-collection system for high-throughput structure analysis in protein microcrystallography. Acta Crystallogr. Sect. D. Struct. Biol.75, 138–150 (2019). 10.1107/S2059798318017795 [DOI] [PMC free article] [PubMed] [Google Scholar]
- 47.Liebschner, D. et al. Macromolecular structure determination using X-rays, neutrons and electrons: recent developments in Phenix. Acta Crystallogr D. Struct. Biol.75, 861–877 (2019). 10.1107/S2059798319011471 [DOI] [PMC free article] [PubMed] [Google Scholar]
- 48.Winn, M. D. et al. Overview of the CCP4 suite and current developments. Acta Crystallogr. Sect. D. Biol. Crystallogr.67, 235–242 (2011). 10.1107/S0907444910045749 [DOI] [PMC free article] [PubMed] [Google Scholar]
- 49.Adams, P. D. et al. PHENIX: a comprehensive Python-based system for macromolecular structure solution. Acta Crystallogr. D. Biol. Crystallogr.66, 213–221 (2010). 10.1107/S0907444909052925 [DOI] [PMC free article] [PubMed] [Google Scholar]
- 50.Martin, A. C. R. Protein sequence and structure analysis of antibody variable domains. In Antibody Engineering. Springer Protocols Handbooks (eds Kontermann, R. & Dübel, S.) 33–51 (Springer, Berlin, Heidelberg, 2010).
Associated Data
This section collects any data citations, data availability statements, or supplementary materials included in this article.
Supplementary Materials
Description of Additional Supplementary Files
Data Availability Statement
The structural coordinates and the structure factors were deposited to the protein data bank with PDB ID 8XX0. The numerical source data behind the main figures are available in Supplementary Data. All data displayed in the Supplementary Figs. are available from the corresponding author upon reasonable request.