Abstract
In ophthalmology, artificial intelligence methods show great promise due to their potential to enhance clinical observations with predictive capabilities and support physicians in diagnosing and treating patients. This paper focuses on modelling glaucoma evolution because it requires early diagnosis, individualized treatment, and lifelong monitoring. Glaucoma is a chronic, progressive, irreversible, multifactorial optic neuropathy that primarily affects elderly individuals. It is important to emphasize that the processed data are taken from medical records, unlike other studies in the literature that rely on image acquisition and processing. Although more challenging to handle, this approach has the advantage of including a wide range of parameters in large numbers, which can highlight their potential influence. Artificial neural networks are used to study glaucoma progression, designed through successive trials for near-optimal configurations using the NeuroSolutions and PyTorch frameworks. Furthermore, different problems are formulated to demonstrate the influence of various structural and functional parameters on the study of glaucoma progression. Optimal neural networks were obtained using a program written in Python using the PyTorch deep learning framework. For various tasks, very small errors in training and validation, under 5%, were obtained. It has been demonstrated that very good results can be achieved, making them credible and useful for medical practice.
Keywords: Glaucoma, Artificial neural networks, Simulation studies, Modelling and optimization
Subject terms: Applied mathematics, Diseases, Eye diseases, Optic nerve diseases
Introduction
Artificial intelligence (AI) is currently one of the fastest-evolving fields, notable for its diverse techniques and applications areas. Modern medicine requires the acquisition, analysis, and processing of large amounts of data to address complex clinical tasks. In this context, AI serves as a valuable tool for clinicians, which aids in therapeutic decision-making and provides predictions that extend beyond available data.
Artificial neural networks (ANN) are modelling and classification tools with the ability to learn different types of relationships from available data. They can approximate any continuous nonlinear function, and are effective for modelling complex nonlinear systems. ANNs draw inspiration from biological neurons and the structure of the nervous system. A biological neuron comprises three main components: the cell body, dendrites, and axon, with synapses facilitating connections. These elements have artificial counterparts in the basic units of neural networks. An artificial neuron receives inputs, possibly from other neurons, each associated with a connection weight. It calculates a weighted sum of these inputs and then applies an activation function to compute the output, which can be further transmitted to other neurons.
Glaucoma is a chronic, progressive, irreversible, multifactorial optic neuropathy that mainly affects elderly people, requiring early diagnosis, individualized treatment, and lifelong monitoring.
There are many approaches in the literature that report the study of glaucoma evolution using neural networks, original articles, and numerous reviews. Mainly, there are two categories of approaches based on the data’s origin: from images or medical records, with the former being more numerous given the ease and accuracy of image acquisition. There are specific AI algorithms for segmenting and automatically enhancing ocular images from optical coherence tomography (OCT) and processing fundus images.
On the other hand, using data from medical records is more laborious because it requires comprehensive datasets, but, by processing these data with AI algorithms, more information can be obtained, useful for the ophthalmologist, as the dataset can include numerous analyses, possibly influencing glaucoma.
The most common use of artificial intelligence techniques in ophthalmology has been in the early diagnosis of glaucoma when there are diagnostic doubts. Neural networks, in particular, have played a significant role in determining the need for early antiglaucoma therapy to prevent disease progression.
The first studies on using ANNs in interpreting incipient perimetric lesions in glaucoma belong to Anton et al.1. The authors concluded that neural networks can differentiate incipient lesions caused by glaucoma from those caused by other diseases with 97% accuracy.
In 2005, Bowd et al.2 used two algorithms (RVM—Relevance Vector Machine and SVM—Support Vector Machine) for classifying healthy eyes and eyes affected by glaucoma, using information based on the retinal nerve fiber layer (RNFL) and thickness measurements obtained through scanning laser polarimetry (SLP).
Previously, the same author3 had used different artificial intelligence tools to determine the evolutionary changes in the visual field in glaucoma patients and predict the glaucoma stage. Similar concerns were held by Simon et al.4, Hernández et al.5, Grewal et al.6, Parsaei et al.7, who used various artificial intelligence tools (neural networks with different learning algorithms) to determine possible visual field progression in glaucoma patients.
Zhu et al.8 developed a neural network using a Bayesian-type function to establish the relationship between structure and visual function in glaucoma; the results showed that the network could improve the prediction of visual function. Based on the analysis of the specialized literature, they showed that diabetes is an individual risk factor for the development of open-angle glaucoma.
An interesting study on the utility of ANNs in ophthalmology is found in a doctoral thesis at UMF Iași9. For the first time, artificial neural networks are used to demonstrate the existence of a relationship between glaucoma and diabetes, as well as in predicting the progression of diabetic ocular changes (diabetic retinopathy) in patients with glaucoma and diabetes. The constructed neural models demonstrated the possibility of using them in predicting mean deviation (MD) deterioration, with the best results obtained using Jordan Elman-type neural networks10.
In a recent review, Devalla et al.11 discuss the role of AI in glaucoma diagnosis and prognosis. They show that while early studies relied on simple ANNs to detect glaucoma using perimetric data (visual field), modern deep learning (DL) systems have successfully exploited high-resolution images from fundus photography and OCT. The use of AI algorithms can help, by collecting data from multiple tests, to detect anomalies, and perform relevant screenings. This reduces the workload for clinicians, minimizes diagnostic errors, and improves the quality of care for glaucoma patients. This will lead to early detection of glaucoma and promote research and development of new drugs in treatment. Also, pre-perimetric changes can be identified, likely leading to advances in research and clinical practice.
Bizios et al.12 conducted a study comparing artificial neural networks and support vector machines for glaucoma diagnosis, measuring the thickness of the retinal nerve fiber layer obtained with OCT. Both algorithms provided satisfactory results.
Yousefi et al.13 developed a DL-based algorithm that detected visual field (VF) progression earlier than conventional strategies. Although lowering intraocular pressure (IOP) has proven to be therapeutically effective in delaying glaucoma progression, some authors have shown that disease progression is still inevitable, suggesting that optimal treatment regimens for different forms of glaucoma have not yet been achieved.
Guangzhou et al.14 published a study addressing the task of optic disc classification in glaucoma. A total of 163 eyes from 105 glaucoma patients were utilized, divided into training and testing datasets, to establish classification criteria to aid clinical assistance in glaucoma management. Ocular images were obtained using optical coherence tomography techniques and retinal perfusion was investigated using laser flowgraphy. A total of 91 parameters were extracted from each eye, and general patient information was included. Classification methods tested in the study included neural networks, naive Bayes classifiers, support vector machines, and gradient boosted decision trees. The results of the performance comparison of the three classification methods showed that neural networks achieved the best classification with an accuracy of 87.8% using only nine ocular parameters.
The study of glaucoma progression, through simulation with artificial intelligence tools, consisted of structural, functional, or mixed approaches.
Functionally, several studies have been conducted aiming to compare the performance of various machine learning classifiers with global indices from STATPAC and human experts15–17.
Visual fields are used as input data, and the classifiers’ ability to predict the development of abnormal fields in subsequent examinations of hypertensive eyes (OHT) with initially normal visual fields is evaluated, as well as to identify and quantify areas of progression in standard automated perimetry fields18.
In addition, some studies compare the performance of machine learning algorithms with traditional algorithms in detecting glaucomatous visual field defects. The studies employ various techniques such as multi-layer perceptrons (MLP), support vector machines (SVM), Gaussian classifiers (MoG), generalized Gaussian classifiers (MGG), variational Bayesian independent component analysis models (vB-ICA-mm), and deep convolutional neural networks (CNN)19,20. Results indicate that machine learning algorithms can improve STATPAC global indices and identify glaucomatous changes earlier in standard visual fields, sometimes up to 3.92 years earlier than traditional methods.
It is concluded that machine learning algorithms have the potential to reduce testing time by decreasing the number of visual field location measurements. Moreover, the results show that machine learning algorithms have higher diagnostic performance compared to traditional algorithms, and the proposed glaucoma progression index based on CNN and machine learning outperforms global, regional, and point indices in detecting longitudinal visual field progression in glaucoma.
On the other hand, various studies have focused on detecting structural progression in glaucoma by analysing OCT and fundus images with AI and DL algorithms.
The first study mentioned was conducted by Christopher et al.21, which used PCA to identify new glaucoma-related structural features based on SS-OCT images. This study obtained significantly higher accuracy for glaucoma detection with an AUC of 0.95.
The second study, conducted by Medeiros et al.22, used a deep learning convolutional neural network to predict average RNFL thickness based on fundus photographs, achieving good performance in discriminating glaucomatous eyes from healthy eyes.
Devalla et al.11 reviewed the role of AI in glaucoma diagnosis and prognosis, discussing the advantages and challenges of using AI systems in clinics and predicting potential areas of progress in the future in this field.
Another study, conducted by Ran et al.23, discussed the potential clinical impact of DL models and identified areas for future research.
In 2022, Hood et al.24 described an automated method for detecting glaucoma without the need for a clinician’s judgment, using a simple anatomical artifact model to help distinguish artifacts from actual glaucomatous changes in OCT probability maps. In the same year, Li et al.25 developed a deep learning system for the automatic detection of angle closure in AS-OCT images. The results showed that the deep learning system performed better compared to the one based on quantitative features.
Chaurasia et al.26 conducted, in 2022, a meta-analysis to determine the overall performance of AI in glaucoma diagnosis and identify potential factors affecting their implementation. The results showed that AI algorithms performed well in detecting glaucoma.
The specialized literature contains various hybrid studies (functional and structural approaches) that have used artificial intelligence for diagnosing and managing glaucoma. The studies included various combinations of techniques, such as ANN, optical coherence tomography (OCT), standard automated perimetry (SAP), short-wavelength automated perimetry (SWAP), and confocal scanning laser ophthalmoscopy (CSLO).
As early as 1996, Brigatti et al.27 used a two-layer back-propagation network to assign each eye an estimated probability of having glaucoma and correctly identified 88% of all eyes with 90% sensitivity and 84% specificity.
Another study conducted by Mardin et al.28 used six different combinations of morphological data and visual field data to diagnose the disease, applying machine learning classifiers. The combination of Heidelberg Retina Tomograph (HRT), standard Octopus output (HRT/PERI1), and standard deviations (HRT/PERI2) achieved the highest sensitivity (95%) and specificity (91%).
Other studies16,29,30 have investigated the use of structural and functional measurements, such as OCT and standard automated perimetry SAP, using machine learning classifiers to identify eyes with glaucoma with high accuracy. These studies have shown that the optimized combination of data can improve diagnostic accuracy. In addition, some studies have investigated the use of an ANN-based approach to differentiate the diagnosis of open-angle glaucoma from glaucoma suspicion without a visual field test18 and found that this approach can be a cost-effective screening tool. Overall, these studies have shown that AI can be a powerful tool for diagnosing and managing open-angle glaucoma.
Modern AI algorithms are specifically adapted to extract significant features from complex and high-dimensional data for screening, diagnosis, management, and follow-up of glaucoma based on the interpretation of functional and/or structural parameters12,31.
Numerous other studies in specialized literature demonstrate the successful use of artificial intelligence tools in Ophthalmology, such as evaluating visual fields, optic nerves, retinal nerve fiber layers, thus providing better accuracy in identifying glaucoma progression and retinal changes in diabetes. The main advantages of using these techniques in medical diagnosis are: the ability to process large amounts of data, low probability of overlooking relevant information, and reduced time for diagnosing.
Singh et al.32–36 have important contributions in identification of symptoms for glaucoma and glaucoma affected retinal images, using Machine Learning or Deep Learning Techniques. They show that important steps in applying machine learning techniques for automatic detection of glaucoma are retinal image acquisition, image preprocessing, feature extraction, classification of symptoms of glaucoma affected image, and evaluating the performance33. In order to overcome some difficulties related to conventional diagnostic methods utilized by ophthalmologists, Singh et al.36 propose a computer-assisted diagnosis systems by using machine learning approaches to classify retinal pictures as “healthy” or “infected”. Different AI methodologies are explored for glaucoma detection: Differential Evolution based multi objective feature selection technique32, Particle Swarm Optimization34,36, Artificial Bee Colony, Binary Cuckoo Search, Random Forest, Support Vector Machine, used individually or in ensembles36. The efficiency of these methos has been proved by the obtained results—accuracy with value between 0.91 and 0.99.
The objective of the paper involves creating a database with medical records of glaucoma patients and formulating problems to determine relevant input and output parameters related to glaucoma progression. This includes selecting or developing suitable AI methodologies (artificial neural networks) and software, and comparing the effectiveness of different methods. Additionally, the results are compared with existing literature to highlight the benefits of simulations for glaucoma patients and ophthalmologists' decisions.
An important contribution of the research is the use of data from medical records, containing multiple information from investigations and visits, compared to most studies in the literature that address this topic and that use data from acquired images. The use of data from medical files allows the consideration of various information with possible influence in glaucoma. ANNs are developed using the NeuroSolutions and PyTorch frameworks. The best results are obtained in the second case, when the errors in the testing phase are very small, which gives credibility to the models and high chances that they can provide reliable and useful information to the specialist doctor. Therefore, the main original contribution of this work lie in the applied methodology, which includes extensive and diverse data extracted from the medical records of glaucoma patients, the formulation of problems to evaluate glaucoma progression, and the implementation of various neural network models using PyTorch.
The work is organized in the following sections: "Introduction", experimental part that includes "Datasets" and "Modelling methodology", "Results", "Discussion", "Conclusions" and References.
Datasets
Most simulation approaches in the literature for studying glaucoma use data acquired from images. These have several advantages related to the fact that they are numerous and accurate since the images are obtained with high-performance devices, and any number of points desired by the user can be read from an image.
Much more difficult and, therefore, less used, is the collection of data from medical records, each entry representing a consultation and results of a whole set of tests. Time and accuracy are the major difficulties in building the dataset. However, once such a task is formulated and addressed, the advantages become evident through the information that can be obtained about the factors influencing the disease, its progression, and even the most suitable treatment.
In this paper, glaucoma, a chronic, progressive, irreversible, and multifactorial optic neuropathy, is analysed using data from medical records.
To create the dataset, medical records of glaucoma patients examined at Countess of Chester Hospital in the UK were used, and the study was retrospective, following patients who had at least three consecutive check-ups between 2018 and 2021 and underwent all necessary investigations to be included in the study. Precise inclusion and exclusion criteria37 were established, and two distinct datasets were created.
Inclusion criteria for this study were: open-angle glaucoma or intraocular hypertension, with or without associated diabetes. Only patients who had the following investigations recorded at each of the three visits were selected: visual field assessment, macula and optic nerve OCT, intraocular pressure measurement on both eyes, visual acuity measurement, pachymetry, HbA1c measurement, and baseline IOP documented at the time of glaucoma diagnosis.
Criteria for the diagnosis of primary open-angle glaucoma (POAG) considered were: age over 40 years, IOP greater than 21 mm Hg without treatment at the time of diagnosis, open-angle in the anterior chamber upon gonioscopy, typical optic nerve damage in glaucoma (C/D ratio > 0.5), abnormal visual field (by Humphrey Field Analyzerperimetry), and retinal nerve fiber layer thickness impairment measured by Heidelberg OCT. Patients with ocular hypertension (OHT) were also included, with diagnostic criteria such as: age over 40 years, IOP greater than 21 mm Hg without treatment at the time of diagnosis, open-angle in the anterior chamber upon gonioscopy. These patients may have a normal visual field, normal optic nerve appearance (C/D ratio < 0.5), and normal retinal nerve layer thickness measured by OCT.
Our approach, based on modeling with artificial neural networks, starts with the following considerations regarding to normal values and deviations from them, for the quantities considered in the evaluation of glaucoma progression:
Mean Deviation (MD), with normal range greater than − 2 dB, measures the overall depression of the visual field. A value less than − 2 dB suggests abnormality, with more negative values indicating more severe loss.
Pattern Standard Deviation (PSD), with normal range close to 0 dB, indicates the irregularity of the visual field loss. Higher values suggest more localized defects; normal values are usually near 0, with higher values indicating glaucomatous damage.
Visual Field Index (VFI), with normal range of 100%, represents the percentage of normal visual function. Lower percentages indicate more significant visual field loss; normal values are near 100%, with lower values indicating more severe glaucoma.
Retinal Nerve Fiber Layer (RNFL), with normal range of 80–100 µm, is a critical indicator of glaucomatous damage. Values below the normal range suggest thinning due to glaucoma.
Intraocular Pressure (IOP), with normal range of 10–21 mmHg, is a significant risk factor for glaucoma. Values above 21 mmHg may indicate glaucoma or risk of developing it, although some patients with normal IOP can also have glaucoma (normal-tension glaucoma).
The medical investigations represented the 47 attributes, from which the inputs and outputs were selected for the modeling action, corresponding to the formulation of various problems through which the progression of glaucoma could be evaluated. Fifty patients were included in the database, each with three check-ups, resulting in 150 visits with 300 entries (for both eyes). These constitute the records or instances of the database. From this information, two datasets were formed: considering the visits of a patient as distinct records (dataset 1) and attributing these visits to the patient who performed them (dataset 2).
Compared to the modeling on dataset 1, where the values corresponding to each visit were considered as separate records (as if they belonged to different patients), in dataset 2 these values were attributed to the same patient, becoming additional inputs. The database thus configured includes 100 records (instances).
Various tasks were formulated in the sense of choosing different sets of input and output parameters because in this way there is the possibility of obtaining multiple and varied information. From this point of view, factors that may contribute to the progression of glaucoma were selected, such as: patient age, glaucoma age, intraocular pressure, central corneal thickness, phakic or pseudophakic status, as well as factors monitoring the severity of the disease: visual field values (VFI), mean deviation (MD), retinal nerve fiber layer thickness (RNFL). A binary encoding (0 and 1, Yes and No) was used to represent glaucoma progression. Inputs and outputs were different for different datasets, the distinct approaches aiming to obtain additional information about the studied conditions. Thus, modelling the dependence between functional and structural glaucomatous damage and common glaucoma risk factors was carried out in various ways, the results obtained providing information about the severity of the disease and recommended treatment. Alternatives for testing different influencing factors in glaucoma represent a study method of this condition, with possibilities to extract different information.
Modelling methodology
The tools used to monitor the evolution of glaucoma were artificial neural networks, designed using two methods: successive attempts with the NeuroSolutions program and an original implementation in PyTorch using the Python programming language.
Different types of neural models were tested, for which parameters that might influence the modelling results were varied: network topology, learning method, data partitioning into training and validation sets, transfer functions, the number of training epochs. The first model design method was based on trial and error, the error being evaluated at each variant, i.e., combination of parameters.
The first attempt to predict glaucoma progression using neural networks was based on the NeuroSolutions program, a specialized software product developed by Neurodimension. It allows the design, training, and validation of ANN models, as well as making predictions with them. Featuring a graphical user interface, the program can be easily operated by non-specialists who should nevertheless possess basic knowledge ANNs. It should be noted that the essential elements ensuring success in modelling are the quality of the dataset and the formulation of the task. Specifically, the data must be accurate, sufficiently large, and uniformly distributed across the investigated domain. In terms of task formulation, the inputs and outputs must be correctly chosen, considering the interdependencies and functional relationships between parameters.
A second methodology applied in this article is based on original programs written in Python using the PyTorch deep learning framework. PyTorch has implementations of several gradient-descent optimization algorithms, such as Adam (Adaptive Moment Estimation), RMSprop (Root Mean Square Propagation), or SGD (Stochastic Gradient Descent). In our case, the Adam algorithm was used. The parameters of the algorithm, such as the learning rate and regularization factor, should also be set. PyTorch has already implemented several loss such functions, but the choice here depends on the nature of the task. For example, for a classification task, the cross-entropy function can be used, while for a regression task, the mean square error can be used.
The training and prediction sections can be repeated a number of times to statistically estimate the performance of a combination of parameters. Both data partitioning into training and testing sets and optimization algorithm results are stochastic, so a statistical evaluation is beneficial.
In the case of both methods, different problems were formulated, aiming to track glaucoma progression through structural, functional, or combined (hybrid) parameters. By considering different input–output combinations, the attempts were made to highlight factors with significant influence on disease progression, these factors coming from data included in the patient files. In this way, through the predictions of neural models (credible predictions in the case of models with small testing errors), the ophthalmologist can have additional information and suggestions regarding the treatment to be followed.
Institutional review board
The study was approved by the Ethics Commission of the University Hospital Sf. Spiridon Iasi, approval no. 38/24.04.2023 and Countess of Chester Hospital, Liverpool Rd, Chester approved no. 28.04.2023, in compliance with ethical and deontological rules for medical and research practice. The study was conducted in accordance with the Helsinki Declaration.
Informed consent
Informed consent was obtained from all subjects involved in the study.
Results
Neural networks models determined using NeuroSolutions
Different tasks were formulated and solved on the two datasets, denoted 1 and 2, distinguished by differentiating the parameters corresponding to the three visits (dataset 2).
The following case studies were performed using dataset 1, which neglects the third visits.
Case study 1: modelling the dependence between functional and structural glaucomatous damage and common glaucoma risk factors. The factors that can contribute to glaucoma progression (patient age, glaucoma age, IOP, Base IOP, IOL, CCT) were selected as inputs and the variables that monitor the severity of the disease (VFI, PSD, RNFL) were selected as outputs. The lower the VFI, the higher the PSD, and the lower the RNFL values, the more advanced the glaucoma.
The testing plan included various neural network methodology options, evaluated by the mean square error (MSE) and the correlation coefficient (r). Specifically, we used neural networks with one or two layers and a variable number of intermediate neurons, different percentages for splitting data between training and testing sets (85–15%, 80–20%, 75–25%, 70–30%), training algorithms (backpropagation with momentum and Levenberg–Marquardt), and different numbers of training epochs (500, 2000, 10000, 20000).
An MLP(6:24:8:3) network (multilayer perceptron with 6 inputs and 3 outputs, and 2 hidden layers with 24 and 8 neurons) recorded very small training errors: an MSE ranging from 0.00012 (minimum) to 0.0163 (maximum), and an r ranging from 0.9493 to 0.99958. The average relative errors in training and testing phases for the three outputs were: 0.34% and 5.44% for VFI, 0.18% and 9.85% for PSD, and 1.96% and 14.79% for RNFL.
The results obtained are considered satisfactory in the context of formulating a complex task where the simultaneous prediction of three real-value outputs was sought: VFI, PSD, RNFL. But to increase the degree of confidence, other methods that improved the generalization capacity were further tested.
Case study 2: modelling the dependence between IOP, CCT, and the degree of visual field loss. In this study, a simpler model was sought with a single output, namely VFI. This parameter reflects the integrity of the visual field and extrapolates the degree of visual field loss in glaucoma. Three inputs were considered: baseline IOP, current visit IOP, and corneal thickness (pachymetry), as these three characteristics help to form an idea about the desired pressure control. The working parameters were: 75% of data for training and 25% for testing, the use of the Levenberg–Marquardt algorithm for training, the hyperbolic tangent (tanh) as the activation function, and different types of network architectures: multilayer perceptron, generalized feed-forward network, and Jordan-Elman network. The choice of the working characteristics for these models was made after comparing the results (i.e., errors) of successive trials.
The best ANN model was MLP(3:24:8:1) with an average percentage error of 0.20% in the training phase and 3.23% in the testing phase; these results can be appreciated as very good.
Figures 1 and 2 show the training and testing phases, respectively comparisons between VFI obtained from clinical observations and predictions of the best neural model.
Fig. 1.
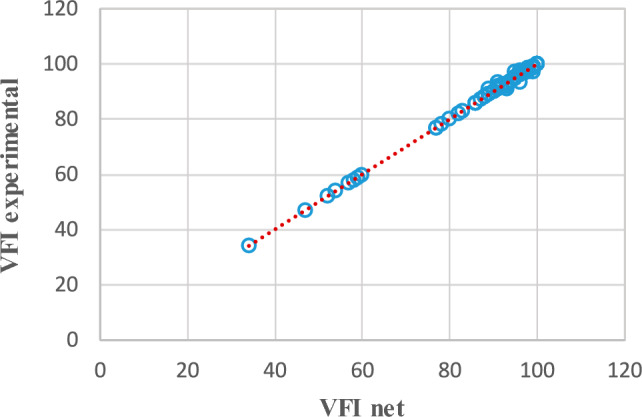
VFI—comparisons between clinical observations and predictions of the MLP(3:24:8:1) network in the training phase.
Fig. 2.
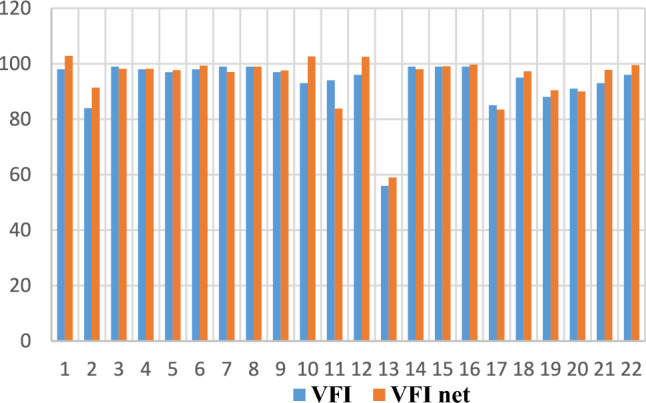
VFI—comparisons between clinical observations and predictions of the MLP(3:24:8:1) network in the testing phase.
In Fig. 1, corresponding to the training phase, the placement of the points on the line proves that the response of the neural network coincides with the VFI values obtained from clinical observations. Figure 2 reflects the fact that VFI obtained experimentally (from clinical observations, blue rectangles) has values close to those provided by the neural network (red rectangles). This being the testing phase, the good generalization capacity of the neural model is demonstrated, thus the high probability of predicting the evolution of glaucoma.
Case study 3: modelling the dependency between IOP, CCT, and the degree of optic nerve damage. Similar to the previous case study, the same inputs were maintained, namely baseline IOP, current visit IOP, and corneal thickness, and the output considered was the thickness of the retinal nerve fiber layers (RNFL), which reflects the degree of structural damage in glaucoma based on the same three inputs.
The best model, MLP(3:24:8:1), was obtained with MSE = 0.0000845, r = 0.9997, average training error = 0.11%, and average testing error = 5.44%, which also represent satisfactory results.
In this case, where RNFL was considered as the only output, the average testing error was 5.44%, compared to the modelling in case study 1, where RNFL was one of the three outputs, and the testing error was 14.79%. This improvement comes from changing the task formulation of mapping the inputs to outputs, which led to more accurate predictions.
Case study 4, inputs: patient age, patient sex, glaucoma age, diabetes age, HbA1c, B-IOP, IOP, IOL, CCT, output: VFI. The best model was MLP(9:36:9:1), obtained with MSE = 0.000001, r = 0.999984, and Ep = 0.05%.
Case study 5, inputs: patient age, patient sex, glaucoma age, diabetes age, HbA1c, B-IOP, IOP, IOL, CCT, output: MD. The best model was MLP(9:36:9:1), obtained with MSE = 0.000004, r = 0.999933, and Ep = 0.05%.
Case study 6, inputs: patient age, patient sex, glaucoma age, diabetes age, HbA1c, B-IOP, IOP, IOL, CCT, output: PSD. The best model was MLP(9:36:9:1), obtained with MSE = 0.000004, r = 0.999633, and Ep = 2.088632%.
Case study 7, inputs: patient age, patient sex, glaucoma age, diabetes age, HbA1c, B-IOP, IOP, IOL, CCT, output: RNFL. The best model was MLP(9:36:9:1), obtained with MSE = 0, r = 1, and Ep = 0.00265%. Figures 3 and 4 show graphical results for this case, specifically the training and testing phases for the best model. A correlation coefficient of 1 demonstrates that the model has well learned the relationships and patterns in the data (Fig. 3). In the testing phase, the r coefficient value is also close to 1, which gives credibility to the determined model (Fig. 4). The figures include the coefficient of determination R2 as a performance metric, which is the square of the correlation coefficient r.
Fig. 3.
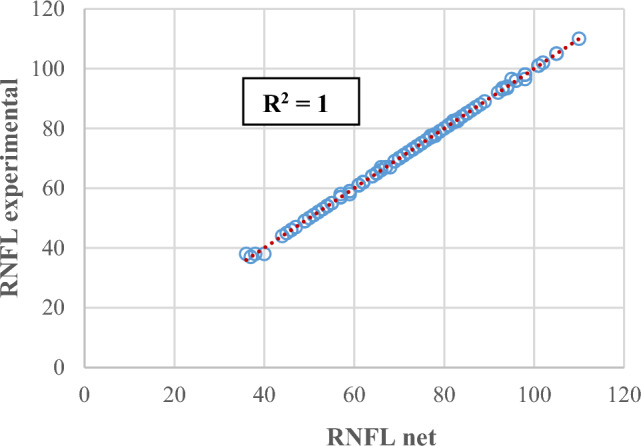
Experimental RNFL the predictions provided by an MLP(9:36:9:1) in the training phase.
Fig. 4.
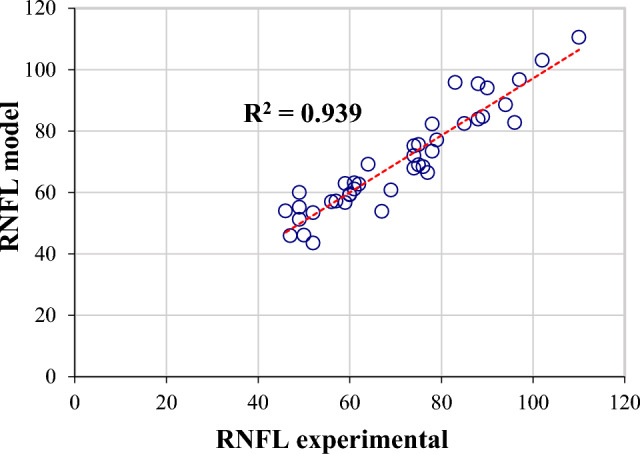
Experimental RNFL and the predictions provided by an MLP(9:36:9:1) in the testing phase.
For cases studies 4–7, the presented results are very good, and the obtained models are relatively simple.
Dataset 2 includes information related to the progression of glaucoma in 50 patients aged between 50 and 94 years, 52% of whom are male, with a glaucoma history ranging from 0 to 28 years. In this case, the modelling was carried out under the following conditions. The input data considered were: VFI, MD, PSD, and RNFL, measured at each of the three evaluation visits for both eyes, and indexed as 1, 2, and 3. The output variable, glaucoma progression, was encoded as (1, 0) for “yes”(there is progression in glaucoma) and (0, 1) for “no” (there is no progression in glaucoma). Multilayer perceptron neural models were constructed with 12 inputs, 2 outputs, and one or two hidden layers of neurons. The number of neurons used in the hidden layers varied between 6 and 30. The tanh activation function and the backpropagation with momentum algorithm were used.
The best model, MLP(12:24:6:2), had the following performance in the training phase: MSE = 0.000223, r = 0.999782, and Ep = 0.192070. For the testing phase, several results are given in Table 1. The probability of a correct answer for the prediction of glaucoma progression was 93.3%, which is a satisfactory accuracy.
Table 1.
The results provided by an MLP(12:24:6:2) in the testing phase.
| VFI1 | VFI2 | VFI3 | MD1 | MD2 | MD3 | PSD1 | PSD2 | PSD3 | RNFL1 | RNFL2 | RNFL3 | Progression in clinical observation | Progression with MLP |
|---|---|---|---|---|---|---|---|---|---|---|---|---|---|
| 99 | 98 | 100 | 0.62 | − 0.76 | 0.04 | 1.82 | 1.84 | 1.33 | 86 | 85 | 85 | No | No |
| 97 | 97 | 99 | − 0.65 | − 0.72 | − 0.36 | 2.16 | 2.1 | 1.58 | 102 | 98 | 98 | No | No |
| 97 | 98 | 99 | − 2.15 | − 4.49 | − 1.62 | 1.91 | 1.65 | 1.58 | 73 | 73 | 73 | No | No |
| 85 | 97 | 96 | − 7.52 | − 1.37 | − 3.23 | 9.75 | 2.25 | 2.18 | 79 | 78 | 77 | No | Yes |
| 94 | 93 | 92 | − 3.89 | − 3.71 | − 3.77 | 2.65 | 4.47 | 3.44 | 61 | 54 | 54 | No | No |
| 86 | 88 | 89 | − 4.89 | − 4.82 | − 4.12 | 4.72 | 5 | 5.35 | 69 | 68 | 67 | No | No |
| 89 | 96 | 93 | − 4.84 | − 4.08 | − 5.39 | 3.5 | 2.32 | 2.49 | 68 | 67 | 66 | No | No |
| 94 | 93 | 90 | − 2.86 | − 3.76 | − 4.58 | 3.03 | 4.38 | 6.58 | 77 | 76 | 75 | Yes | Yes |
| 98 | 98 | 97 | − 0.96 | − 1.67 | − 0.66 | 3.75 | 1.89 | 3.41 | 64 | 61 | 61 | No | No |
| 65 | 60 | 39 | − 12.46 | − 12.12 | − 18.42 | 8.96 | 9.2 | 12.52 | 40 | 38 | 36 | Yes | Yes |
| 94 | 91 | 96 | − 2.41 | − 2.97 | − 2.63 | 5.02 | 4.45 | 2.89 | 55 | 55 | 54 | No | No |
| 23 | 35 | 34 | − 26.11 | − 24.21 | − 23.79 | 8.21 | 10.34 | 9.71 | 38 | 37 | 37 | No | No |
| 100 | 99 | 100 | 0.14 | − 1.72 | − 0.56 | 1.21 | 1.45 | 1.25 | 99 | 96 | 95 | No | No |
| 93 | 93 | 97 | − 5.76 | − 5.01 | − 3.23 | 2.5 | 2.56 | 1.93 | 59 | 57 | 52 | No | No |
| 78 | 57 | 47 | − 9.8 | − 15.16 | − 19.63 | 9.54 | 11.89 | 12.41 | 55 | 50 | 49 | Yes | Yes |
Neural networks models determined using PyTorch
PyTorch is an open-source deep learning framework developed by Facebook’s AI Research lab. It provides a flexible and efficient platform for building and training neural networks. It supports computations on both CPU (central processing unit/computer’s processor) and GPU (graphics processing unit), which enables faster processing of large datasets. It has an intuitive design and a robust library of pre-built functions and models, which make it popular among researchers and practitioners in machine learning. One of its key features is the dynamic computation graph, i.e., a network where nodes represent mathematical operations and edges represent the data flow between these operations. This graph structure is essential for defining and optimizing complex computations in neural network models. Automatic differentiation is another fundamental feature of PyTorch. The “autograd” system automatically tracks all operations on tensors (multi-dimensional arrays) and enable the automatic computation of gradients during gradient-descent optimization such as backpropagation and its more advanced versions. By applying the chain rule to the computational graph, PyTorch efficiently calculates the derivatives needed to update model parameters. This capability simplifies the training process, making it more straightforward to implement and optimize deep learning models.
The first task to be solved uses dataset 2, the dataset where three visits were considered for a patient. In this case, there are 12 inputs: VFI1, VFI2, VFI3, MD1, MD2, MD3, PSD1, PSD2, PSD3, RNFL1, RNFL2, RNFL3, and the output of the model is represented by glaucoma progression, encoded by YES or NO. The configured dataset includes 100 records (instances).
The proposed architectures have two fully-connected layers with different number of neurons in the two hidden layers, using the tanh activation function. Since this a binary classification problem expressed using one-hot encoding, a softmax layer is used before the output. Softmax is a function that converts an array of real-valued numbers into a probability distribution.
The training algorithm is Adam (Adaptive Moment Estimation), a well-known optimization algorithm based on the principles of gradient descent. It computes individual adaptive learning rates for each network parameter using estimates of first and second moments of gradients. The specified learning rate is 0.001, which defines the size of steps taken to update the model parameters during training. A smaller learning rate, such as 0.001, implies smaller steps, often leading to more stable convergence. Weight decay is set to 10−5, serving as a regularization term during training. It helps prevent overfitting by adding a penalty to the model weights.
In order to determine the best architecture, fivefold cross-validation (CV) was implemented, meaning that in one iteration 80% of the data is used for training and 20% for testing. This methodology helps assess the generalization capabilities of the neural models. We also included a statistical approach of evaluating the architectures, running the CV process multiple times (in this case, 200 times). This decreases the influence of particular data splits in a single CV operation. The number of training epochs ranged between 50 and 100. It was observed that a larger number of epochs led to overfitting.
The best result was provided by a feedforward network, MLP(12:33:11:2), with two intermediate layers containing 33 and 11 neurons, respectively. The average error for the training phase was 0.09%, and 0.19% for testing, which represents a very good result.
After this process of identifying the best configuration, we used the process of splitting the data into 80% for training and 20% for testing, and selecting the model with the lowest testing error for prediction out of 20 repeated trials.
Another task to be solved with this method was modelling the evolution of glaucoma reflected by the values of the third visit. In this case, glaucoma progression was tracked by predicting the value of a specific parameter at the third visit of the patient included in the dataset. These parameters were, in turn, VFI3, MD3, PSD3, RNFL3, and IOP3. Considering 16 input sizes, 5 tasks were formulated and solved, corresponding to the mentioned outputs (Fig. 5).
Fig. 5.
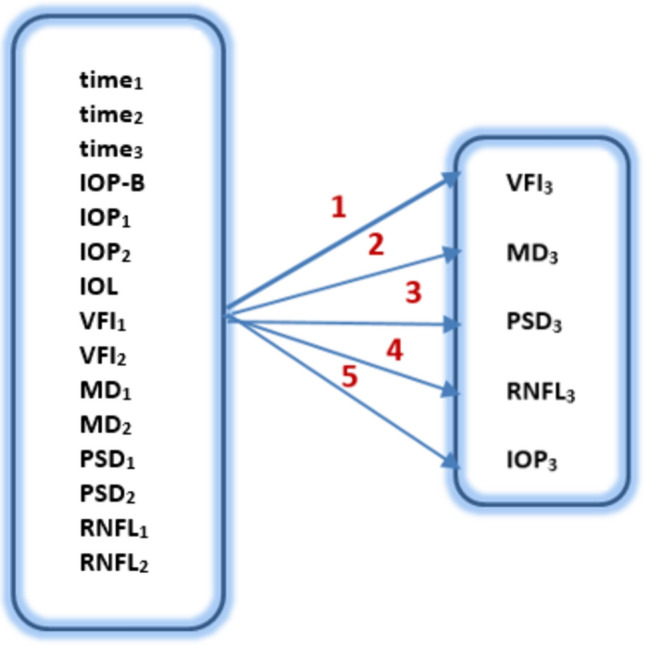
Modelling glaucoma progression by predicting the results of the third visit.
The training methodology is similar, but in this case we are dealing with regression problems, therefore the architectures involve a fully-connected layer with 1 output instead of a softmax layer.
Table 2 displays the results of the runs, showing the best determined network along with the corresponding errors observed during the training and testing phases.
Table 2.
Results of the five tasks formulated in Fig. 5.
| Task (output) | Network architecture | Mean training error (%) | Mean testing error (%) | Minimum training error (%) | Minimum testing error (%) |
|---|---|---|---|---|---|
| 1 (VFI3) | MLP(16:28:6:1) | 5.18 | 5.07 | 0.47 | 0.19 |
| 2 (MD3) | MLP(16:42:14:1) | 0.84 | 1.25 | 0.29 | 0.15 |
| 3 (PSD3) | MLP(16:42:14:1) | 0.33 | 0.75 | 0.09 | 0.08 |
| 4 (RNFL3) | MLP(16:42:14:1) | 0.95 | 1.67 | 0.06 | 0.04 |
| 5 (PIO3) | MLP(16:42:14:1) | 1.21 | 2.47 | 0.14 | 0.15 |
Next, some detailed results are presented, either in graphical format or in tables. For example, for MD3, Figs. 6 and 7 compare the experimental data (from the dataset) with those provided by the determined neural model, both for the training phase and for the testing phase, in an Microsoft Excel trendline format.
Fig. 6.
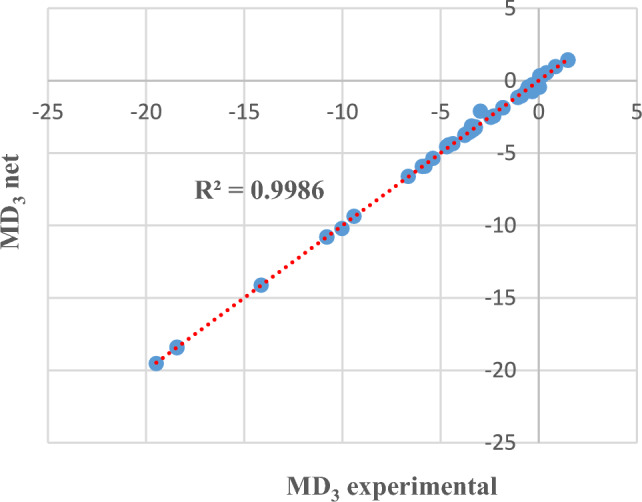
MD3 experimental and obtained through neural modelling in the training phase.
Fig. 7.
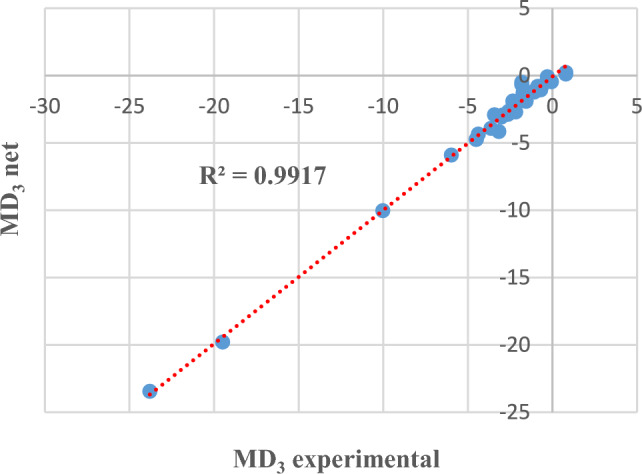
MD3 experimental and obtained through neural modelling in the testing phase.
In other words, comparing the experimental data with those provided by the best neural model involves evaluating the distance of the points from the straight line. The closer the points are to the straight line (or even on the line), it means that the values of the two datasets (experimental/investigations and prediction) are closer. The graphs also show the coefficient of determination R2 whose value is close to 1.
The results presented in Table 2 (row 2) and Figs. 6 and 7 show that MD at the third visit can be approximated with an accuracy of 98.75% based on the values recorded at the previous visits.
For the PSD parameter (task 3 in Table 2), Figs. 8 and 9 show comparatively some of the training and testing data, this time through bar graphs.
Fig. 8.
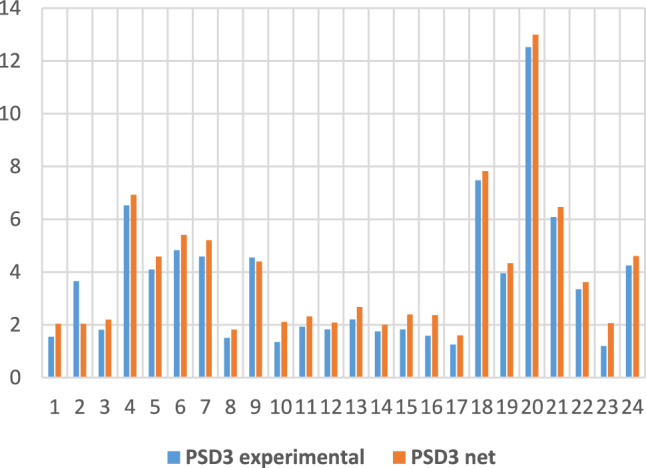
PSD3 experimental and obtained through neural modelling in the training phase.
Fig. 9.
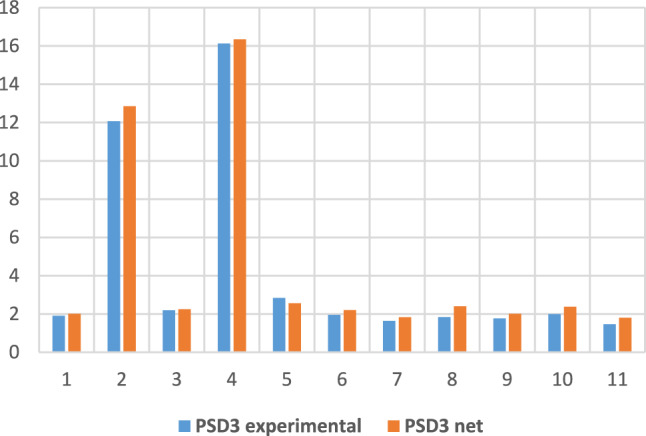
PSD3 experimental and obtained through neural modelling in the testing phase.
An accuracy of 99.25% for estimating PSD at the third visit represents a reliable prediction for this parameter.
For task 4, with the output being RNFL at the third visit, the comparison of the values from the dataset with those provided by the model (for a sample of data) is presented in table format (Table 3), which allows visualization and comparison of values for each pair of data.
Table 3.
Training and testing data for RNFL3, obtained experimentally and by prediction with the MLP(16:42:14:1) model.
| Training | Testing | ||
|---|---|---|---|
| RNFL3 experimental | RNFL3 network | RNFL3 experimental | RNFL3 network |
| 57 | 57.21 | 98 | 97.8 |
| 87 | 86.99 | 73 | 72.89 |
| 83 | 83.29 | 46 | 46.07 |
| 54 | 54.22 | 95 | 95.18 |
| 52 | 52.07 | 84 | 83.9 |
| 85 | 84.28 | 62 | 61.97 |
| 59 | 59.09 | 85 | 84.64 |
| 49 | 49.05 | 87 | 86.75 |
| 71 | 70.86 | 75 | 74.27 |
| 88 | 88.03 | 49 | 49.03 |
| 46 | 46.09 | ||
| 46 | 46.13 | ||
| 59 | 59.05 | ||
| 95 | 95.39 | ||
| 67 | 67.02 | ||
| 96 | 96.15 | ||
| 44 | 44.03 | ||
| 77 | 77.07 | ||
| 70 | 70.08 | ||
| 66 | 66.02 | ||
| 56 | 56.05 | ||
| 36 | 36.12 | ||
| 78 | 78.14 | ||
As in the previous tasks, the RNFL prediction at the third visit can be made, based on the determined model, with very high accuracy, specifically 98.33%, which means a faithful estimation of the structural progression.
For the last task (noted 5 in Table 2), with the IOP output at the third visit, the experimental vs. NN comparisons are given in graphical form in Figs. 10 and 11.
Fig. 10.
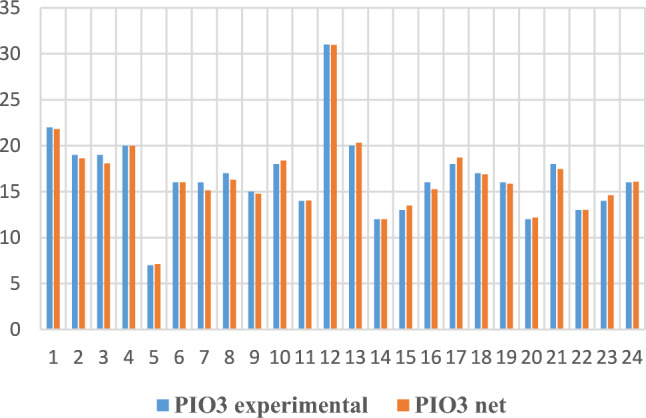
IOP3 experimental and obtained through neural modelling in the training phase.
Fig. 11.
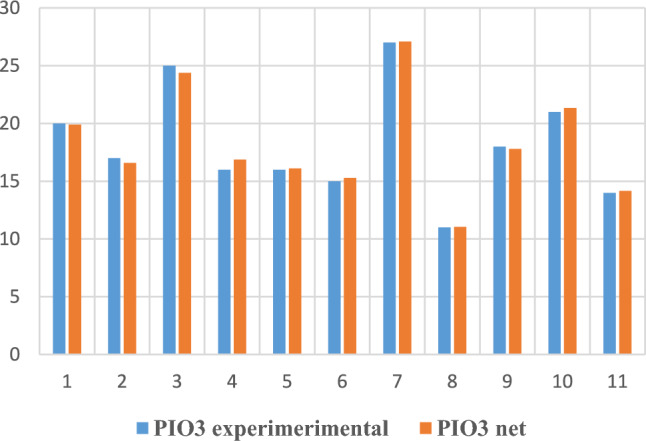
IOP3 experimental and obtained through neural modelling in the testing phase.
Another proposed task consisted in developing a neural network model to check if, during the three visits, it was necessary to add more drops to control glaucoma or if surgical manoeuvres were needed to control pressure. Thus, 11 inputs were used: base IOP, IOP1, IOP2, IOP3, VFI1, VFI2, VFI3, RNFL1, RNFL2, RNFL3, and CCT, with a single output, TRATMOD (YES or NO): “YES” for the situation where it was necessary to add more drops to control glaucoma or surgical manoeuvres were needed to control pressure, and “NO” for cases that were stable.
The PyTorch program determined an MLP(11:25:2) model with an average training error of 0.40% and an average testing error of 0.70%, making only one wrong classification out of 100; thus, 99 instances were correctly classified.
Discussion
For the first modelling methodology, namely determining neural networks through trial and error, different tasks were formulated, each type of modelling potentially contributing to obtain different information regarding disease progression and necessary treatment.
In these tasks, various types of neural models were tested, both structurally (one or two intermediate layers with different numbers of neurons) and parametrically (different transfer functions, training algorithms). Also, different variants (percentages) of data splitting into training and testing sets were tried, with performance evaluation in all cases based on errors (percentage, mean squared) or the correlation coefficient. Thus, the best model determination was done through trial and error.
For the tasks of dataset 1, a satisfactory generalization capacity was obtained, especially for the last four case studies containing a single output size, thus a simpler formulation.
Compared to the studies encountered in the literature addressing glaucoma through simulation using artificial intelligence tools, it is noted that these approaches use data extracted from OCT images13,14,38,39 with relatively few parameters.
Considering the modelling results obtained on dataset 2 (which is, in fact, the complete dataset), namely one wrong answer out of 15 possible (95.33% correct answers), these are close to what other researchers have reported or even better. Shon et al.40 predicted glaucoma progression based on visual field (VF) test information using neural networks and, although they had a much larger dataset than the one included in this study, they achieved 86.40% accuracy.
Shuldiner et al.41 tested several artificial intelligence tools: support vector machine, neural networks, random forest, logistic regression, naïve Bayes, and hybrid models for predicting glaucoma progression, obtaining an accuracy of 72%. They included in the input data visual field parameters, MD (mean deviation), and PSD (pattern standard deviation). Logistic regression applied by these researchers to the available data highlighted the fact that the advanced age of patients and the high value of PSD can influence the rapid progression of glaucoma.
In recent studies, Anton et al.42,43 demonstrated, using neural networks, that changes in visual field parameters, MD and PSD, are related to the influence of sleep apnoea syndrome on glaucoma.
Glaucoma causes visual disability, so it is crucial to find ways to predict its progression, enabling timely intervention to reduce its effects. Most existing studies in the literature rely on artificial intelligence tools to predict glaucoma progression based on spatial features embedded in fundus images2,3,7,25,38,41–51. All these studies demonstrate the ability of AI techniques to identify glaucoma and its progression from fundus images, suggesting that they can assist Ophthalmologists quickly and accurately. It can also be argued that artificial intelligence strategies can detect glaucoma progression earlier than conventional methods48,51. Most of these existing studies in the specialized literature, which are using fundus images report an accuracy of over 90% for predicting glaucoma progression. Compared to these, it is worth mentioning that the models developed in this paper use data collected from patients’ medical records.
Regarding the second modelling methodology, it included the implementation of a neural network design method, specifically a PyTorch program, which provides very good functional neural network models, i.e., network parameters. It is essential to note that very small errors were obtained during the testing phase, giving credibility to the models used in predicting glaucoma.
The program is flexible, allowing for the selection of the best values for the parameters; it works with: optimizer type, learning rate, weight decay, number of attempts, number of epochs, and data splitting into training and testing sets.
It was found that a larger network can provide better results; the same configuration, MLP(16:42:14:1), yielded very small errors in training and testing for all parameters for which predictions were made (VFI, MD, PSD, RNFL, IOP). The average testing errors were below 5%. A comparison can be made with previously reported results37 obtained with the dedicated Weka machine learning software. In both cases, the same dataset (dataset 2) was used, and the same task was solved, answering the question of whether glaucoma had progressed, considering the same 12 inputs. The best result obtained with Weka was a MLP(12:8:1), which provided 92 correct answers out of 100 possible, so a relative error of 8%, compared to the network determined in PyTorch, with 99 correct classifications out of a total of 100 instances.
The PyTorch ANN models provided very good results for predicting the visual field parameters (VFI, MD, and PSD) based on previous visit investigations. In the literature, similar research16 presents the possibility of making predictions for 24–2 visual field defects up to 5.5 years into the future. It is a complex approach, with a large number of parameters, based on deep learning neural networks that uses points from visual field images. Indeed, relatively small prediction errors are obtained, but, in our approach, the predictions for the visual field parameter values are smaller than those reported by Wen and colleagues16. Also, our methodology assumes the use of patient medical record data by a simple method.
When using AI models to analyze eye-related glaucoma illness datasets, several potential disadvantages and repercussions must be considered. The diversity of medical records means that more parameters may need to be considered for studying glaucoma progression than those offered by images alone. This paper uses such a diverse database as a challenge to find solutions that are accurate and methodologically sound. While it can be demonstrated that credible and useful results can be obtained with appropriate tools, several risks remain.
One significant risk is the potential for false diagnoses, including false-negative results, which can lead to missed diagnoses and delayed treatment. Such errors could have serious repercussions, including blindness if the glaucoma progresses untreated. If clinical decisions are based directly on AI system interpretations, the responsibility of the ophthalmologist becomes critical, necessitating the development of medico-legal protocols that involve both the clinician and the AI methods.
Additionally, there are limitations to using AI in clinical practice, such as patient mistrust in remote screening and doctors' dependency on technology. Despite these limitations, AI systems combined with ocular imaging in telemedicine could offer a cost-effective long-term solution to enhance screening efficiency and patient monitoring. This underscores the importance of integrating AI carefully and responsibly into medical practice to maximize benefits and minimize risks.
Conclusions
Glaucoma, a cause of irreversible blindness, represents a public health issue (global prevalence of 3.5%, affecting individuals aged between 40 and 80 years old and an estimation of 112 million cases worldwide by 2040). Early diagnosis and accurate monitoring of glaucoma progression are essential for controlling this disease and providing personalized treatment. In recent years, AI tools have been increasingly used for diagnosis, monitoring, and prognosis of glaucoma.
The initial trial and error method is simple but time-consuming. Moreover, it does not guarantee the determination of the best model. However, good results have been obtained, depending on the task formulated and the parameters considered.
Very good neural networks were obtained using the PyTorch deep learning framework. For various tasks, very small errors in training and testing, under 5%, were obtained. The networks can model both binary outputs, indicating whether glaucoma progresses, and real-valued outputs for variables that provide information on glaucoma progression (VFI, MD, PSD, RNFL, IOL). Predictions made by the PyTorch neural networks achieved over 98% accuracy for both functional (visual field parameters) and structural (retinal nerve fiber layer thickness) progression of glaucoma. This approach proved superior for developing efficient neural models to estimate the course of glaucomatous disease in clinical practice.
As future research directions, we propose testing the already developed software tools on additional datasets, as well as exploring other AI tools that are likely to be effective in simulation studies of glaucoma (for instance neuro-fuzzy technique).
Acknowledgements
This work was supported by Exploratory Research Project PN-III-P4-ID-PCE-2020-0551, no. 91/2021, financed by UEFISCDI Romania. Funding: Research Project PN-III-P4-ID-PCE-2020-0551, no. 91/2021.
Author contributions
Conceptualization, N.A., F.T. and S.C.; methodology, N.A., F.T., S.C, F.L; software, formal analysis C.L, A.F; resources, data curation, validation F.T, N.A, F.L, S.C, K.A; investigation, F.T, K.A, N.A and F.L, visualization, supervision N.A, S.C; writing—original draft, writing—review and editing, N.A., S.C; project administration, funding acquisition S.C, F.L.
Funding
Research Project PN-III-P4-ID-PCE-2020-0551, no. 91/2021.
Data availability
The datasets used and analyzed during the current study, as well as the source code of the software, are available from the corresponding author on reasonable request.
Competing interests
The authors declare no competing interests.
Footnotes
Publisher's note
Springer Nature remains neutral with regard to jurisdictional claims in published maps and institutional affiliations.
Contributor Information
Silvia Curteanu, Email: silvia_curteanu@yahoo.com.
Nicoleta Anton, Email: nicolofta@gmail.com.
References
- 1.Antón, A., Jordano, J. & Maquet, J. D. Sistema experto de diagnóstico de glaucoma. Archivos de la Sociedad Española de Oftalmologia69(1), 23–28 (1995). [Google Scholar]
- 2.Bowd, C. et al. Relevance vector machine and support vector machine classifier analysis of scanning laser polarimetry retinal nerve fiber layer measurements. Invest. Ophthalmol. Vis. Sci.46, 1322–1329 (2005). 10.1167/iovs.04-1122 [DOI] [PMC free article] [PubMed] [Google Scholar]
- 3.Bowd, C. et al. Comparing neural networks and linear discriminant functions for glaucoma detection using confocal scanning laser ophthalmoscopy of the optic disc. Invest. Ophthalmol. Vis. Sci.43(11), 3444–3454 (2002). [PubMed] [Google Scholar]
- 4.Simon, M., Alonso, L. & Alfonso, A. A hybrid visual field classifier to support early glaucoma diagnosis. Inteligencia Artificial Revista Iberoamericana de Inteligencia Artificial9(26), 9–17 (2005). [Google Scholar]
- 5.Hernández, G. E., Santos-García, G. & Inés, F. B. Identification of glaucoma stages with artificial neural networks using retinal nerve fibre layer analysis and visual field parameters. Innov. Hybrid Intell. Syst.44, 418–424 (2007). [Google Scholar]
- 6.Grewal, D., Jain, R., Grewal, S. & Rihani, V. Artificial neural network-based glaucoma diagnosis using retinal nerve fiber layer analysis. Eur. J. Ophthalmol.18(6), 915–921 (2018). 10.1177/112067210801800610 [DOI] [PubMed] [Google Scholar]
- 7.Parsaei, H., Moradi, P. & Parsaei, R. Development and verification of artificial neural network classifiers for eye diseases diagnosis. in Proceedings of the 14th ICBME. 398–402 (2008).
- 8.Zhou, M. et al. Diabetes mellitus as a risk factor for open-angle glaucoma: A systematic review and meta-analysis. PLoS One9(8), e102972 (2014). 10.1371/journal.pone.0102972 [DOI] [PMC free article] [PubMed] [Google Scholar]
- 9.Anton Apreutesei, N. The influence of glaucoma on the ocular changes of diabetes. PhD thesis UMF Iași, (2015).
- 10.Anton Apreutesei, N. et al. Predictions of ocular changes caused by diabetes in glaucoma patients. Comput. Methods Progr. Biomed.154, 183–190 (2018). 10.1016/j.cmpb.2017.11.013 [DOI] [PubMed] [Google Scholar]
- 11.Devalla, S. et al. Glaucoma management in the era of artificial intelligence. Br. J. Ophthalmol.104(3), 301–311 (2019). 10.1136/bjophthalmol-2019-315016 [DOI] [PubMed] [Google Scholar]
- 12.Bizios, D., Heijl, A., Hougaard, J. L. & Bengtsson, B. Machine learning classifiers for glaucoma diagnosis based on classification of retinal nerve fibre layer thickness parameters measured by Stratus OCT. Acta Ophthalmol.88(1), 44–52 (2010). 10.1111/j.1755-3768.2009.01784.x [DOI] [PubMed] [Google Scholar]
- 13.Yousefi, S., Kiwaki, T. & Zheng, Y. Detection of longitudinal visual field progression in glaucoma using machine learning. Am. J. Ophthalmol.193, 71–79 (2018). 10.1016/j.ajo.2018.06.007 [DOI] [PubMed] [Google Scholar]
- 14.Guangzhou, A. et al. Comparison of machine-learning classification models for glaucoma management. J. Health Ing.2018, 1–8 (2018). [DOI] [PMC free article] [PubMed] [Google Scholar]
- 15.Bizios, D., Heijl, A. & Bengtsson, B. Trained artificial neural network for glaucoma diagnosis using visual field data: A comparison with conventional algorithms. J. Glaucoma16, 20–28 (2007). 10.1097/IJG.0b013e31802b34e4 [DOI] [PubMed] [Google Scholar]
- 16.Wen, J. C. et al. Forecasting future Humphrey visual fields using deep learning. PLoS One14, e0214875 (2019). 10.1371/journal.pone.0214875 [DOI] [PMC free article] [PubMed] [Google Scholar]
- 17.Sample, P. A. et al. Using machine learning classifiers to identify glaucomatous change earlier in standard visual fields. Invest. Ophthalmol. Vis. Sci.43, 2660–2665 (2002). [PubMed] [Google Scholar]
- 18.Sample, P. A. et al. Unsupervised machine learning with independent component analysis to identify areas of progression in glaucomatous visual fields. Invest. Ophtalmol. Vis. Sci.46, 3684–3692 (2005). 10.1167/iovs.04-1168 [DOI] [PMC free article] [PubMed] [Google Scholar]
- 19.Goldbaum, M. et al. Comparing machine learning classifiers for diagnosing glaucoma from standard automated perimetry. Invest. Ophthalmol. Vis. Sci.43(1), 162–169 (2002). [PubMed] [Google Scholar]
- 20.Chan, K. et al. Comparison of machine learning and traditional classifiers in glaucoma diagnosis. IEEE Trans. Biomed. Eng.49, 963–974 (2002). 10.1109/TBME.2002.802012 [DOI] [PubMed] [Google Scholar]
- 21.Christopher, M. et al. Retinal nerve fiber layer features identified by unsupervised machine learning on optical coherence tomography scans predict glaucoma progression. Invest. Ophthalmol. Vis. Sci.59(7), 2748–2756 (2018). 10.1167/iovs.17-23387 [DOI] [PMC free article] [PubMed] [Google Scholar]
- 22.Medeiros, F., Jammal, A. A. & Thompson, A. C. From machine to machine: An OCT-trained deep learning algorithm for objective quantification of glaucomatous damage in fundus photographs. Ophthalmology126(4), 513–521 (2019). 10.1016/j.ophtha.2018.12.033 [DOI] [PMC free article] [PubMed] [Google Scholar]
- 23.Ran, A. R. et al. Deep learning in glaucoma with optical coherence tomography: A review. Eye35(1), 188–201 (2021). 10.1038/s41433-020-01191-5 [DOI] [PMC free article] [PubMed] [Google Scholar]
- 24.Hood, D. C. et al. Detecting glaucoma with only OCT: Implications for the clinic, research, screening, and AI development. Prog. Retin. Eye Res.90(9), 101052 (2022). 10.1016/j.preteyeres.2022.101052 [DOI] [PubMed] [Google Scholar]
- 25.Li, F. et al. A deep-learning system predicts glaucoma incidence and progression using retinal photographs. J. Clin. Invest.132(11), e157968 (2022). 10.1172/JCI157968 [DOI] [PMC free article] [PubMed] [Google Scholar]
- 26.Chaurasia, A. K., Greatbatch, C. J. & Hewitt, A. W. Diagnostic accuracy of artificial intelligence in glaucoma screening and clinical practice. Glaucoma31(5), 285–299 (2022). 10.1097/IJG.0000000000002015 [DOI] [PubMed] [Google Scholar]
- 27.Brigatti, L., Hoffman, D. & Caprioli, J. Neural networks to identify glaucoma with structural and functional measurements. Am. J. Ophthalmol.121(5), 511–521 (1996). 10.1016/S0002-9394(14)75425-X [DOI] [PubMed] [Google Scholar]
- 28.Mardin, C. Y., Peters, A., Horn, F., Jünemann, A. G. & Lausen, B. Improving glaucoma diagnosis by the combination of perimetry and HRT measurements. J. Glaucoma15(4), 299–305 (2006). 10.1097/01.ijg.0000212232.03664.ee [DOI] [PubMed] [Google Scholar]
- 29.Yousefi, S. et al. Monitoring glaucomatous functional loss using an artificial intelligence-enabled dashboard. Ophthalmology127(9), 1170–1178 (2020). 10.1016/j.ophtha.2020.03.008 [DOI] [PMC free article] [PubMed] [Google Scholar]
- 30.Nair, M., Tagare, S., Venkatesh, R. & Odayappan, A. Artificial intelligence in glaucoma. Indian J. Ophthalmol.70(5), 1868–1869 (2022). 10.4103/ijo.IJO_1015_22 [DOI] [PMC free article] [PubMed] [Google Scholar]
- 31.Ittoop, S. M., Jaccard, N., Lanouette, G. & Kahook, M. Y. The role of artificial intelligence in the diagnosis and management of glaucoma. J. Glaucoma31(3), 137–146 (2022). 10.1097/IJG.0000000000001972 [DOI] [PubMed] [Google Scholar]
- 32.Singh, L. K. & Garg, H. Detection of glaucoma in retinal images based on multiobjective approach. Int. J. Appl. Evolut. Comput.11(2), 13 (2020). [Google Scholar]
- 33.Singh, L. K., Garg, H. & Pooja, A. Automated glaucoma type identification using machine learning or deep learning techniques. Adv. Mach. Intell. Interact. Med. Image Anal. 241–263 (2019).
- 34.Singh, L. K., Munish, K. & Shankar, T. A novel hybrid robust architecture for automatic screening of glaucoma using fundus photos, built on feature selection and machine learning-nature driven computing. Expert Syst.39, e13069 (2022). 10.1111/exsy.13069 [DOI] [Google Scholar]
- 35.Singh, L. K., Munish, K., Shankar, T. & Singh, R. Deep-learning based system for effective and automatic blood vessel segmentation from Retinal fundus images. Multimed. Tools Appl.83, 1–45 (2023). 10.1007/s11042-023-17621-x [DOI] [Google Scholar]
- 36.Singh, L. K., Munish, K., Shankar, T. & Singh, R. Nature-inspired computing and machine learning based classification approach for glaucoma in retinal fundus images. Multimed. Tools Appl.82, 1–49 (2023). 10.1007/s11042-023-15175-6 [DOI] [Google Scholar]
- 37.Târcoveanu, F. E. et al. Classification algorithms used in predicting glaucoma progression. Healthcare10, 1831 (2022). 10.3390/healthcare10101831 [DOI] [PMC free article] [PubMed] [Google Scholar]
- 38.Elze, T. et al. Patterns of functional vision loss in glaucoma determined with archetypal analysis. J. R. Soc. Interface12(10), 1098 (2015). [DOI] [PMC free article] [PubMed] [Google Scholar]
- 39.Raja, C. & Gangatharan, N. Appropriate sub-band selection in wavelet packet decomposition for automated glaucoma diagnosis. Int. J. Autom. Comput.10.1007/s11633-014-0858-6 (2015). 10.1007/s11633-014-0858-6 [DOI] [Google Scholar]
- 40.Shon, K., Sung, K. & Shin, J. Can artificial intelligence predict glaucomatous visual field progression? A spatial-ordinal convolutional neural network model. Am. J. Ophthalmol.233, 124–134 (2022). 10.1016/j.ajo.2021.06.025 [DOI] [PubMed] [Google Scholar]
- 41.Shuldiner, S. et al. Predicting eyes at risk for rapid glaucoma progression based on an initial visual field test using machine learning. PLoS One16(4), e0249856 (2021). 10.1371/journal.pone.0249856 [DOI] [PMC free article] [PubMed] [Google Scholar]
- 42.Anton, N. et al. Use of artificial neural networks to predict the progression of glaucoma in patients with sleep apnea. Appl. Sci.12(12), 6061 (2022). 10.3390/app12126061 [DOI] [Google Scholar]
- 43.Anton, N. et al. Assessing changes in diabetic retinopathy caused by diabetes mellitus and glaucoma using support vector machines in combination with differential evolution algorithm. Appl. Sci.11(9), 3944 (2021). 10.3390/app11093944 [DOI] [Google Scholar]
- 44.Wang, S. Y., Tseng, B. & Hernandez-Boussard, T. Deep learning approaches for predicting glaucoma progression using electronic health records and natural language processing. Ophthalmol. Sci.2(2), 100127 (2020). 10.1016/j.xops.2022.100127 [DOI] [PMC free article] [PubMed] [Google Scholar]
- 45.Thompson, A., Jammal, A. & Medeiros, F. A review of deep learning for screening, diagnosis, and detection of glaucoma progression. Trans. Vis. Sci. Tech.9(2), 42–42 (2020). 10.1167/tvst.9.2.42 [DOI] [PMC free article] [PubMed] [Google Scholar]
- 46.Hemelings, R. et al. Accurate prediction of glaucoma from colour fundus images with a convolutional neural network that relies on active and transfer learning. Acta Ophthalmol.98(1), e94–e100 (2020). 10.1111/aos.14193 [DOI] [PubMed] [Google Scholar]
- 47.Mirzania, D., Thompson, A. C. & Muir, K. W. Applications of deep learning in detection of glaucoma: A systematic review. Eur. J. Ophthalmol.31(4), 1618–1642 (2020). 10.1177/1120672120977346 [DOI] [PubMed] [Google Scholar]
- 48.Zafar, A. et al. A Comprehensive convolutional neural network survey to detect glaucoma disease. Mob. Inf. Syst. Hindawi2022, 3971516 (2022). [Google Scholar]
- 49.Mursch-Edlmayr, A. S. et al. Artificial intelligence algorithms to diagnose glaucoma and detect glaucoma progression: Translation to clinical practice. Trans. Vis. Sci. Tech.9(2), 55 (2020). 10.1167/tvst.9.2.55 [DOI] [PMC free article] [PubMed] [Google Scholar]
- 50.Belgacem, R., Malek, I. T., Trabelsi, H. & Jabri, I. A supervised machine learning algorithm SKVMs used for both classification and screening of glaucoma disease. N. Front. Ophthalmol.4(4), 1–27 (2018). [Google Scholar]
- 51.Li, Z. et al. Efficacy of a deep learning system for detecting glaucomatous optic neuropathy based on color fundus photographs. Ophthalmology125(8), 1199–1206 (2018). 10.1016/j.ophtha.2018.01.023 [DOI] [PubMed] [Google Scholar]
Associated Data
This section collects any data citations, data availability statements, or supplementary materials included in this article.
Data Availability Statement
The datasets used and analyzed during the current study, as well as the source code of the software, are available from the corresponding author on reasonable request.


