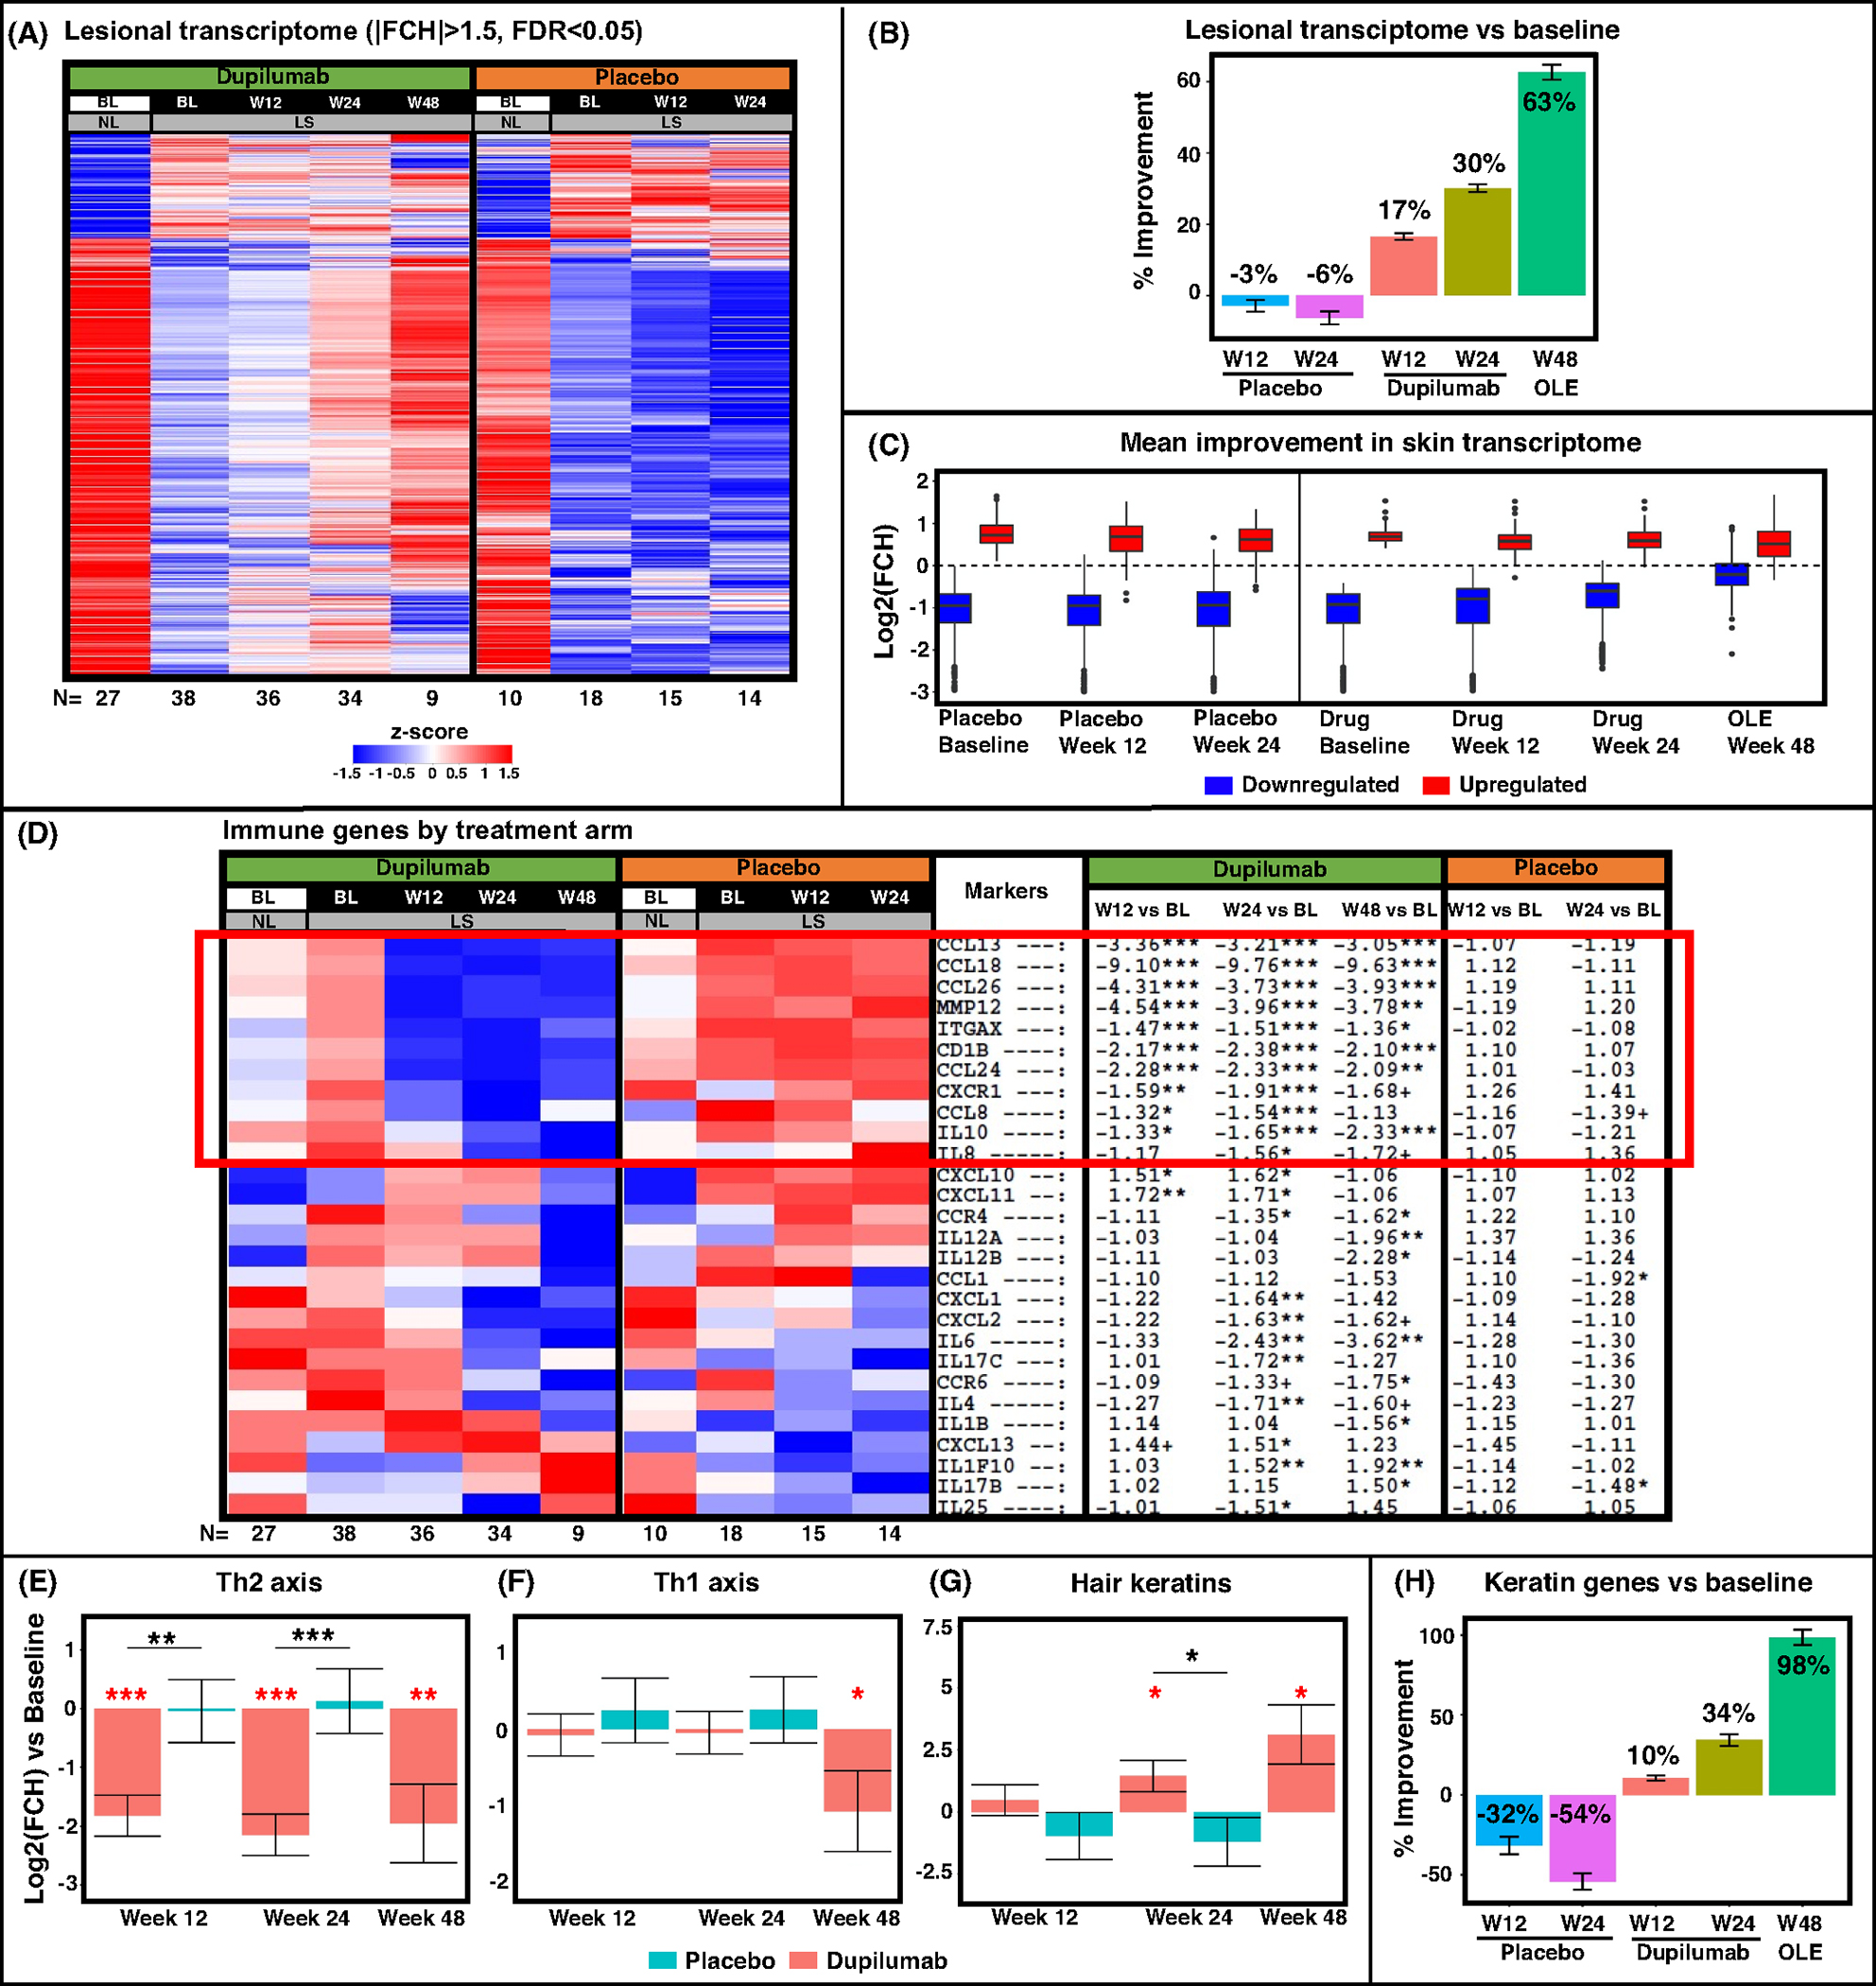
FIGURE 2.

RNA-sequencing results of scalp samples in alopecia areata (AA) at baseline and during placebo and dupilumab treatment. Lesional transcriptome of all differentially expressed genes (DEGs) presented as a heatmap with respective number of participants at the bottom (A), and as a plot indicating percent of improvement in DEGs during treatment (B). Blue and Red boxes denote down- and upregulated DEGs, respectively, across treatment arms during the trial, with a dashed line representing non-lesional scalp at baseline (C). Immune and keratin pathway-specific results are presented as a heatmap of preselected immune genes, including a red box highlighting genes related with dupilumab’s mechanism of action (D), gene-set variation analysis (E, F, G), and a plot of keratin gene-set percent improvement (H). BL, baseline; LS, lesional; NL, non-lesional; OLE, open label extension; W12, week 12; W24, week 24; W48, week 48. +/*/**/*** denote significance (p < .1/.05/.01/.001, respectively) of difference in comparison with baseline (when in red) and in dupilumab versus placebo at a specific timepoint (when in black).
