Abstract
High resolution (~0.22mm) images are preferably acquired on whole-body 7T scanners to visualize mini anatomical structures in human brain. They usually need long acquisition time (~12 min) in 3D scans even with both parallel imaging and partial Fourier samplings. The combined use of both fast imaging techniques however leads to occasionally visible undersampling artifacts. Spiral imaging has advantage in acquisition efficiency over rectangular sampling, but its implementations are limited due to image blurring caused by strong off-resonance effect at 7T. This study proposes a solution for minimizing image blurring while keeping spiral efficient. Image blurring at 7T was, first, quantitatively investigated using computer simulations and point spread functions. A combined use of multi-shot spirals and ultra-short echo time (UTE) acquisitions was then employed to minimize off-resonance induced image blurring. Experiments on phantoms and healthy subjects were performed on a whole-body 7T scanner to show the performance of the proposed method. The 3D brain images of human subjects were obtained at TE=1.18ms, resolution=0.22mm (FOV=220mm, matrix size=1024), and in-plane spiral shots=128, using a home-developed UTE sequence (acquisition-weighted stack of spirals, AWSOS). The total acquisition time for 60 partitions at TR=100ms was 12.8min without use of parallel imaging and partial Fourier sampling. The blurring in these spiral images was minimized to a level comparable to that in gradient-echo (GRE) images with rectangular acquisitions while the spiral acquisition efficiency was maintained at eight. These images showed that spiral imaging at 7T was feasible.
Keywords: spiral imaging, UTE imaging, T1-weighted imaging, high resolution imaging, whole-body 7T scanner
INTRODUCTION
One of the most-pursued goals on whole-body 7T MRI scanners is to produce images with high spatial in-plane resolutions (e.g., 0.22mm in human brain imaging at FOV=220mm and matrix size=1024) to visualize small anatomical structures of target tissues. Data acquisitions of high-resolution images, however, need long scan time. To acquire a 2D image at matrix size 1024, for example, requires 1024 phase encodings in a full rectangular sampling or 1024 excitations when one phase encoding is performed per excitation, leading to a total acquisition time of 102.4s at TR=100ms in T1-weighted imaging. The time rises to 102.4 min when 60 slices are required in a 3D imaging, resulting in an unacceptable scanning time in daily practice.
Some techniques well established on the 1.5T or 3T scanners may be used to reduce the scan time. Among them are 1) collecting multiple phase- or slice-encoding lines in one excitation or preparation, such as rapid acquisition with relaxation enhancement (RARE) (1), echo-planar imaging (EPI) (2), spiral imaging (long curved line) (3–5), or magnetization-prepared rapid gradient-echo (MP-RAGE) imaging (6); 2) collecting part of phase-encoding lines such as partial Fourier sampling (7); 3) skipping part of phase-encoding lines by using parallel imaging such as sensitivity encoding (SENSE) (8) or generalized autocalibrating partially parallel acquisitions (GRAPPA) (9, 10). These time-saving techniques are available as product sequences on whole-body 7T scanners and have been used in our studies individually or in a group for T2*- or T1-weighted imaging of human brains. The scan time, however, is still around 12 min for a 3D T1-weighted image even though both partial Fourier sampling and factor-2 parallel imaging are used together. However, a combined use of both parallel and partial Fourier (PF) acquisitions may degrade image quality by occasionally producing visible undersampling artifacts in some slices.
Spiral imaging has great potential in acquisition efficiency on whole-body 7T scanners. It may need only 256 or fewer excitations for the 2D image in the example above. More than three quarters of the total acquisition time is then saved without use of parallel imaging and partial Fourier sampling. However, spiral acquisition is very sensitive to off-resonance that causes image blurring (4, 5). Many efforts have been made to correct the off-resonance blurring (11–20), but spiral imaging is still not as plausible as an alternative technique, EPI (21–23). The latter has easily-recognizable off-resonance artifacts and decent corrections for them (24–28, 38).
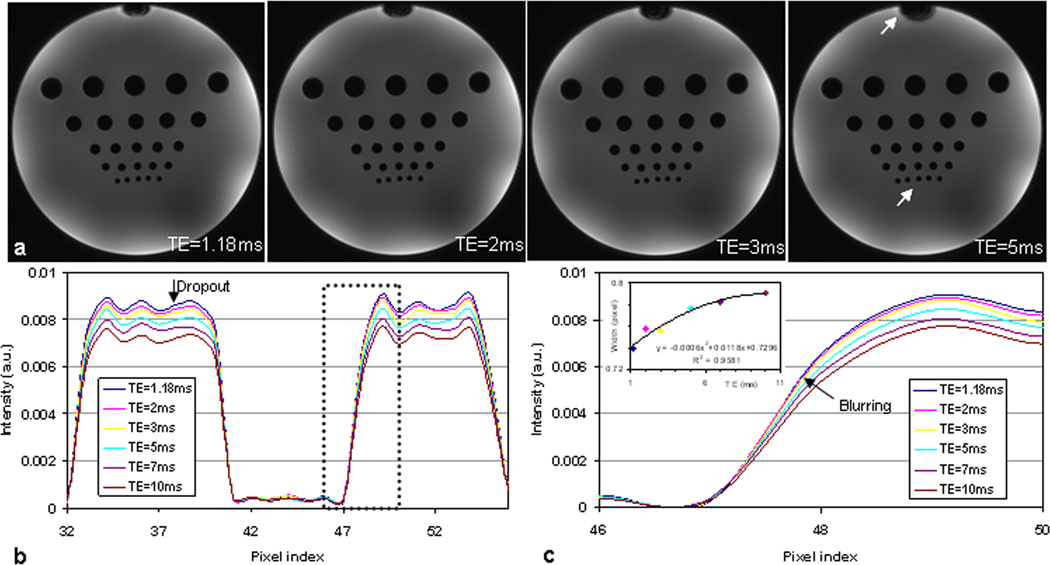
Spiral imaging may benefit from its capability of acquiring free induction decays (FIDs) when performing imaging scans on 7T scanners at very short echo time. FID signals can be collected in spiral acquisitions immediately after excitation pulses, producing an echo time (<1 ms) much shorter than those in gradient-echo based rectangular samplings which usually have an echo time of ~17ms in high resolution imaging. Ultra-short echo time (UTE) allows minimal signal dephasing caused by off-resonance before data acquisition and thus reduces the overall image blurring. Examples are given in Figures 1–2, showing this benefit from UTE spiral acquisitions. A side effect, unfortunately, is that ultra-short echo time is not capable of producing T2*- or T2-contrast. Therefore, UTE spiral imaging is used most-likely for producing T1-weighted images.
Fig. 1.

Spiral images of a human brain at 7T for demonstrating evolution of signal dropout and image blurring (arrows) with TE increasing. Shorter TE produced smaller dropout and blurring. Acquisition parameters: whole-body 7T scanner, 8-channel head coil array, AWSOS sequence, sinc RF pulse of 2ms in duration and 1.5 in cycle, , TR=100ms, FOV=220mm, matrix size=256, slice thickness=2mm, and spirals=64 for a readout of 3.52ms.
Fig. 2.
a) Spiral images of a phantom for showing development of signal dropout and image blurring (arrows) with TE increasing. (FOV=220mm, matrix size=256, , TR=100ms, slice thickness=5mm, and spirals=64 for a readout of 3.52ms).
b) Intensity profiles through the centers of the dark holes in the last row [arrow in a)] for illustrating signal dropout with TE increasing.
c) Zoom-in [dashed box in b)] display around the edge of a dark hole in b) for showing blurring development with TE increasing. The insert plot shows that the edge width at half maximum increases with TE increasing due to blurring.
The off-resonance blurring, however, is still a major challenge to spiral imaging on the 7T scanners due to long readout time (~10 ms) and large offset frequencies (~300 Hz). The offset frequency of proton (1H) imaging at 1.0 ppm (the magnitude order of inhomogeneity) is 297 Hz at 7T, compared with 127 Hz at 3T or 64 Hz at 1.5T (29). This offset can make a pixel twice large in size even at short spiral readout of 2.6 ms (30). In general, chemical shift frequency at 7T is more than doubled than at 3T for the same off-resonance spin component in ppm, potentially leading to larger image blurring of that component (31, 32). In addition, susceptibility effects due to variation in susceptibility are also stronger at 7T than at 3T (33–34), resulting in larger offset frequency and thus larger image blurring. Solutions to the reduction of the off-resonance blurring have been reported in literature. Shortening spiral readout is the most common idea among them (31). But, no studies have been reported in literature to discuss this idea in detail or quantitatively, to the best of our knowledge. The effectiveness of spiral imaging at 7T remains inconclusive.
This study was designed to investigate the positive and negative aspects of spiral imaging on whole-body 7T scanners and to find out a way to effectively perform it. Computer simulations were employed to quantitatively investigate spiral image blurring at 7 Tesla. A hybrid method, which is a combined use of multi-shot spirals and ultra-short echo time, was proposed to minimize the image blurring. Phantom studies and human subject scans were implemented on a whole-body 7T scanner to demonstrate the feasibility of this hybrid method.
METHODS AND MATERIALS
The off-resonance blurring at 7T was quantitatively investigated using computer simulations to find out its relationship with offset frequency and spiral readout time. A balance between off-resonance blurring and spiral readout was then identified. Spiral acquisition efficiency was determined at the maximum spiral readout which was limited by the requirement of small off-resonance blurring. The feasibility of the proposed method was verified with experiments on phantoms and healthy volunteers on a whole-body 7T scanner using a home-developed UTE spiral sequence.
Computer Simulation
Due to lack of analytic formulas for calculating image blurring with spiral trajectory, numerical calculations (computer simulations) were employed to measure the extent of spiral image blurring at 7T and to illustrate the blurring as well. Point spread function (PSF) of spiral sampling was used as a tool for the measurement of the blurring. A cylindrical volume in the k-space was sampled using multi-shot spiral sampling in the plane and variable-duration slice encodings in the direction. This sampling scheme, capable of ultra-short echo time (UTE) acquisitions and referred to as acquisition-weighted stack of spirals (AWSOS) (30), was also used in later phantom and human studies. Off-resonance was incorporated into the generation of the k-space signal,
| [1] |
with time, , starting at TE, offset frequency, , slab thickness, , spin density, , and spiral trajectory, . The spiral trajectory was designed using the analytical formulas described in Ref. (35). Image reconstructions on the simulated data sets were implemented by performing discrete Fourier transformations along the direction and the gridding algorithm in the plane (36). The non-uniform spiral sampling density was compensated for with a geometrical weighting before the gridding process (37). The point spread function was obtained from the simulated data, , when the three-dimensional (3D) integral in Eq. [1] was set to a constant value (e.g., 1.0).
Image Blurring Measurement
Image blurring was measured in terms of the increase of pixel size which was estimated with the full width of half maximum (FWHM) of the point spread function related to a spiral sampling. The image blurring was investigated under two typical values of off-resonance: 1.0 ppm (or 297 Hz at 7T) representing the magnitude order of the main field inhomogeneity and 3.4 ppm (or 1010 Hz at 7T) reflecting the water-fat difference in resonance frequency in the body. Spiral readout, , was altered in a range of 2.600–9.352 ms (corresponding to 80–18 spiral interleaves) at a spatial resolution of 0.859 mm (=220mm/256). Longer readouts were not examined due to extra large image blurring at the investigated offset frequency (297 Hz) and less importance in practice. Longer readouts at lower offset frequencies could be covered in the investigated range of readout by referring to a quantity of . The FWHM values corresponding to those investigated readouts were measured, respectively, leading to a plot of the relationship between the blurring and readout.
Spiral Acquisition Efficiency
The efficiency of spiral acquisition, , was defined in this study as the ratio of the number of phase-encoding lines used for a full rectangular sampling required by Nyquist criterion, , to the number of spiral interleaves required for the same full sampling, ,
| [2] |
The number of spiral interleaves determines the readout time of an individual interleaf. The readout time alters the extent of image blurring. Spiral efficiency is, consequently, limited by the requirement of small image blurring.
Balancing image blurring and spiral efficiency
Spiral acquisition efficiency is limited by image blurring and a balance between them has to be made in practice. We chose spiral efficiency based on total image blurring which resulted from off-resonance dephasing before and during spiral readout. Total image blurring was minimized by two measures proposed in this study. First, multi-shot spirals (e.g., 128 shots at a matrix size of 1024) were used to dramatically reduce readout time, although significantly lowering spiral efficiency. This measure is effective, straightforward, and widely acknowledged, but it was not strong enough against image blurring on whole-body 7T scanners. The second measure, utilizing an ultra-short echo time, was necessarily introduced to further reduce image blurring which occurred before spiral acquisitions. The AWSOS sequence was employed in this study to perform UTE spiral imaging (30). This two-step reduction in image blurring is referred to as a hybrid method in this paper.
Experiments
Experiments on phantoms and human subjects (healthy volunteers) were performed on a whole-body 7T scanner (Magnetom 7T MRI, VB15, Siemens Medical Solutions, Erlangen, Germany) with maximum gradient amplitude of 40 mT/m and maximum slew rate of 170 mT/m/ms. An 8-channel head array coil (Rapid Biomedical GmbH, Rimpar, Germany) and a home-developed UTE spiral sequence AWSOS were employed for data acquisitions. Shim adjustment for each of data acquisitions was manually implemented with 5–7 iterations to achieve a good shim (line width <60 Hz).
The phantom experiments were performed with scan parameters: a sinc RF pulse of duration=0.8ms and cycle=1.5, flip angle=10°, TE/TR=0.59/100ms, FOV=220×220×150 mm3, matrix size=256×256×60, in-plane spiral interleaves=36 (or 64), readout time=5.360 (or 3.440ms), and total acquisition time=3.6 (or 6.4) min. To get a good shim the shimming volume was put inside the phantom. The phantom images were also used to measure actual resolution of spiral imaging at high resolution. The resolution measurement was implemented at the edge of the plastic bars inside the phantom imaged.
The experiments on the subjects were approved by the Institutional Review Board (IRB) of the University of Pittsburgh and the signed consent forms were collected. Thirteen healthy subjects were scanned in this study, but the scans on the first six subjects did not produce an expected T1-weigted contrast between white and gray matters due to inhomogeneity in flip angle. Transmitter adjustment on the 7T scanner usually could not find a voltage for 180° with the 8-channel head coil array used in this study. After figuring out optimal values for coil voltage (390V) and flip angle (50°), we got images of decent T1-weighted contrast on the last seven scans. These scanning parameters were as follows: sinc RF pulse of duration=2.0 ms and cycle=1.5, flip angle=50°, TE/TR= 1.18/100ms, FOV=220×220×120 mm3, matrix size= 512×512×60 or 1024×1024×60, in-plane spiral interleaves=64 or 128, and readout time=10.560 ms (matrix=512 and spirals=64), 5.920 ms (spirals = 128), or 20.160 ms (matrix=1024 and spirals = 128). The total acquisition time (TA) for a 3D acquisition was 6.4 min for 64 spirals, or 12.8 min for 128 spirals, at TR=100ms.
For comparison in image blurring, a standard gradient echo (GRE) product sequence provided by the manufacturer was employed to generate high-resolution images. The same RF excitation was used in both spiral and GRE sequences, and this was achieved by modifying the RF pulse definition in the GRE sequence. Acquisition parameters for our 3D GRE imaging were as follows: sinc RF pulse of duration=2.0ms and cycle=1.5, flip angle , FOV=220mm, matrix size=512, asymmetric echo, TE/TR=3.1/100ms (minimum TE used), BW= 490Hz/px (highest BW used), slices=60 at thickness=2mm, partial Fourier (PF) sampling = 6/8 in both slice and phase encoding directions, GRAPPA at factor=4, separate reference lines =128, acquisition time (TA) =7.4min. Matrix size at 1024 was not performed for the GRE imaging due to its long scan time (14.6min).
RESULTS
Computer Simulations
The point spread functions (PSFs) of spiral sampling at 1.0 ppm (or 297 Hz) at 7T were obtained at an in-plane resolution of 0.859 mm (FOV=220mm and matrix size=256) and readouts of 2.600, 3.208, 5.784, and 9.352 ms, respectively. The point spread functions at zero frequency offset were also calculated as a base line. It was found that the distribution pattern of the PSF intensity gradually changed with readout increasing, from a disk-shape distribution at zero off-resonance or short readout (3.208 ms) to a ring-shape distribution at large offset (297 Hz) and long readout (5.784 ms). The profile across the PSF center accordingly changed from single peak to double peaks. The point spread functions at 3.4 ppm (or 1010 Hz) were also obtained and they were found to have the same distribution pattern as those at 1.0 ppm but to transfer into the ring-shape distribution more quickly. Figure 3 demonstrates some of these point spread functions in image format while Figure 4 presents them as profiles.
Fig. 3.

Point spread functions of spiral sampling at 7T at off-resonances 1.0ppm (297Hz, a-b) and 3.4ppm (1010Hz, c-d) with FOV=220mm, matrix size=256, resolution =0.86mm. Note that the distribution pattern of the PSF’s intensity is a ring-shape rather than a disk-shape as at 1.5T (not shown). The diameter of the ring increases with offset frequency and readout time.
Fig. 4.
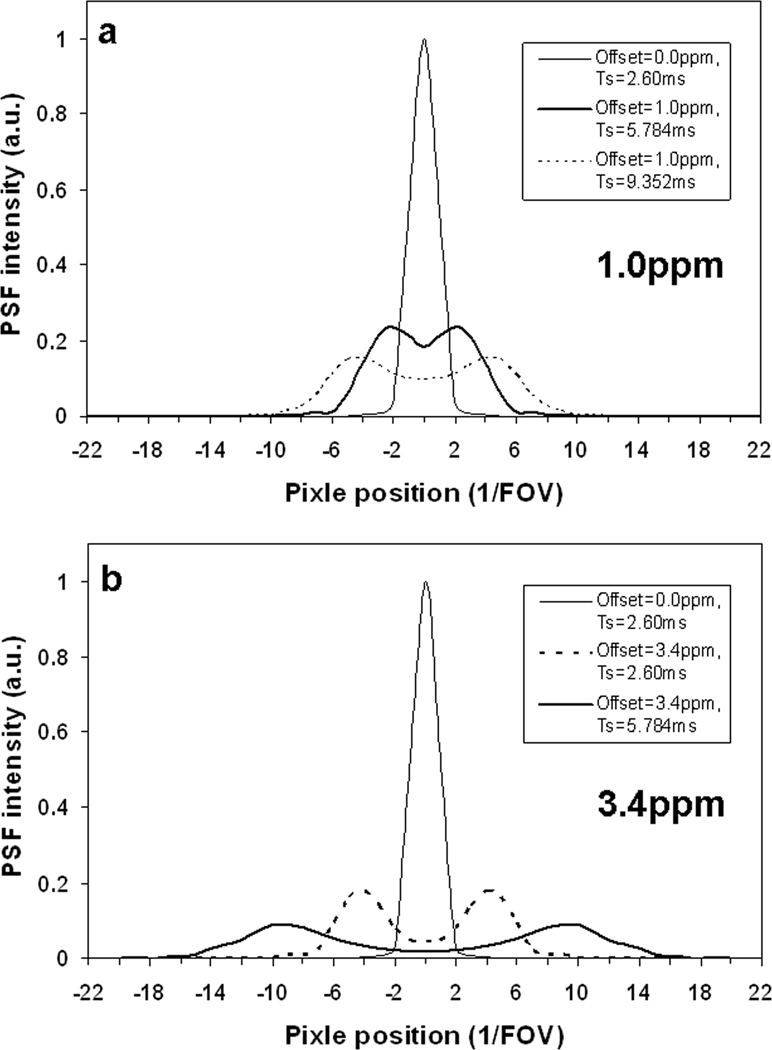
Center-pass profiles of the point spread functions in Fig. 3: a) 1.0ppm and b) 3.4ppm. Double-peak lines in a)-b) were from the ring-shape distributions in Fig. 3, while single-peak lines were from the disk-shape distribution at zero-offset frequency. Note that the intensity at the center of the double peaks in a)-b) decreases with offset frequency or readout time.
The switching point of the PSF pattern from disk-shape to ring-shape was found at ; where is a parameter without unit and is defined as the product of readout, , and offset frequency, . The PSF has a disk-shape distribution (or single peak in profile) when , but has a ring-shape distribution (or double peaks in profile) when . Figure 5 shows this pattern switching in a readout-offset plane. This finding was also mentioned in Ref. (30), but not detailed there, especially for acquisitions at 7T.
Fig. 5.
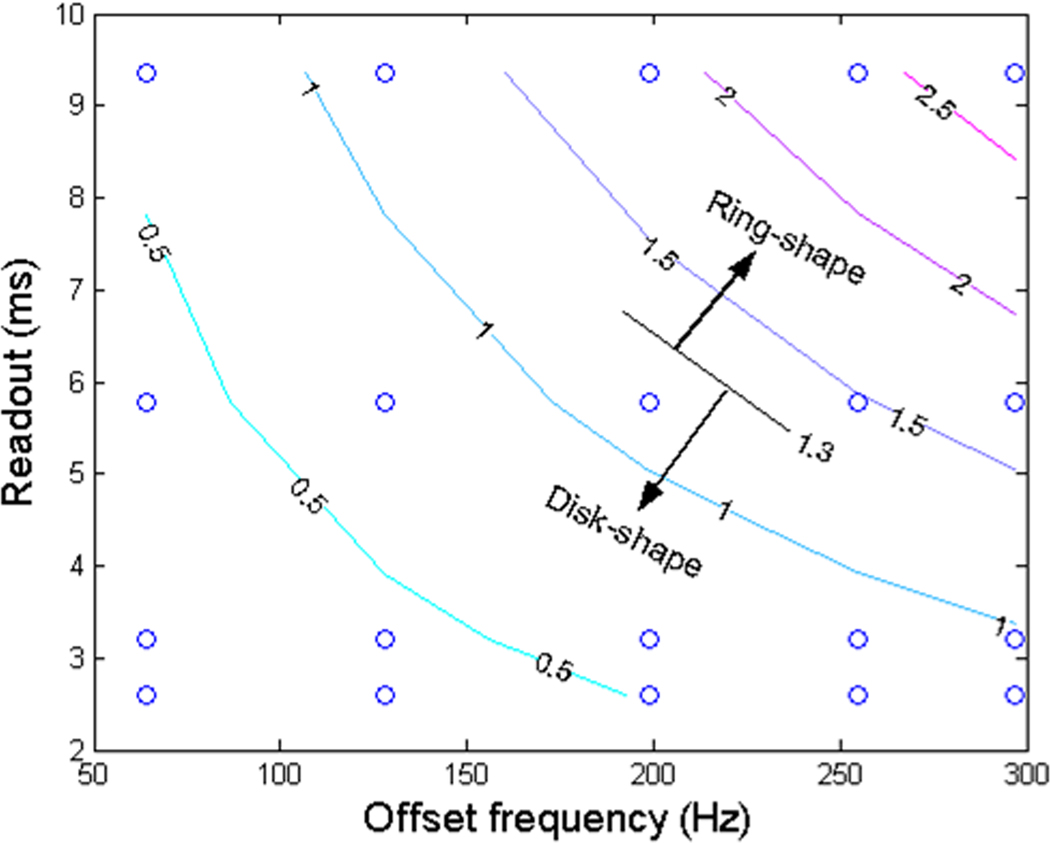
Contour plot of the product of spiral readout and offset frequency , showing the switching of spiral PSF pattern from disk- to ring-shape when crossing the line . The small circles indicate values of and calculated in this study.
Measurements of Image Blurring
The full width at half maximum (FWHM) of the point spread function was measured and shown in Figure 6a. The FWHM increases with readout linearly at both offset frequencies. But, the increasing speed at 3.4 ppm is as 2.95-fold large as at 1.0 ppm, as shown by the linear equations in Figure 6a. At the short readout of 2.6 ms, the FWHM is 2.068 pixels at 1.0 ppm and 11.160 pixels at 3.4 ppm, leading to large imaging blurring. Therefore, spiral readout should be shorter than 2.6ms at an offset frequency of 1.0ppm at 7T (or 297Hz) to keep image blurring fewer than 2 pixels. However, spiral readout may be as long as 25ms when offset frequency is smaller than 30Hz.
Fig. 6.
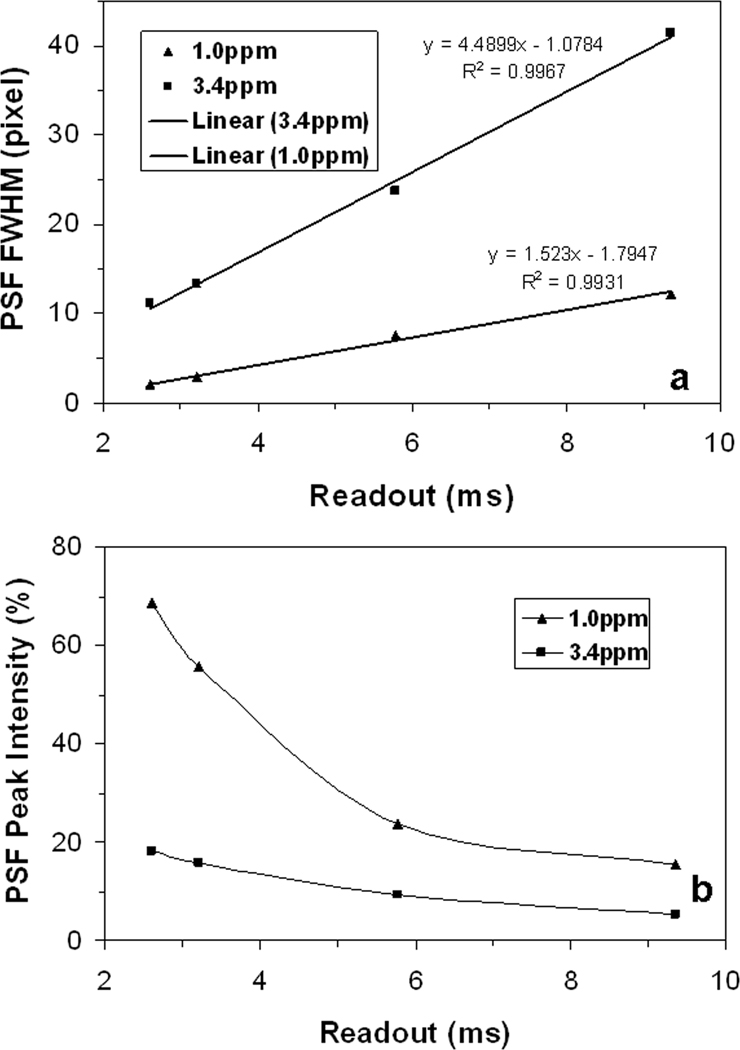
a) PSF’s full width at half maximum (FWHM) and b) peak intensity of spiral sampling at 7T. The peak intensity was normalized to the one at zero-offset frequency. Note that the FWHM linearly increases with readout at both offset frequencies while the peak intensity decreases and approaches to a limit of about 10% at 1.0ppm or about 20% at 3.4ppm at long readouts, instead of to zero due to PSF’s ring-shape distribution.
The peak intensity of the point spread function was also measured and demonstrated in Figure 6b. The PSF peak intensity, different from its width, does not decrease with readout linearly. Due to the pattern switching, the peak intensity in the ring-shape distribution at 3.4 ppm decreases much slower than in the disk-shape distribution at 1.0 ppm. Fortunately, the ring-shape distribution keeps the peak intensities under 20% of the peak at zero offset frequency.
Efficiency of Spiral Acquisition
Table 1 lists spiral interleaves, readout times, and acquisition efficiency for three typical image resolutions of 0.86, 0.43, and 0.22 mm. The efficiency at eight for resolutions of 0.43 and 0.22 mm was achieved in our in vivo experiments detailed below. In general, based on our experience, efficiency between four and eight is achievable for both high resolutions.
Table.1.
Spiral sampling parameters on a whole-body 7T scanner.
| Image matrix size | Resolution (mm)* | Spiral interleaves | Spiral readout (ms)** | Spiral Efficiency*** |
|---|---|---|---|---|
| 256×256 | 0.86 | 64 | 3.440 | 4 |
| 32 | 5.920 | 8 | ||
| 16 | 11.040 | 16 | ||
|
| ||||
| 512×512 | 0.43 | 192 | 4.400 | 2.7 |
| 128 | 5.920 | 4 | ||
| 64 | 10.560 | 8 | ||
| 34 | 19.020 | 15 | ||
|
| ||||
| 1024×1024 | 0.22 | 512 | 6.240 | 2 |
| 256 | 10.300 | 4 | ||
| 128 | 20.160 | 8 | ||
It is actually a nominal resolution at a field of view of 220 mm.
The readout is calculated at a gradient of 36 mT/m and a slew rate of 153 mT/m/ms.
The efficiency is referred to as a ratio of the number of phase encodings for a rectangular sampling to the number of spiral interleaves.
Experiments on Phantoms
Figure 7 shows spiral images of a resolution phantom at two readouts. In the long-readout image (Fig. 7a), off-resonance artifacts are clearly visible in the dark holes (plastic bars) in the lowest three rows, which have diameters of 2, 4, and 6mm (from bottom to top), respectively. The artifacts were detached from the edges and extended to the central regions of the holes, especially in the bottom two rows, indicating a ring-shape distribution of its point spread function. This also led to an estimate of the main field inhomogeneity as 0.8 ppm when referring to Figs 5 and 6a. In the short-readout image (Fig. 7b) the off-resonance artifacts shrank back to the edges, indicating a disk-shape distribution of its point spread function. These artifacts are visible only in the bottom two rows.
Fig. 7.
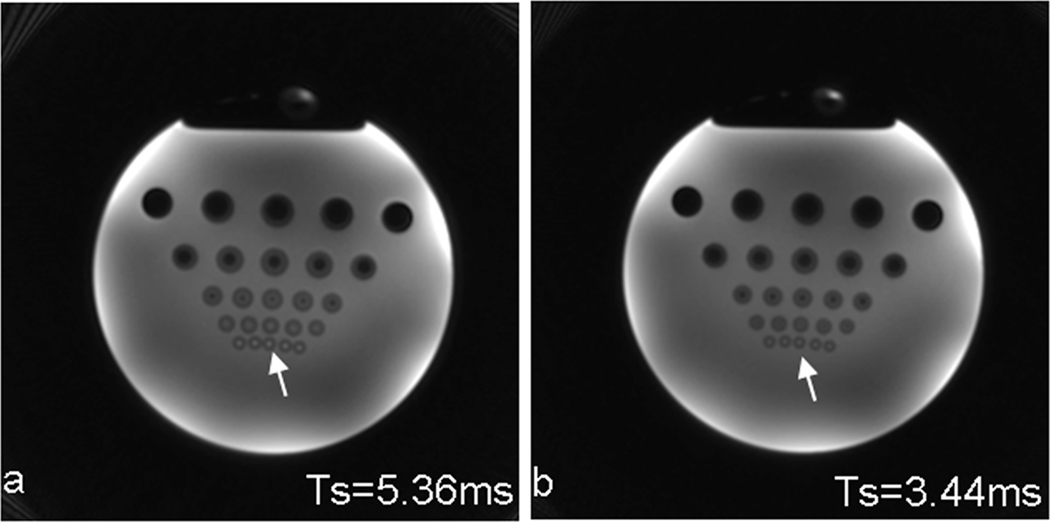
Spiral images of a resolution phantom at 7T for demonstrating image blurring from readout. The long readout (Ts=5.36ms) in a) clearly showed image blurring (arrow) while the short one (Ts=3.44ms) in b) reduced the blurring (arrow). Acquisition parameters: FOV=220mm, matrix size=256, , TE/TR = 0.59/100ms, slice thickness=2.5mm, and spirals=36 for Ts=5.36ms or 64 for Ts=3.44ms.
Experiments on Human Subjects
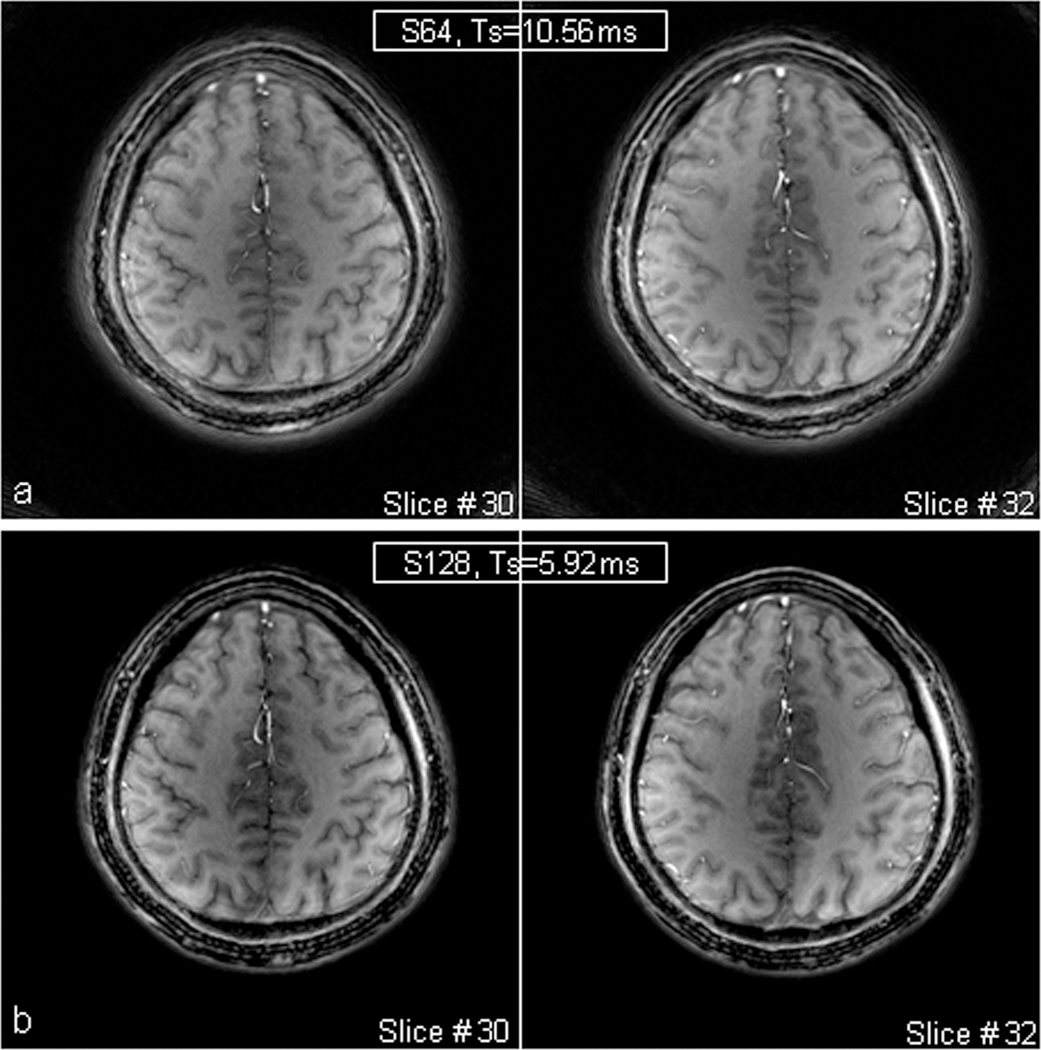
Figure 8 shows two slices of spiral images of a healthy volunteer’s brain at matrix size 512 with a short readout (5.92 ms) and a long readout (10.56 ms), respectively. While T1-weighted contrast in the images are decent, image blurring is visible in the images at a long readout in Fig. 8a. A short readout, near half of the long one, did reduce the blurring in the images in Fig. 8b. The spiral acquisition efficiency in these scans was eight in the top images and four in the bottom, respectively. This suggests that spiral acquisition with an efficiency of four for matrix size 512 (or resolution 0.43 mm) be acceptable in terms of small off-resonance blurring.
Fig. 8.
Spiral images of a healthy brain at 7T for showing blurring from readout. The short readout (Ts=5.92ms) in b) reduced image blurring visibly, compared with the long one (Ts=10.56ms) in a). Acquisition parameters: FOV=220mm, matrix size=512, , TE/TR = 1.18/100ms, slice thickness = 2.0mm, and spirals = 64 for Ts=10.56ms or 128 for Ts=5.92ms.
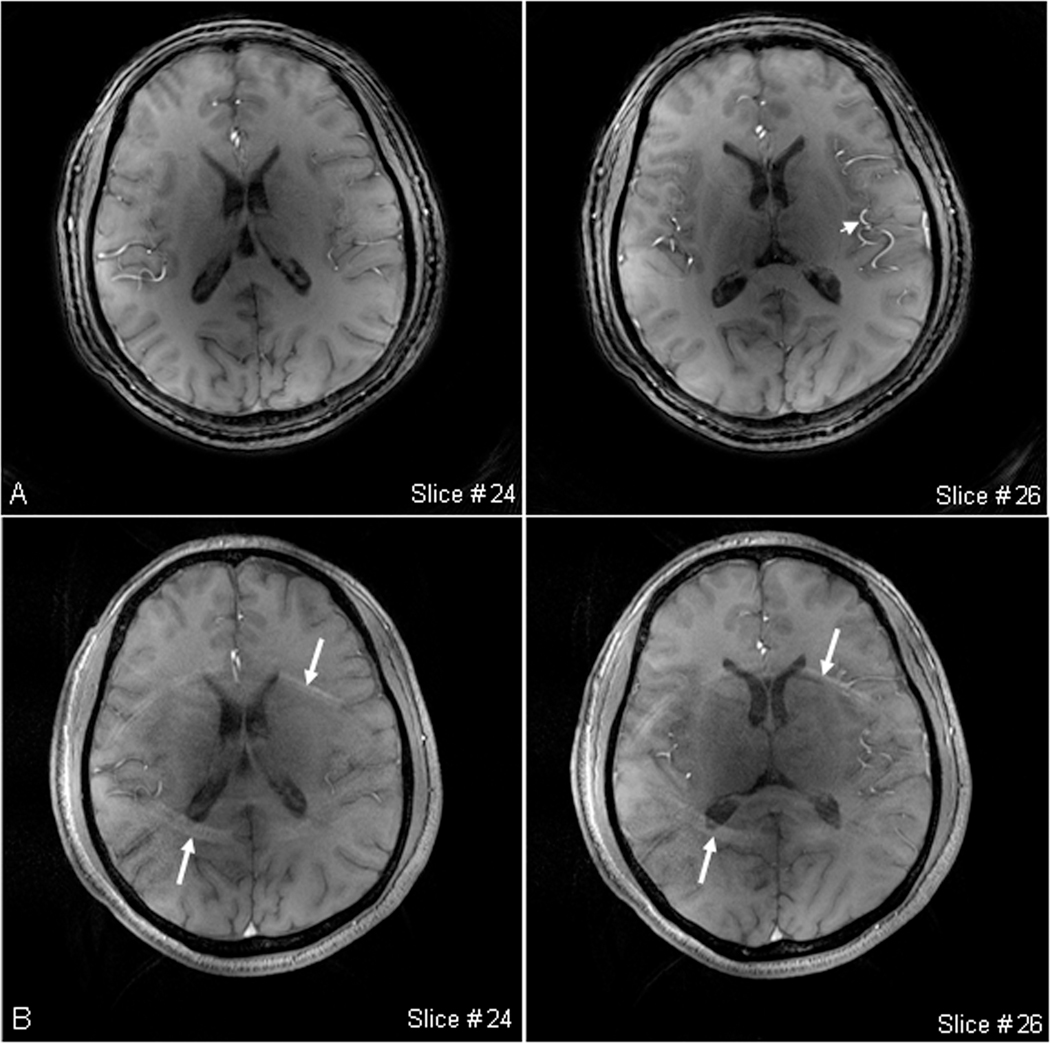
Figure 9a demonstrates spiral images of a healthy volunteer at matrix size 1024 and readout 20.32 ms. The image blurring is smaller than what we expected from such a long readout due to good shim (60Hz) in this scan. The bright blood vessels in the images were caused by the fresh blood flowing into the imaging slab from the outside during the data acquisitions. Out-volume suppression, a technique widely used on the 3T and 1.5T scanners, may be used to decrease the intensity of the blood vessels, but it was not employed in our scans due to SAR limitation on the 7T scanner. The spiral acquisition efficiency in this scan was eight with full Fourier sampling in the slab partitioning. Figure 9b shows GRE images of the same subject as reference for comparing image blurring. Overall quality of the spiral and GRE images was almost the same, except for visible undersampling artifacts in the GRE images (arrows in Fig. 9b) which were introduced by GRAPPA parallel imaging at a large acceleration factor of 4. An artery segment as indicated by the arrow in Fig. 9a was selected to quantitatively compare image blurring in both images. The measured diameter of the artery was 1.1±0.2 mm (mean±SD) in the spiral image and 1.3±0.4 mm in the GRE image, leading to no significant difference within the accuracy. The offset frequency in whole brain region at the slice location was measured on a field map (not shown) and the value was 24.0±29.7 Hz. Consequently, the image blurring in the spiral images was almost the same as that in the GRE images at an offset frequency of ~30 Hz (or a linewidth of ~60Hz).
Fig. 9.
High-resolution images for comparison at 7T: a) Spiral images of a healthy brain (FOV=220mm, matrix size=1024, TE/TR=1.18/100ms, , spirals=128 at a readout of 20.32ms, slices=60 at a thickness of 2mm, TA=12.8min), and b) GRE images of the same subject (FOV=220mm, matrix size=512, asymmetric echo, TE/TR=3.1/100ms, BW= 490Hz/px, , slices=60 at a thickness of 2mm, PF=6/8 in both slice and phase encoding directions, GRAPPA at factor 4, separate reference lines =128, TA=7.4min). The spiral images have an overall quality comparable with the GRE images, except for visible wraparound artifacts in the GRE images (arrows) due to a high acceleration factor used in GRAPPA. The measured diameter of an artery segment [short arrow in a)] is 1.1±0.2 mm on the spiral image and 1.3±0.4 mm on the GRE images.
Figure 10 demonstrates high-resolution spiral images of a phantom for measuring actual resolution. The linewidth of shim in this experiment was 53Hz, a very good shim resulted from a small shimming volume used. The measured image resolution was 0.322mm (i.e., 1.5 pixels) while the nominal image resolution was 0.215mm (one pixel size). This measured resolution was slightly larger than 1.2 pixels, the numerical resolution of spiral sampling in a disk region in the k-space (30). Therefore, the spiral imaging at 7T has achieved a high resolution as designed.
Fig. 10.
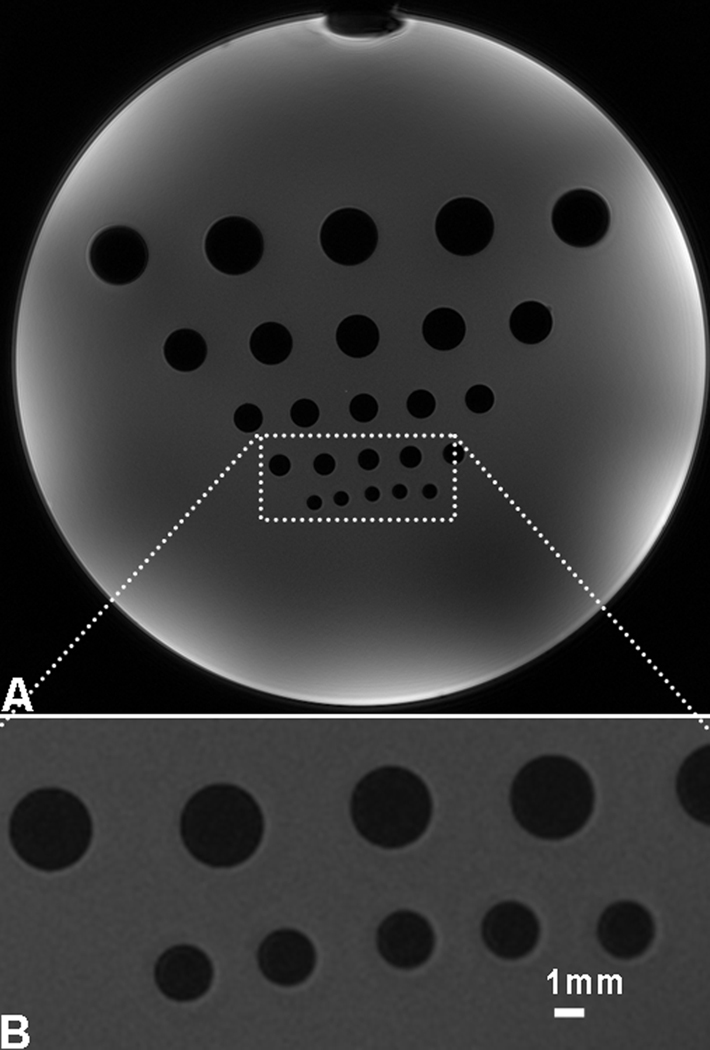
Resolution measurement at 7T: a) High-resolution spiral image of a phantom with plastic bars (dark holes) inside, of diameters from 2 to 10mm, and b) Zoom-in display of the rectangular region in a). The resolution measured at the edges of the smallest holes was 0.322mm (i.e., 1.5 pixels) while the nominal resolution was 0.215mm (a pixel size). Acquisition parameters: FOV=220mm, matrix size=1024, TE/TR=1.18/100ms, , spirals=128 at a readout of 20.32ms, and linewidth=53Hz from a reduced shimming volume.
DISCUSSION
It is a challenge to perform spiral imaging on whole-body 7T scanners in presence of large off-resonance frequencies. Our initial results are encouraging to those who are pursuing or interested in this acquisition-efficient technique. The proposed method, characteristic of multi-shot spirals and UTE acquisitions, was shown to be effective in reducing image blurring caused by off-resonance. The efficiency of spiral acquisition was, however, significantly lowered in this method due to massive interleaves used. Nevertheless, the efficiency still remained at four to eight at high spatial resolutions of 0.43–0.22 mm (or at large matrix sizes of 512–1024), and the spiral acquisition was still much faster than rectangular samplings. This efficiency is otherwise achieved using parallel imaging plus partial Fourier sampling.
Spiral imaging on whole-body 7T scanners is still a work-in-progress technique toward clinical applications. Below are main concerns on this technique from our experience.
Spiral image blurring is very sensitive to the shimming of main field ; good shim produces small offset frequencies and thus small image blurring. To get a good shim (e.g., linewidth < 60 Hz) on a whole-body 7T scanner is more difficult than on a 3T or 1.5T scanner due to lack of uniform excitations. Accordingly, the shimming alters from scan to scan, from subject to subject, and from coil to coil, leading to unstable quality of spiral images. Off-resonance correction would be helpful to stabilize the quality of spiral imaging. Great experience in off-resonance correction at 7T has been reported in Ref. 31 for high resolution spiral imaging and in Ref. 39 for high resolution EPI imaging, respectively.
Flip angle is a major factor determining the white/grey matter contrast on T1-weighted images based upon free induction decay (FID) collections as we did in this study. The T1-weighted contrast can be reversed at a small flip angle ( at TR=100 ms): white matter in dark and grey matter in bright (Fig. 11). Very short RF duration (<1ms) usually used in UTE imaging may not produce a flip angle large enough to generate positive T1-weighted contrast (i.e., white matter in bright and grey matter in dark) due to the limitation of coil voltage. A little longer RF duration (~2 ms) is thus needed, leading to an increase in minimum TE (e.g., RF duration=2ms and minimum TE=1.18ms in our AWSOS acquisitions in this study) and thus to a little loss in suppression of the off-resonance induced image blurring.
Fig. 11.
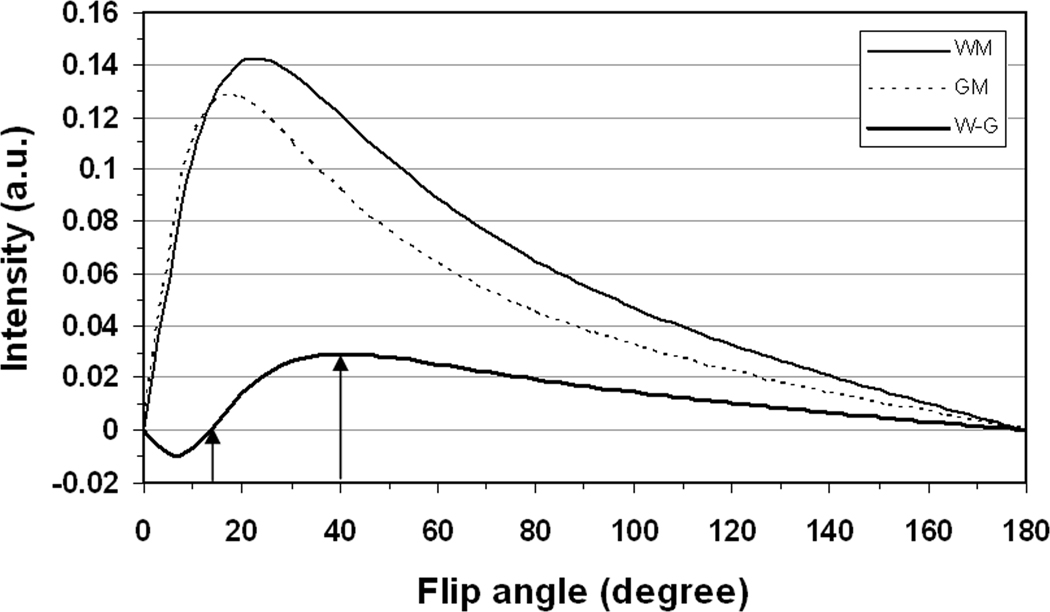
Transverse magnetizations of white matter (WM) and grey matter (GM) as well as their contrast (W-G) at steady state at 7T with TE/TR=1.18/100ms. The transverse magnetization for white matter (, T2*=23.3ms, and T1=1220ms) and grey matter (, T2*=24.2ms, and T1=2132ms). The contrast reversion occurs at flip angle (arrow) while the maximum contrast is reached at (arrow) under the parameters used.
Flip angle also alters inside and across slices due to strong inhomogeneity of excitation field on the 7T scanner. This requires an extra amount in flip angle to secure the positive T1-weighted contrast for the entire excited slab. This was the reason why a flip angle of 50°, 25% more than the maximum-contrast flip angle of 40°, was used in this study (Fig. 11). A large flip angle such as , usually raises a warning on special absorption rate (SAR) and a longer TR is then required. This safety issue is the main reason for the limitation of minimum TR in our AWSOS acquisitions.
The SAR warning also limits the selection of high sinc cycles (>1.5) in this study, leading to a non-uniform slab profile (decreasing in intensity at the end slices at both sides). Low SNR was found in these slices (the end-slice images were not shown in this paper) (30). A larger sinc cycle of 2.5 produced a flatter slab profile, but required longer sinc duration under the maximum coil voltage and thus increased echo time. It is worth to mention that this is not the case on the 3T scanners. These RF parameters (2ms in duration and 2.5 in cycle) worked well on our Siemens Tim Trio 3T scanners without SAR complaints. Other RF pulses such as Shinnar-Le-Roux (SLR) with a minimum phase may be used to improve the slab profile, but not convenient to change its flip angle or duration online (29).
CONCLUSIONS
It is a challenge to implement spiral imaging on whole-body 7T scanners due to strong off-resonance induced image blurring as shown in the computer simulations in this study. The proposed hybrid method has been demonstrated to be helpful in minimizing the image blurring and to make spiral imaging at 7T feasible. The efficiency of spiral imaging was unfortunately balanced down to eight or four because of massive interleaves used in the hybrid method, compared with that of rectangular acquisitions. The reduced efficiency, however, still makes spiral acquisition competitive to both parallel imaging and partial Fourier acquisitions. The use of ultra-short echo time (UTE) in the hybrid method helped minimize the signal loss caused by off-resonance spins before data collections, but limited the UTE spiral imaging to producing T1-weighted contrast. These FID-based T1-weighted images have high intensities of tissues/components with short-T2 relaxations and may, in future, provide useful information for disease diagnoses and investigations.
Acknowledgement:
This work was supported in part by NIH R01 NS044818 and R01 CA106840.
REFERENCES
- 1.Hennig J, Nererth A, Freidburg H. RARE imaging: A fast imaging method for clinical MR. Magn Reson Med 1986; 3: 823–833. [DOI] [PubMed] [Google Scholar]
- 2.Mansfield P, Pykett IL. Biological and medical imaging by NMR. J Magn Rson 1978; 29: 355–373. [DOI] [PubMed] [Google Scholar]
- 3.Ahn CB, Kim JH, Cho ZH. High-speed spiral-scan echo planar NMR imaging-I. IEEE Trans Med Imaging 1986; 5: 2–7. [DOI] [PubMed] [Google Scholar]
- 4.Yudilevich E, Stark H. Spiral sampling in magnetic resonance imaging-the effect of inhomogeneities. IEEE Trans Med Imaging 1987; 6: 337–345. [DOI] [PubMed] [Google Scholar]
- 5.Meyer CH, Macovski A. Square spiral fast imaging: interleaving and off-resonance effects. In 6th Annu Mtg Soc Magn Res Med 1987; p.230. [Google Scholar]
- 6.Mugler JP 3rd, Brookeman JR. Three-dimensional magnetization-prepared rapid gradient-echo imaging (3D MP RAGE). Magn Reson Med. 1990;15: 152–157. [DOI] [PubMed] [Google Scholar]
- 7.Haacke EM, Brown RW, Thompson MR, Venkatesan R. Magnetic resonance imaging-Physical principles and sequence design. New York: John Wiley & Sons, Inc.; 1999. [Google Scholar]
- 8.Pruessmann KP, Weiger M, Scheidegger MB, Boesiger P. SENSE: Sensitivity encoding for fast MRI. Magn Reson Med 1999; 42:952–962. [PubMed] [Google Scholar]
- 9.Griswold MA, Jakob PM, Heidemann RM, Nittka M, Jellus V, Wang J, Kiefer B, Haase A. Generalized autocalibrating partially parallel acquisitions (GRAPPA). Magn Reson Med. 2002; 47: 1202–1210. [DOI] [PubMed] [Google Scholar]
- 10.Sodickson DK, Manning WJ. Simultaneous acquisition of spatial harmonics (SMASH): Fast imaging with radiofrequency coil array. Magn Reson Med 1997; 38: 591–603. [DOI] [PubMed] [Google Scholar]
- 11.Maeda A, Yokoyama T. Reducing chemical shift artifacts in MRI in time-varying gradients. IEEE Trans Med Imaging 1989; 8: 8–15. [DOI] [PubMed] [Google Scholar]
- 12.Noll DC, Meyer CH, Pauly JM, Nishimura DG, Macovski A. A homogeneity correction method for magnetic resonance imaging with time-varying gradients. IEEE Trans Med Imaging 1991; 10: 629–637. [DOI] [PubMed] [Google Scholar]
- 13.Noll DC, Pauly JM, Meyer CH, Nishimura DG, Macovski A. Deblurring for non-2D Fourier transform magnetic resonance imaging. Magn Reson Med 1992; 25: 319–333. [DOI] [PubMed] [Google Scholar]
- 14.Man LC, Pauly JM, Macovski A. Multifrequency interpolation for fast off-resonance correction. Magn Reson Med 1997; 37: 785–792. [DOI] [PubMed] [Google Scholar]
- 15.Harshbarger TB, Twieg DB. Iterative reconstruction of single-shot spiral MRI with off resonance. IEEE Trans Med Imaging. 1999; 18: 196–205. [DOI] [PubMed] [Google Scholar]
- 16.Schomberg H. Off-resonance correction of MR images. IEEE Trans Med Imaging 1999; 18: 481–495. [DOI] [PubMed] [Google Scholar]
- 17.Börnert P, Schomberg H, Aldefeld B, Groen J. Improvements in spiral MR imaging. MAGMA 1999; 9: 29–41. [DOI] [PubMed] [Google Scholar]
- 18.Luk-Pat GT, Nishimura DG. Reducing off-resonance distortion by echo-time interpolation. Magn Reson Med 2001; 45: 269–276. [DOI] [PubMed] [Google Scholar]
- 19.Nayak KS, Tsai CM, Meyer CH, Nishimura DG. Efficient off-resonance correction for spiral imaging. Magn Reson Med 2001; 45: 521–524. [DOI] [PubMed] [Google Scholar]
- 20.Chen W, Meyer CH. Fast automatic linear off-resonance correction method for spiral imaging. Magn Reson Med 2006; 56: 457–462. [DOI] [PubMed] [Google Scholar]
- 21.Mansfield P. Real-time echo-planar imaging by NMR. Br Med Bull 1984; 40: 187–190. [DOI] [PubMed] [Google Scholar]
- 22.Cuppen JJM, Groen JP, Konijn J. magnetic resonance fast Fourier imaging. Med Phys 1986; 13: 248–253. [DOI] [PubMed] [Google Scholar]
- 23.Stehling MK, Turner R, Mansfield P. Echo-planar imaging: magnetic resonance imaging in a fraction of a second. Science 1991; 254(5028): 43–50. [DOI] [PubMed] [Google Scholar]
- 24.Twieg DB. Acquisition and accuracy in rapid NMR imaging methods. Magn Reson Med 1985; 2: 437–452. [DOI] [PubMed] [Google Scholar]
- 25.Sekihara K, Kohno H. Image restoration from nonuniform static field influence in modified echo-planar imaging. Med Phys 1987; 14: 1087–1089. [DOI] [PubMed] [Google Scholar]
- 26.Feinberg DA, Turner R, Jakab PD, von Kienlin M. Echo-planar imaging with asymmetric gradient modulation and inner-volume excitation. Magn Reson Med 1990; 13: 162–169. [DOI] [PubMed] [Google Scholar]
- 27.Farzaneh F, Riederer SJ, Pelc NJ. Analysis of T2 limitations and off-resonance effects on spatial resolution and artifacts in echo-planar imaging. Magn Reson Med 1990; 14: 123–139. [DOI] [PubMed] [Google Scholar]
- 28.Xiang QS, Ye FQ. Correction for geometric distortion and N/2 ghosting in EPI by phase labeling for additional coordinate encoding (PLACE). Magn Reson Med 2007; 57: 731–741. [DOI] [PubMed] [Google Scholar]
- 29.Bernstein MA, King KF, Zhou XJ. Handbook of MRI pulse sequences. Burlington: Elsevier Academic Press; 2004. [Google Scholar]
- 30.Qian Y, Boada FE. Acquisition-weighted stack of spirals for fast high-resolution three-dimensional ultra-short echo time MR imaging. Magn Reson Med 2008; 60:135–145. [DOI] [PMC free article] [PubMed] [Google Scholar]
- 31.Börner P, Teeuwisse WM, Eggers H, van Buchem MA, van Osch MJ. High resolution T2* weighted reverse and forward spiral imaging at 7 tesla. In: Proceedings of the 16th Annual Meeting of ISMRM, Toronto, 2008. p1331. [Google Scholar]
- 32.Pfeuffer J, Van de Moortele PF, Ugurbil K, Hu X, Glover GH. Correction of physiologically induced global off-resonance effects in dynamic echo-planar and spiral functional imaging. Magn Reson Med 2002; 47: 344–353. [DOI] [PubMed] [Google Scholar]
- 33.Haacke EM, Xu Y, Cheng YC, Reichenbach JR. Susceptibility weighted imaging (SWI). Magn Reson Med. 2004; 52: 612–618. [DOI] [PubMed] [Google Scholar]
- 34.Duyn JH, van Gelderen P, Li TQ, de Zwart JA, Koretsky AP, Fukunaga M. High-field MRI of brain cortical substructure based on signal phase. Proc Natl Acad Sci 2007; 104: 11796–11801. [DOI] [PMC free article] [PubMed] [Google Scholar]
- 35.Glover GH. Simple analytic spiral k-space algorithm. Magn Reson Med 1999; 42:412–415. [DOI] [PubMed] [Google Scholar]
- 36.Jackson JI, Meyer CH, Nishimura DG, Macovski A. Selection of a convolution function for Fourier inversion using gridding. IEEE Trans Med Imaging 1991; MI-10:473–478. [DOI] [PubMed] [Google Scholar]
- 37.Hoge RD, Kwan KS, Pike GB. Density compensation functions for spiral MRI. Magn Reson Med 1997; 38:117–128. [DOI] [PubMed] [Google Scholar]
- 38.Luk-Pat GT, Nishimura DG. Reducing off-resonance distortion by echo-time interpolation. Magn Reson Med 2001; 45:269–276. [DOI] [PubMed] [Google Scholar]
- 39.Speck O, Stadler J, Zaitsev M. High resolution single-shot EPI at 7T. Magn Reson Mater Phy 2008; 21:73–86. [DOI] [PubMed] [Google Scholar]


