

Abstract
Objective
The Montreal Cognitive Assessment (MoCA) is among the most frequently administered cognitive screening tests, yet demographically diverse normative data are needed for repeated administrations.
Method
Data were obtained from 18,410 participants using the National Alzheimer’s Coordinating Center Uniform Data Set. We developed regression-based norms using Tobit regression to account for ceiling effects, explored test–retest reliability of total scores and by domain stratified by age and diagnosis with Cronbach’s alpha, and reported the cumulative change frequencies for individuals with serial MoCA administrations to gage expected change.
Results
Strong ceiling effects and negative skew were observed at the total score, domain, and item levels for the cognitively normal group, and performances became more normally distributed as the degree of cognitive impairment increased. In regression models, years of education was associated with higher MoCA scores, whereas older age, male sex, Black and American Indian or Alaska Native race, and Hispanic ethnicity were associated with lower predicted scores. Temporal stability was adequate and good at the total score level for the cognitively normal and cognitive disorders groups, respectively, but fell short of reliability standards at the domain level.
Conclusions
MoCA total scores are adequately reproducible among those with cognitive diagnoses, but domain scores are unstable. Robust regression-based norms should be used to adjust for demographic performance differences, and the limited reliability, along with the ceiling effects and negative skew, should be considered when interpreting MoCA scores.
Keywords: MoCA, Normative data, Blind, Regression, Reliability, Reliable change
INTRODUCTION
Cognitive screening tests are useful to rapidly quantify cognitive functioning. Scores are often used to form clinical hypotheses, monitor cognitive changes over time, and to identify individuals in need of more comprehensive evaluation. The Montreal Cognitive Assessment (MoCA; Nasreddine,et al., 2005) is one of the most frequently administered cognitive screening tests (Dautzenberg,et al., 2020; Rabin,et al., 2016). Nasreddine,and,coworkers,(2005) developed the MoCA to address the limitations of the Mini Mental State Examination (MMSE; Folstein,et al., 1975) by including items that more directly address executive functioning, language, and attention, abilities that are often affected by a wide range of neurocognitive syndromes (Burke,et al., 2021; Luis,et al., 2009; McPherson&Koltai, 2018; Roalf,et al., 2013; Smith,et al., 2007). Relative to the MMSE, the MoCA more accurately discriminates between healthy controls and those with a variety of cognitive conditions, such as mild cognitive impairment (MCI), Alzheimer’s disease, Parkinson’s disease, and Korsakoff’s syndrome (Hoops,et al., 2009; Oudman,et al., 2014; Pinto,et al., 2018; Roalf,et al., 2013). Although the MoCA is generally psychometrically superior to the MMSE, its interpretation is limited by the lack of normative data compared to the MMSE (e.g., Folstein, Folstein&Fanjiang, 2002); however, independent authors have recently made efforts to address these shortcomings (Sachs,et al., 2021; Weintraub,et al., 2018).
Several demographic variables influence cognitive performances and are related to MoCA scores. MoCA scores tend to decline with age and fewer years of formal education, and in the United States, scores tend to be lower among racial minorities (Carson,et al., 2018; Milani,et al., 2018; Rossetti,et al., 2019). Guidance from multiple classification rubrics suggests that cognitive functioning be interpreted from the perspective of relative declines from premorbid abilities (Albert,et al., 2011; American,Psychiatric,Association, 2022; Petersen,et al., 1999). Consequently, using a rigid cutoff score across all groups disproportionately overdiagnoses individuals who are older, less educated, and members of racial minority groups. To address this, many authors have developed MoCA cutoff scores that differ according to age, race, ethnicity, and years of education (Carson,et al., 2018; Milani,et al., 2018; Rossetti,et al., 2019). A complementary analytic approach to using different cutoffs based upon demographics is to characterize performance with demographically adjusted score distributions.
The nomothetic approach to data analyses involves comparing observed scores to normative expectations. With such an approach, the scores of large groups of people are summarized either by way of normative tables or through regression-based estimation. The advantage of regression estimation is the ability to simultaneously adjust for multiple demographic factors including infrequent demographic score combinations. There are some normative data for the MoCA using non-overlapping and overlapping norming methods (Jeffers, 2019; Malek-Ahmadi,et al., 2015; Rossetti,et al., 2011); however, we are aware of only two large-scale regression-based normative studies (Sachs,et al., 2021; Weintraub,et al., 2018). Weintraub,et al.(2018) observed that age, education, and sex were significant predictors, with higher scores among educated women. Race/ethnicity was not examined in this study due to having a predominantly White sample. Sachs,et al.’s,(2021) final beta-binomial regression model included race/ethnicity, sex, age, and education, which in total accounted for 24.4% of the variance in MoCA performance. They observed higher scores among individuals who were White, female, and had more years of formal education. These efforts address a gap in the literature by characterizing performance at a single point in time but do not directly address interval change nor the stability of scores over repeated administrations.
The group of techniques for establishing whether initial/follow-up differences fall within the range of expected test–retest variability are collectively referred to as “reliable change” (RCI) metrics. With statistically significant change, clinicians can hypothesize neuropsychologically grounded reasons for changes in performance. All RCIs should incorporate estimates of regression to the mean, practice effects, and even differential practice effects (Hinton-Bayre&Kwapil, 2017). RCIs have provided thresholds for characterizing meaningful differences in scores across administrations of the MoCA (Cooley,et al., 2015; Kopecek,et al., 2016; Krishnan,et al., 2017). Although helpful, the generalizability of these studies is limited because of small samples, multi-year testing intervals, or use of non-English MoCA versions.
All RCI approaches depend heavily on the test–retest reliability of the measure; however, internal consistency estimates may be used in place of test–retest data. The MoCA has demonstrated modest internal consistency in cognitively normal groups (α = 0.50–0.63) and higher coefficients among clinical groups (α = 0.75) and mixed samples of patients and controls (α = 0.83; Bernstein,et al., 2011; Nasreddine,et al., 2005). Cooley,et al.(2015) examined the MoCA in cognitively healthy older adults, obtaining temporal stability coefficients of 0.33 and 0.48 at 1 and 4 years, respectively. These coefficients are generally lower than those obtained from cognitively healthy individuals on standard neuropsychological measures (Calamia,et al., 2013). Using a standardized regression-based change approach, Kiselica,et al.(2020) observed that individuals with higher levels of education and higher baseline test scores tended to have better Time 2 test scores. The time between evaluations and race did not significantly predict Time 2 test scores, supporting prior findings that race influences the baseline test score but not the interval change.
Although the MoCA is typically interpreted based on the total 30-item score, MoCA items are grouped by discrete cognitive domains, providing the opportunity to characterize performance by apparent cognitive domain. However, it is likely that MoCA domain scores are less reliable than the MoCA total score, in part due to fewer number of items included in each domain. Low reliability might limit detailed analysis of cognitive weaknesses. However, many of the psychometric limitations of the MoCA may be more apparent with cognitively healthy individuals than people with cognitive impairments. As with most cognitive screening tests, the MoCA is more appropriate for differentiating performance levels among impaired individuals than for quantifying normal ranges of cognition. Estimates of MoCA internal consistency tend to be higher in clinical groups (Bernstein,et al., 2011) since they avoid ceiling effects in healthy participants. It remains to be seen if the reliability coefficients derived from clinical groups improve because of fewer ceiling effects and the subsequent lack of negative skew.
In addition to standard MoCA administration, there may be instances where it is not feasible to administer the visually based items on the MoCA (e.g., sensory impairments, limited upper extremity mobility, and telephone administration). The non-visually based MoCA items have been validated in several clinical studies and have been referred to using various names (e.g., MoCA-22, MoCA-Blind, and Telephone-MoCA). The MoCA-22 removes the visual stimuli (e.g., visuospatial/executive and confrontation naming domains) and has a maximum total score of 22. Several cutoff scores have been proposed ranging from ≤18 to ≤19 (Benge&Kiselica, 2021; Katz,et al., 2021; Wittich,et al., 2010); however, we are not aware of published guidance pertaining to normative expectations, reliability, or temporal stability for the MoCA-22. These data are needed because with short forms, it is generally not advisable to simply prorate without first empirically examining the degree to which the short and longer measures differ psychometrically. It is usually the case that the shorter measure provides increased efficiency at the expense of reliability.
In this report, we develop demographically and regression-based normative data, temporal stability, and reliable change indices to enhance the clinical interpretability of both the MoCA and MoCA-22. In addition, we report the reliability of cognitive domain scores within the MoCA and MoCA-22.
MATERIALS AND METHODS
Data were obtained from the National Alzheimer’s Coordinating Center (NACC) Uniform Data Set (UDS). Individuals were categorized along a continuum of cognitive impairment, with groups including those who were cognitively normal and those with diagnoses of amnestic MCI or dementia. Diagnoses were made by a consensus team or a physician who conducted the evaluation based upon the Alzheimer’s Disease Research Center’s (ADRC) protocol including review of medical history, interview with the patient and informant (when applicable), neuroimaging when available, behavioral observations, and/or neuropsychological data including the MoCA. Normal cognition was diagnosed if (a) global Clinical Dementia Rating (CDR) score was zero and/or neuropsychological testing was within the normal range and (b) there were no behavioral indicators of neuropathology during the clinical evaluation. The MCI core clinical criteria were outlined as follows: (a) subjective or collateral concern about a change in cognition, (b) impairment in one or more cognitive domains, and (c) largely preserved independence in functional abilities. Dementia was diagnosed if (a) the participant had cognitive or neuropsychiatric symptoms that (i) interfered with the ability to function at work or at usual activities, (ii) represented a decline from previous functioning, (iii) were not explained by delirium or major psychiatric disorder, and (iv) included cognitive impairment detected and diagnosed though a combination of history-taking and objective cognitive assessment and (b) demonstrated impairment in one or more functional domain.
Analyses used data from 36 ADRCs, and Version 3 (v3) of the UDS with visits conducted between March 2015 and March 2022. The UDS v3 neuropsychological battery consists of the MoCA, Craft Story (Craft,et al., 1996), Benson Figure (Possin,et al., 2011), Number Span Test forward and backward, Multilingual Naming Test (MINT; Gollan,et al., 2012), word fluency (F and L words, animals, vegetables), and Trail Making Test Part A and B (Army,Individual,Test,Battery, 1944). The MoCA contains 13 tasks measuring visuospatial/executive (5 points), confrontation naming (3 points), attention (6 points), language (3 points), verbal abstraction (2 points), memory (5 points), and orientation (6 points) for a total of 30 points. The MoCA-22 contains 10 of the 13 tasks, removing the visuospatial/executive and confrontation naming sections for a total of 22 points.
Data Analyses
Descriptive statistics including measures of central tendency, frequency, and distribution characteristics were used to characterize the sample and MoCA/MoCA-22 scores by item and domain. These data were provided for both the overall sample and stratified by cognitive diagnosis. Differences in demographic characteristics were compared between diagnostic groups using chi-square tests or analysis of variance and Tukey's honest significantly difference (HSD) test for post-hoc comparisons as appropriate.
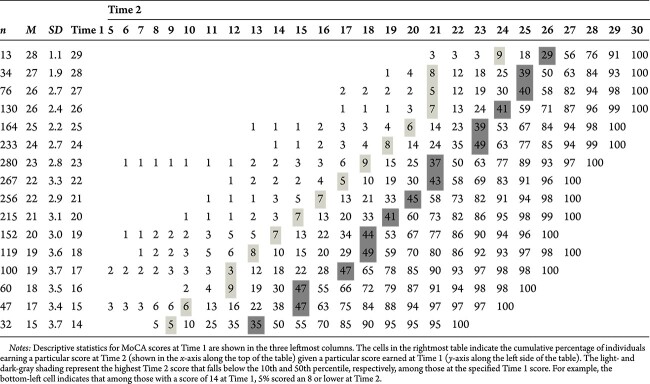
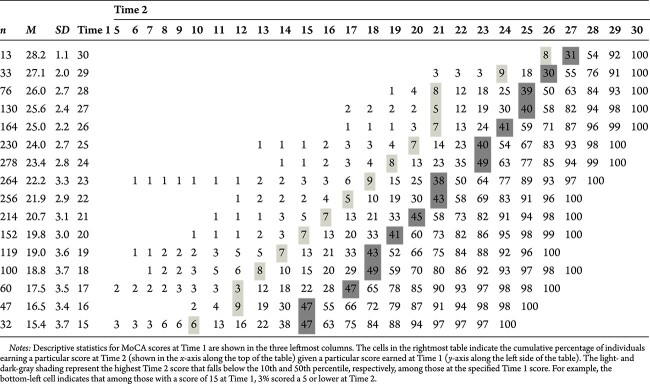
Reliability (temporal stability) was calculated for each MoCA domain using both Pearson and Spearman correlations to account for the non-normal distribution and ceiling effect. Given differences in base rates of neurocognitive disorder across the lifespan, we also stratified these data by age and provided data for the full sample, individuals younger than 50 years, and individuals 50 years of age and or older both in aggregate and stratified by decade. Descriptive statistics were also provided for the length of time between MoCA administrations. To further explore the temporal stability of MoCA total scores, we presented a matrix of cumulative percentages for scores at Time 1 and 2 for normal and MCI groups for all ages and those 50 and older. The purpose of the cumulative percentage tables is to provide interpretative guidance for MoCA re-test scores. Use of these tables avoids the risk of misinterpreting absolute differences in raw scores that do not take factors such as regression to the mean and practice effects into consideration. Table ranges were truncated when the number of observations for a total score was below 20, and values below the score at Time 2 where cumulative percentages were less than 2%.
Lastly, regression-based norms were derived for the MoCA/MoCA-22 total scores in a series of models including combinations of commonly available demographic characteristics to fit a variety of use cases to maximize clinical applicability. For example, certain demographic variables may either be restricted or unavailable for use in certain contexts, such as forensic or employment settings and those that otherwise might limit regression-based norm estimation. Given the skewness and ceiling effect of MoCA/MoCA-22 scores, we used Tobit regression to estimate these linear relationships (Tobit, 1958). In these models, MoCA Total or MoCA-22 scores at Time 1 were regressed on the combinations of demographic variables to then create demographically adjusted baseline scores. Separate sets of regression models were used for individuals younger and older than 50 years old. In the 50 years and older models, age was modeled as a quadratic function due to the curvilinear relationship between age and MoCA/MoCA-22 score that was not present in the younger group. The regression models were then used to develop demographically adjusted norms presented as percentiles in table format by defining the cumulative distribution function for each possible raw score conditional on combinations of specified demographic variables. We provided percentiles consistent with recommendations from the American Academy of Clinical Neuropsychology consensus conference statement (Guilmette,et al., 2020).
We provide a large quantity of tables to present the data and have grouped them according to clinical use. Tables 1–3 relate to the descriptive statistics of the sample and MoCA data. Tables 4 and 5 provide data on the temporal stability and describe the change in MoCA scores between test–retest intervals. Tables 6–10 display cumulative percentage data that provide clinicians with a framework for interpreting MoCA scores on a subsequent administration. Tables 10 and 11 are Tobit regression models used to create the regression-based norms presented in Tables 13–16.
Table 1.
Sample demographics
| Variable | Normal | MCI | Dementia | Contrasts/Chi-square | ||||||
|---|---|---|---|---|---|---|---|---|---|---|
| n | M (or %) | SD (range) | n | M (or %) | SD (range) | n | M (or %) | SD (range) | ||
| Age | 10,165 | 70.53 | 10.49 (18–101) | 3973 | 72.94 | 9.35 (22–106) | 4,272 | 71.75 | 10.48 (24–103) | A < C < B |
| Education | 10,115 | 16.11 | 2.86 (0–29) | 3944 | 15.86 | 3.04 (0–26) | 4,233 | 15.39 | 3.21 (0–30) | C < B < A |
| Sex: male | 3593 | 35.3% | 2016 | 50.7% | 2,199 | 51.5% | χ2, p < .001 | |||
| Race | χ2, p < .001 | |||||||||
| White | 7943 | 78.1% | 3166 | 79.7% | 3,721 | 87.1% | ||||
| Black | 1652 | 16.3% | 596 | 15.0% | 327 | 7.7% | ||||
| Am. Indian or Alaska Native | 91 | 0.9% | 29 | 0.7% | 28 | 0.7% | ||||
| Native Hawaiian or Pac. Islander | 13 | 0.1% | 5 | 0.1% | 6 | 0.1% | ||||
| Asian | 315 | 3.1% | 112 | 2.8% | 110 | 2.6% | ||||
| Other | 81 | 0.8% | 31 | 0.8% | 38 | 0.9% | ||||
| Unknown | 70 | 0.7% | 34 | 0.9% | 42 | 1.0% | ||||
| Hispanic | χ2, p < .001 | |||||||||
| No | 9413 | 92.6% | 3615 | 91.0% | 4,012 | 93.9% | ||||
| Yes | 703 | 6.9% | 344 | 8.7% | 245 | 5.7% | ||||
| Unknown | 49 | 0.5% | 14 | 0.4% | 15 | 0.4% | ||||
| Handedness | χ2, p = .001 | |||||||||
| Left | 840 | 8.3% | 396 | 10.0% | 408 | 9.6% | ||||
| Right | 9089 | 89.8% | 3462 | 87.8% | 3,773 | 88.8% | ||||
| Ambidextrous | 196 | 1.9% | 86 | 2.2% | 66 | 1.6% | ||||
Note: Contrasts performed using the Tukey HSD method and all relationships shown were significant at the p < .001 level.
Table 3.
Percentage of sample earning maximum points by domain, item, and total
| Normal | MCI | Dementia | Any impairment | |
|---|---|---|---|---|
| Visuospatial/Executive | 46 | 24 | 10 | 17 |
| Trails | 82 | 70 | 39 | 54 |
| Copy | 66 | 49 | 30 | 39 |
| Clock Total | 72 | 51 | 22 | 36 |
| Contour | 99 | 97 | 87 | 92 |
| Numbers | 93 | 84 | 51 | 67 |
| Hands | 77 | 58 | 26 | 42 |
| Naming | 86 | 75 | 55 | 64 |
| Attention | 70 | 50 | 21 | 35 |
| Digit Span | 86 | 79 | 57 | 67 |
| Letter Tapping | 96 | 89 | 60 | 74 |
| Serial sevens | 82 | 66 | 33 | 49 |
| Language | 87 | 36 | 15 | 25 |
| Repetition | 67 | 50 | 28 | 39 |
| Fluency | 81 | 65 | 38 | 51 |
| Abstraction | 77 | 63 | 33 | 48 |
| Delayed Recall | 25 | 5 | 1 | 3 |
| Orientation | 92 | 72 | 22 | 46 |
| Date | 96 | 85 | 41 | 62 |
| Month | >99 | 97 | 67 | 82 |
| Year | >99 | 97 | 64 | 80 |
| Day | >99 | 93 | 57 | 74 |
| Place | 97 | 90 | 54 | 71 |
| City | >99 | 98 | 83 | 90 |
| Blind Total | 12 | 1 | <1 | <1 |
| Total score | 7 | 5 | <1 | <1 |
Table 4.
Reliability of MoCA scores from Time 1 and Time 2 by domain
| All ages | <50 | ≥50 | 50–59 | 60–69 | 70–79 | 80–89 | 90+ | |||||||||||||||||
|---|---|---|---|---|---|---|---|---|---|---|---|---|---|---|---|---|---|---|---|---|---|---|---|---|
| Normal | Impaired | All | Normal | Impaired | All | Normal | Impaired | All | Normal | Impaired | All | Normal | Impaired | All | Normal | Impaired | All | Normal | Impaired | All | Normal | Impaired | All | |
| n = 7379 | n = 4544 | n = 11,923 | n = 200 | n = 41 | n = 241 | n = 7179 | n = 4503 | n = 11,682 | n = 532 | n = 350 | n = 882 | n = 2225 | n = 1174 | n = 3399 | n = 2975 | n = 1835 | n = 4810 | n = 1292 | n = 1014 | n = 2306 | n = 155 | n = 130 | n = 285 | |
| Visuospatial/Executive | 0.47/0.44 | 0.67/0.65 | 0.66/0.59 | 0.38/0.34 | 0.82/0.82 | 0.73/0.54 | 0.47/0.44 | 0.67/0.65 | 0.66/0.59 | 0.55/0.49 | 0.77/0.78 | 0.80/0.73 | 0.43/0.40 | 0.67/0.66 | 0.66/0.57 | 0.42/0.40 | 0.63/0.61 | 0.62/0.55 | 0.51/0.47 | 0.66/0.65 | 0.65/0.60 | 0.51/0.46 | 0.62/0.61 | 0.63/0.58 |
| Clock total | 0.31/0.28 | 0.55/0.53 | 0.55/0.48 | 0.33/0.33 | 0.66/0.69 | 0.63/0.54 | 0.31/0.28 | 0.55/0.53 | 0.54/0.48 | 0.36/0.34 | 0.65/0.65 | 0.70/0.63 | 0.25/0.22 | 0.56/0.55 | 0.54/0.47 | 0.28/0.27 | 0.50/0.47 | 0.50/0.44 | 0.36/0.30 | 0.55/0.53 | 0.54/0.49 | 0.41/0.42 | 0.50/0.48 | 0.54/0.51 |
| Naming | 0.37/0.38 | 0.61/0.53 | 0.58/0.49 | 0.08/0.17 | 0.60/0.52 | 0.46/0.43 | 0.37/0.38 | 0.61/0.53 | 0.58/0.49 | 0.19/0.20 | 0.64/0.54 | 0.60/0.48 | 0.32/0.32 | 0.65/0.56 | 0.60/0.49 | 0.35/0.36 | 0.60/0.53 | 0.55/0.47 | 0.43/0.44 | 0.58/0.51 | 0.57/0.50 | 0.42/0.42 | 0.65/0.50 | 0.59/0.47 |
| Attention | 0.48/0.36 | 0.69/0.62 | 0.69/0.54 | 0.05/0.13 | 0.72/0.72 | 0.70/0.44 | 0.49/0.36 | 0.69/0.62 | 0.69/0.54 | 0.45/0.33 | 0.71/0.69 | 0.76/0.65 | 0.48/0.35 | 0.73/0.65 | 0.72/0.55 | 0.46/0.34 | 0.67/0.59 | 0.65/0.51 | 0.53/0.41 | 0.66/0.56 | 0.66/0.52 | 0.48/0.43 | 0.71/0.64 | 0.68/0.57 |
| Language | 0.50/0.43 | 0.63/0.62 | 0.63/0.57 | 0.46/0.40 | 0.49/0.52 | 0.65/0.59 | 0.50/0.43 | 0.63/0.62 | 0.63/0.57 | 0.41/0.38 | 0.66/0.66 | 0.69/0.64 | 0.50/0.42 | 0.68/0.66 | 0.65/0.58 | 0.50/0.43 | 0.60/0.58 | 0.60/0.55 | 0.53/0.47 | 0.61/0.59 | 0.62/0.58 | 0.43/0.35 | 0.62/0.61 | 0.55/0.51 |
| Delayed Recall | 0.51/0.49 | 0.65/0.65 | 0.71/0.70 | 0.39/0.38 | 0.76/0.74 | 0.63/0.55 | 0.51/0.49 | 0.65/0.65 | 0.71/0.70 | 0.41/0.38 | 0.67/0.66 | 0.73/0.70 | 0.44/0.43 | 0.65/0.67 | 0.69/0.66 | 0.49/0.48 | 0.64/0.64 | 0.70/0.69 | 0.55/0.53 | 0.62/0.61 | 0.69/0.70 | 0.48/0.48 | 0.50/0.50 | 0.62/0.65 |
| Orientation | 0.15/0.12 | 0.75/0.69 | 0.78/0.61 | 0.07/0.07 | 0.76/0.79 | 0.83/0.66 | 0.16/0.12 | 0.75/0.69 | 0.78/0.61 | 0.20/0.16 | 0.70/0.68 | 0.76/0.70 | 0.11/0.07 | 0.72/0.66 | 0.74/0.57 | 0.11/0.11 | 0.73/0.69 | 0.76/0.60 | 0.22/0.15 | 0.80/0.73 | 0.82/0.63 | 0.21/0.19 | 0.81/0.76 | 0.83/0.68 |
| MoCA-22 Score | 0.64/0.57 | 0.83/0.81 | 0.86/0.79 | 0.55/0.52 | 0.85/0.85 | 0.87/0.68 | 0.64/0.57 | 0.83/0.81 | 0.86/0.79 | 0.60/0.49 | 0.84/0.85 | 0.89/0.80 | 0.60/0.55 | 0.84/0.81 | 0.86/0.76 | 0.61/0.56 | 0.81/0.79 | 0.84/0.78 | 0.66/0.57 | 0.84/0.82 | 0.86/0.79 | 0.67/0.61 | 0.85/0.82 | 0.85/0.81 |
| MoCA Total score | 0.69/0.63 | 0.85/0.83 | 0.88/0.82 | 0.61/0.57 | 0.89/0.88 | 0.89/0.72 | 0.69/0.63 | 0.85/0.83 | 0.88/0.82 | 0.67/0.57 | 0.86/0.86 | 0.91/0.84 | 0.63/0.60 | 0.86/0.83 | 0.88/0.79 | 0.66/0.60 | 0.84/0.81 | 0.87/0.80 | 0.73/0.63 | 0.87/0.84 | 0.88/0.82 | 0.76/0.70 | 0.90/0.84 | 0.90/0.86 |
| Days between assessments | ||||||||||||||||||||||||
| Mean | 459.9 | 439.4 | 452.1 | 526.9 | 452.6 | 514.3 | 458 | 439.3 | 450.8 | 584.8 | 452.8 | 532.4 | 471.9 | 447.9 | 463.6 | 438.2 | 439 | 438.5 | 429.3 | 427.6 | 428.6 | 442.2 | 420.1 | 432.1 |
| SD | 184 | 159.1 | 175.2 | 189.2 | 211.5 | 194.7 | 183.6 | 158.6 | 174.6 | 244.1 | 164.4 | 225.4 | 187.7 | 156.5 | 177.9 | 165.5 | 159.7 | 163.3 | 163.9 | 155.1 | 160 | 170.5 | 167.1 | 169 |
Note: Cell values on the left and right indicate Pearson’s and Spearman’s correlation coefficients, respectively.
Table 5.
Descriptives for MoCA total score at Time 1 and Time 2 by each permutation of diagnostic category for persons 50 years and older
| Time 2 | |||||||||||||||
|---|---|---|---|---|---|---|---|---|---|---|---|---|---|---|---|
| Normal | MCI | Dementia | |||||||||||||
| Time 1 | n | M (SD) | Med | Range | Skew | n | M (SD) | Med | Range | Skew | n | M (SD) | Med | Range | Skew |
| Normal Time 1 Time 2 |
6,096 | 26.24 (2.79) 26.34 (2.84) |
27 27 |
9–30 8–30 |
−1.24 −1.30 |
315 | 23.96 (3.17) 24.76 (3.08) |
24 25 |
14–30 13–30 |
−0.38 −0.90 |
25 | 23.12 (3.96) 23.56 (4.44) |
23 24 |
14–30 12–30 |
−0.48 −0.91 |
| MCI Time 1 Time 2 |
460 | 24.35 (3.22) 23.36 (3.61) |
25 24 |
11–30 7–30 |
−1.04 −0.90 |
1534 | 22.65 (3.28) 22.34 (3.53) |
23 23 |
6–30 8–30 |
−0.57 −0.53 |
55 | 21.05 (3.54) 21.16 (4.40) |
21 21 |
11–28 10–29 |
−0.51 −0.13 |
| Dementia Time 1 Time 2 |
46 | 22.54 (4.33) 20.04 (4.96) |
23 21 |
9–28 7–28 |
−1.09 −0.51 |
368 | 20.49 (3.69) 18.01 (4.56) |
21 19 |
8–28 3–28 |
−0.62 −0.51 |
1786 | 16.01 (5.49) 13.53 (6.39) |
16 14 |
0–30 0–30 |
– 0.27 −0.76 |
Table 6.
Cumulative percentages of frequencies for MoCA scores at Time 1 and Time 2 for the normal cognition group, all ages

|
Table 10.
Cumulative percentages of frequencies for MoCA scores at Time 1 and Time 2 for the dementia group, all ages

|
Table 11.
Tobit regression models predicting MoCA and MoCA-22 total scores by demographic variables among persons <50 years old
| MoCA total score | MoCA-22 score | |||||
|---|---|---|---|---|---|---|
| Est. | Std. Err. | p | Est. | Std. Err. | p | |
| Model 1 | ||||||
| Intercept | 27.56 | 0.73 | *** | 19.87 | 0.64 | *** |
| Age | −0.04 | 0.02 | * | −0.03 | 0.02 | |
| Education (ref: 12 years) | ||||||
| <12 years | −4.38 | 1.48 | ** | −2.77 | 1.30 | * |
| 14 years | 0.91 | 0.52 | 0.76 | 0.46 | ||
| 16 years | 1.56 | 0.42 | *** | 1.30 | 0.37 | *** |
| 18+ | 2.49 | 0.45 | *** | 2.16 | 0.40 | *** |
| Model 2 | ||||||
| Intercept | 27.63 | 0.73 | *** | 19.93 | 0.65 | *** |
| Age | −0.04 | 0.02 | * | −0.03 | 0.12 | |
| Education (ref: 12 years) | ||||||
| <12 years | −4.31 | 1.49 | ** | −2.71 | 1.30 | * |
| 14 years | 0.93 | 0.52 | 0.77 | 0.46 | ||
| 16 years | 1.61 | 0.43 | *** | 1.34 | 0.38 | *** |
| 18+ | 2.51 | 0.46 | *** | 2.02 | 0.40 | *** |
| Sex (ref: female) | −0.18 | 0.29 | −0.17 | 0.26 | ||
| Model 3 | ||||||
| Intercept | 27.12 | 0.70 | *** | 19.57 | 0.63 | *** |
| Age | −0.02 | 0.02 | −0.01 | 0.02 | ||
| Education (ref: 12 years) | ||||||
| <12 years | −2.21 | 1.46 | −1.40 | 1.32 | ||
| 14 years | 0.83 | 0.50 | 0.70 | 0.44 | ||
| 16 years | 1.12 | 0.41 | ** | 1.02 | 0.37 | ** |
| 18+ | 2.02 | 0.44 | *** | 1.87 | 0.40 | *** |
| Race (ref: White) | ||||||
| Black | −3.91 | 0.71 | *** | −2.48 | 0.64 | *** |
| Ethnicity (ref: non-Hispanic) | ||||||
| Hispanic | −0.24 | 0.66 | −0.06 | 0.60 | ||
| Unknown | −0.34 | 2.43 | −0.77 | 2.18 | ||
| Model 4 | ||||||
| Intercept | 27.17 | 0.71 | *** | 19.62 | 0.64 | *** |
| Age | −0.02 | 0.02 | −0.01 | 0.02 | ||
| Education (ref: 12 years) | ||||||
| <12 years | −2.17 | 1.46 | −1.35 | 1.32 | ||
| 14 years | 0.84 | 0.50 | 0.71 | 0.45 | ||
| 16 years | 1.15 | 0.42 | ** | 1.06 | 0.38 | ** |
| 18+ | 2.04 | 0.44 | *** | 1.89 | 0.40 | *** |
| Sex (ref: female) | −0.13 | 0.28 | −0.14 | 0.25 | ||
| Race (ref: White) | ||||||
| Black | −3.90 | 0.71 | *** | −2.47 | 0.64 | *** |
| Ethnicity (ref: non-Hispanic) | ||||||
| Hispanic | −0.23 | 0.66 | −0.04 | 0.60 | ||
| Unknown | −0.39 | 2.43 | −0.83 | 2.18 | ||
* p < .05.
** p < .01.
*** p < .001.
Table 13.
Regression-based norms for non-Hispanic White women and men across ages and education levels
| MoCA | MoCA-22 | ||||||
|---|---|---|---|---|---|---|---|
| ≥2 | ≥9 | ≥25 | ≥2 | ≥9 | ≥25 | ||
| <50 | <12 years | 20/20 | 22/22 | 23/23 | 14/14 | 15/15 | 17/17 |
| High school | 22/22 | 24/24 | 25/25 | 15/15 | 17/17 | 18/18 | |
| Associate’s degree | 23/23 | 25/25 | 26/26 | 16/16 | 18/17 | 19/19 | |
| Bachelor’s degree | 23/23 | 25/25 | 27/27 | 16/16 | 18/18 | 19/19 | |
| Graduate degree | 24/24 | 26/26 | 28/27 | 17/17 | 19/19 | 20/20 | |
| 50–59 | <12 years | 18/17 | 20/19 | 22/21 | 13/12 | 14/14 | 16/15 |
| High school | 22/21 | 23/23 | 25/25 | 15/14 | 17/16 | 18/18 | |
| Associate’s degree | 22/22 | 24/24 | 26/25 | 16/15 | 17/17 | 19/18 | |
| Bachelor’s degree | 23/22 | 25/24 | 27/26 | 16/16 | 18/17 | 20/19 | |
| Graduate degree | 24/23 | 26/25 | 27/27 | 17/16 | 18/18 | 20/19 | |
| 60–69 | <12 years | 18/17 | 19/19 | 21/21 | 12/12 | 14/13 | 15/15 |
| High school | 21/20 | 23/22 | 25/24 | 15/14 | 16/16 | 18/17 | |
| Associate’s degree | 22/21 | 24/23 | 26/25 | 15/15 | 17/16 | 19/18 | |
| Bachelor’s degree | 23/22 | 24/24 | 26/26 | 16/15 | 18/17 | 19/19 | |
| Graduate degree | 23/23 | 25/24 | 27/26 | 16/16 | 18/17 | 20/19 | |
| 70–79 | <12 years | 17/16 | 19/18 | 20/20 | 12/11 | 13/13 | 15/14 |
| High school | 20/20 | 22/22 | 24/23 | 14/14 | 16/15 | 17/17 | |
| Associate’s degree | 21/20 | 23/22 | 25/24 | 15/14 | 17/16 | 18/17 | |
| Bachelor’s degree | 22/21 | 24/23 | 25/25 | 15/15 | 17/16 | 19/18 | |
| Graduate degree | 22/22 | 24/24 | 26/25 | 16/15 | 18/17 | 19/18 | |
| 80–89 | <12 years | 16/15 | 18/17 | 19/19 | 11/10 | 13/12 | 14/13 |
| High school | 19/19 | 21/20 | 23/22 | 13/13 | 15/14 | 17/16 | |
| Associate’s degree | 20/19 | 22/21 | 24/23 | 14/13 | 16/15 | 17/17 | |
| Bachelor’s degree | 21/20 | 23/22 | 24/24 | 15/14 | 16/16 | 18/17 | |
| Graduate degree | 21/21 | 23/23 | 25/24 | 15/14 | 17/16 | 18/18 | |
| 90+ | <12 years | 14/13 | 16/15 | 17/17 | 9/9 | 11/10 | 13/12 |
| High school | 17/16 | 19/18 | 21/20 | 12/11 | 13/13 | 15/14 | |
| Associate’s degree | 18/17 | 20/19 | 22/21 | 12/12 | 14/13 | 16/15 | |
| Bachelor’s degree | 19/18 | 21/20 | 22/22 | 13/12 | 15/14 | 16/16 | |
| Graduate degree | 19/19 | 21/21 | 23/22 | 13/13 | 15/14 | 17/16 | |
Notes: The displayed scores indicate the lowest demographically adjusted score that exceeds the percentile specified at the top of the column. Scores on the left and right within a cell represent the adjusted score for women and men, respectively. Norms were derived from the regression equations presented in Tables 11 and 12.
Table 16.
Regression-based norms for Hispanic Black women and men across ages and education levels
| MoCA | MoCA-22 | ||||||
|---|---|---|---|---|---|---|---|
| ≥2 | ≥9 | ≥25 | ≥2 | ≥9 | ≥25 | ||
| <50 | <12 years | 16/16 | 18/17 | 19/19 | 11/11 | 13/13 | 14/14 |
| High school | 18/18 | 20/20 | 21/21 | 13/13 | 14/14 | 16/16 | |
| Associate’s degree | 19/19 | 21/20 | 22/22 | 13/13 | 15/15 | 16/16 | |
| Bachelor’s degree | 19/19 | 21/21 | 23/22 | 14/14 | 15/15 | 17/17 | |
| Graduate degree | 20/20 | 22/22 | 23/23 | 15/15 | 16/16 | 18/17 | |
| 50–59 | <12 years | 14/14 | 16/16 | 18/17 | 10/9 | 11/11 | 13/12 |
| High school | 18/17 | 20/19 | 21/21 | 12/12 | 14/13 | 15/15 | |
| Associate’s degree | 19/18 | 20/20 | 22/22 | 13/12 | 15/14 | 16/15 | |
| Bachelor’s degree | 19/19 | 21/21 | 23/22 | 14/13 | 15/14 | 17/16 | |
| Graduate degree | 20/19 | 22/21 | 24/23 | 14/13 | 16/15 | 17/16 | |
| 60–69 | <12 years | 14/13 | 16/15 | 17/17 | 9/9 | 11/10 | 13/12 |
| High school | 17/17 | 19/19 | 21/20 | 12/11 | 14/13 | 15/15 | |
| Associate’s degree | 18/17 | 20/19 | 22/21 | 13/12 | 14/14 | 16/15 | |
| Bachelor’s degree | 19/18 | 21/20 | 22/22 | 13/13 | 15/14 | 16/16 | |
| Graduate degree | 19/19 | 21/21 | 23/22 | 14/13 | 15/15 | 17/16 | |
| 70–79 | <12 years | 13/12 | 15/14 | 17/16 | 9/8 | 11/10 | 12/11 |
| High school | 16/16 | 18/18 | 20/19 | 11/11 | 13/12 | 15/14 | |
| Associate’s degree | 17/17 | 19/19 | 21/20 | 12/11 | 14/13 | 15/15 | |
| Bachelor’s degree | 18/17 | 20/19 | 22/21 | 13/12 | 14/14 | 16/15 | |
| Graduate degree | 19/18 | 20/20 | 22/22 | 13/12 | 15/14 | 16/16 | |
| 80–89 | <12 years | 12/11 | 14/13 | 16/15 | 8/7 | 10/9 | 11/11 |
| High school | 15/15 | 17/17 | 19/18 | 11/10 | 12/12 | 14/13 | |
| Associate’s degree | 16/16 | 18/17 | 20/19 | 11/11 | 13/12 | 15/14 | |
| Bachelor’s degree | 17/16 | 19/18 | 21/20 | 12/11 | 14/13 | 15/14 | |
| Graduate degree | 17/17 | 19/19 | 21/21 | 12/12 | 14/13 | 15/15 | |
| 90+ | <12 years | 10/9 | 12/11 | 14/13 | 6/6 | 8/7 | 10/9 |
| High school | 13/13 | 15/15 | 17/16 | 9/8 | 11/10 | 12/12 | |
| Associate’s degree | 14/13 | 16/15 | 18/17 | 10/9 | 11/11 | 13/12 | |
| Bachelor’s degree | 15/14 | 17/16 | 19/18 | 10/9 | 12/11 | 13/13 | |
| Graduate degree | 15/15 | 17/17 | 19/19 | 11/10 | 12/12 | 14/13 | |
Notes: The displayed scores indicate the lowest demographically adjusted score that exceeds the percentile specified at the top of the column. Scores on the left and right within a cell represent the adjusted score for women and men, respectively. Norms were derived from the regression equations presented in Tables 11 and 12.
Table 8.
Cumulative percentages of frequencies for MoCA scores at Time 1 and Time 2 for the MCI group, all ages
|
Table 9.
Cumulative percentages of frequencies for MoCA scores at Time 1 and Time 2 for the MCI group, ages 50 and older
|
RESULTS
Sample
Demographics of the full sample with Time 1 data are presented in Table 1. The average ages across diagnostic groups were in the early 70s, and the sample was predominantly composed of college educated non-Hispanic White individuals. Men and women were nearly equally represented in groups with cognitive disorders, although women comprised nearly two thirds of the normal cognition group. Black individuals comprised the next largest race category, with the other racial groups representing less than 5% of the total sample combined. Individuals identifying as Hispanic represented less than 9% of the total sample.
MoCA Performance
Descriptive statistics for the MoCA’s cognitive domains and items are presented in Table 2. Scores by item and domain were characterized by significant negative skew for the normal cognition group with the most pronounced effect for orientation items. For the MCI group, the degree of negative skew across domains and items was present but was less pronounced. In contrast, the dementia group scores were more normally distributed except for negative skew for the clock contour, naming, and orientation to city and positive skew for clock numbers and delayed recall. For MoCA/MoCA-22 total scores, negative skew was present only in the normal group, with the MCI and dementia groups having normally distributed scores.
Table 2.
Descriptive statistics for MoCA items and domains by degree of impairment
| Variable | Normal (n = 10,165) | MCI (n = 3,973) | Dementia (n = 4,272) | Any impairment (n = 8,245) | ||||||||||||||||
|---|---|---|---|---|---|---|---|---|---|---|---|---|---|---|---|---|---|---|---|---|
| M | SD | Med | Range | Skew | M | SD | Med | Range | Skew | M | SD | Med | Range | Skew | M | SD | Med | Range | Skew | |
| Visuospatial/Executive | 4.16 | 0.96 | 4 | 0–5 | −1.08 | 3.57 | 1.14 | 4 | 0–5 | −0.51 | 2.34 | 1.49 | 2 | 0–5 | 0.27 | 2.93 | 1.47 | 3 | 0–5 | −0.23 |
| Trails | 0.82 | 0.38 | 1 | 0–1 | −1.68 | 0.70 | 0.46 | 1 | 0–1 | −0.86 | 0.39 | 0.49 | 0 | 0–1 | 0.46 | 0.54 | 0.50 | 1 | 0–1 | −0.15 |
| Copy | 0.66 | 0.48 | 1 | 0–1 | −0.66 | 0.49 | 0.50 | 0 | 0–1 | 0.06 | 0.30 | 0.46 | 0 | 0–1 | 0.88 | 0.39 | 0.49 | 0 | 0–1 | 0.46 |
| Clock Total | 2.68 | 0.55 | 3 | 0–3 | −1.61 | 2.39 | 0.69 | 3 | 0–3 | −0.81 | 1.65 | 0.93 | 2 | 0–3 | 0.00 | 2.01 | 0.90 | 2 | 0–3 | −0.46 |
| Contour | 0.99 | 0.11 | 1 | 0–1 | −8.64 | 0.97 | 0.17 | 1 | 0–1 | −5.67 | 0.87 | 0.33 | 1 | 0–1 | −2.25 | 0.92 | 0.27 | 1 | 0–1 | −3.12 |
| Hands | 0.93 | 0.26 | 1 | 0–1 | −3.35 | 0.84 | 0.37 | 1 | 0–1 | −1.84 | 0.51 | 0.50 | 1 | 0–1 | −0.05 | 0.67 | 0.47 | 1 | 0–1 | −0.72 |
| Numbers | 0.77 | 0.42 | 1 | 0–1 | −1.26 | 0.58 | 0.49 | 1 | 0–1 | −0.32 | 0.26 | 0.44 | 0 | 0–1 | 1.08 | 0.42 | 0.49 | 0 | 0–1 | 0.34 |
| Naming | 2.85 | 0.39 | 3 | 0–3 | −2.62 | 2.71 | 0.56 | 3 | 0–3 | −1.94 | 2.30 | 0.92 | 3 | 0–3 | −1.19 | 2.50 | 0.79 | 3 | 0–3 | −1.61 |
| Attention | 5.56 | 0.83 | 6 | 0–6 | −2.44 | 5.13 | 1.14 | 6 | 0–6 | −1.50 | 3.59 | 1.93 | 4 | 0–6 | −0.34 | 4.33 | 1.77 | 5 | 0–6 | −0.92 |
| Digit Span | 1.85 | 0.40 | 2 | 0–2 | −2.60 | 1.76 | 0.49 | 2 | 0–2 | −1.91 | 1.44 | 0.71 | 2 | 0–2 | −0.86 | 1.59 | 0.64 | 2 | 0–2 | −1.29 |
| Letter Tapping | 0.96 | 0.21 | 1 | 0–1 | −4.41 | 0.89 | 0.32 | 1 | 0–1 | −2.46 | 0.60 | 0.49 | 1 | 0–1 | −0.40 | 0.74 | 0.44 | 1 | 0–1 | −1.08 |
| Serial sevens | 2.75 | 0.59 | 3 | 0–3 | −2.72 | 2.49 | 0.82 | 3 | 0–3 | −1.56 | 1.56 | 1.22 | 2 | 0–3 | −0.09 | 2.01 | 1.15 | 2 | 0–3 | −0.71 |
| Language | 2.42 | 0.78 | 3 | 0–3 | −1.21 | 2.01 | 0.93 | 2 | 0–3 | −0.57 | 1.29 | 1.05 | 1 | 0–3 | 0.20 | 1.64 | 1.06 | 2 | 0–3 | −0.19 |
| Repetition | 1.61 | 0.61 | 2 | 0–2 | −1.28 | 1.36 | 0.71 | 2 | 0–2 | −0.65 | 0.91 | 0.80 | 1 | 0–2 | 0.16 | 1.13 | 0.79 | 1 | 0–2 | −0.23 |
| Fluency | 0.81 | 0.39 | 1 | 0–1 | −1.61 | 0.65 | 0.48 | 1 | 0–1 | −0.62 | 0.38 | 0.49 | 0 | 0–1 | 0.50 | 0.51 | 0.50 | 1 | 0–1 | −0.03 |
| Abstraction | 1.72 | 0.55 | 2 | 0–2 | −1.85 | 1.52 | 0.69 | 2 | 0–2 | −1.10 | 1.00 | 0.82 | 1 | 0–2 | 0.00 | 1.25 | 0.80 | 1 | 0–2 | −0.48 |
| Delayed Recall | 3.29 | 1.48 | 4 | 0–5 | −0.68 | 1.63 | 1.60 | 1 | 0–5 | 0.52 | 0.53 | 1.13 | 0 | 0–5 | 2.24 | 1.06 | 1.48 | 0 | 0–5 | 1.16 |
| Orientation | 5.91 | 0.32 | 6 | 0–6 | −4.56 | 5.60 | 0.76 | 6 | 0–6 | −2.54 | 3.66 | 1.93 | 4 | 0–6 | −0.42 | 4.60 | 1.78 | 5 | 0–6 | −1.18 |
| Date | 0.96 | 0.19 | 1 | 0–1 | −4.74 | 0.85 | 0.36 | 1 | 0–1 | −1.93 | 0.41 | 0.49 | 0 | 0–1 | 0.36 | 0.62 | 0.49 | 1 | 0–1 | −0.50 |
| Month | 0.99 | 0.08 | 1 | 0–1 | −12.90 | 0.97 | 0.16 | 1 | 0–1 | −5.90 | 0.67 | 0.47 | 1 | 0–1 | −0.74 | 0.82 | 0.39 | 1 | 0–1 | −1.65 |
| Year | 1.00 | 0.07 | 1 | 0–1 | −14.76 | 0.97 | 0.17 | 1 | 0–1 | −5.59 | 0.64 | 0.48 | 1 | 0–1 | −0.58 | 0.80 | 0.40 | 1 | 0–1 | −1.49 |
| Day | 0.99 | 0.09 | 1 | 0–1 | −10.42 | 0.93 | 0.26 | 1 | 0–1 | −3.37 | 0.57 | 0.49 | 1 | 0–1 | −0.29 | 0.74 | 0.44 | 1 | 0–1 | −1.12 |
| Place | 0.97 | 0.16 | 1 | 0–1 | −6.06 | 0.90 | 0.30 | 1 | 0–1 | −2.71 | 0.54 | 0.50 | 1 | 0–1 | −0.16 | 0.71 | 0.45 | 1 | 0–1 | −0.95 |
| City | 0.99 | 0.08 | 1 | 0–1 | −12.48 | 0.98 | 0.14 | 1 | 0–1 | −6.88 | 0.83 | 0.38 | 1 | 0–1 | −1.73 | 0.90 | 0.30 | 1 | 0–1 | −2.68 |
| Blind Total | 18.90 | 2.44 | 19 | 4–22 | −1.21 | 15.90 | 2.98 | 16 | 3–22 | −0.56 | 10.07 | 4.78 | 10 | 0–22 | −0.18 | 12.88 | 4.96 | 14 | 0–22 | −0.63 |
| Total score | 25.91 | 3.05 | 26 | 5–30 | −1.32 | 22.17 | 3.69 | 23 | 4–30 | −0.69 | 14.71 | 6.26 | 15 | 0–30 | −0.23 | 18.31 | 6.38 | 20 | 0–30 | −0.71 |
Percentages of individuals earning maximum points by domain, item, and total scores are presented in Table 3. In the normal cognition group, the visuospatial copy and delayed recall tasks were the only items/domains with less than two thirds of individuals earning perfect scores. As expected, the percentage of perfect scores by domains and items decreased as the degree of cognitive impairment increased. The notable exceptions were the clock contour and orientation to city, which did not demonstrate an appreciable decline. Relatedly, maximum points were earned on orientation items in both normal cognition and MCI groups for most individuals, but the dementia group scores were much more variable. Despite the strong ceiling effect within domains and individual items, perfect scores on the MoCA were relatively rare with less than 10% of cognitively healthy individuals earning 30/30 points.
Temporal Stability
The temporal stability of the MoCA by domain and total score is presented in Table 4. Data were analyzed based upon diagnostic group at Time 1. Across all age groups, the average length of time between assessments ranged from 420.1 to 584.8 days (1.2–1.6 years) with an average standard deviation of about 6 months. Among cognitively healthy individuals, temporal stability of the domains was poor, particularly with clock drawing total, naming, and orientation. None of the individual domains exceeded a correlation of 0.6 for this group. Naming was particularly unstable among these cognitively normal individuals across ages, although it slightly improved with older age groups until reaching adequate stability among individuals 80 years and older. For cognitively normal individuals younger than 50 years old, the naming, attention, and orientation domains were the least stable (<0.10), with no domain exceeding 0.40 reliability. Whereas the temporal stability of the MoCA total scores was acceptable for this group, the MoCA-22 total score was below acceptable standards. For individuals in the ≥50 years old group, naming and orientation were the least stable, with no other domain exceeding 0.49; however, the MoCA/MoCA-22 total scores were acceptably stable.
Among the cognitively impaired individuals, each of the MoCA domains maintained a temporal stability of at least 0.60 across the lifespan except for language for those younger than 50, naming for ages 80–89, and delayed recall for individuals 90 years and older. Similarly, the group including all participants had temporal stability of 0.60 or above for all domains across the lifespan except for naming for most age groups and language for those aged 90 years and above. Scores were temporally stable for impaired individuals across all age groups with no correlation below 0.84 and 0.81 for the MoCA total and MoCA-22 total scores, respectively.
To further characterize the MoCA performances, supplement the temporal stability analysis, and examine change in diagnostic group over time, we also present a matrix of MoCA scores of individuals 50 years of age and older with data at Time 1 and Time 2 grouped by cognitive diagnosis in Table 5. Most individuals remained in the same diagnostic category across the two time points. For the MCI group, 14.2% were classified as cognitively normal and 16.7% were classified as having dementia at Time 2. For the dementia group, 95.8% retained their cognitive diagnosis while 4.2% were reclassified as either MCI (2.9%) or cognitively normal (1.3%).
Comparisons of demographic variables between individuals with data only at Time 1 (n = 7,493) those with data at both Time 1 and Time 2 (n = 10,917) indicated group differences in age (t = −10.11, df = 15,370, p < .001, 95% CI = [−1.88, −1.27]), education (X2 [4, N = 18,410] = 121.24, p < .001), race (X2 [3, N = 18,410] = 56.3, p < .001), and Hispanic ethnicity (X2 [2, N = 18,410] = 51.58, p < .001), but not sex (X2 [1, N = 18,410] = 0.81, p = .37). Individuals that did not yet have follow up tended to be slightly younger, less educated, non-White, and Hispanic.
Cumulative Change Frequencies
The central aim of the cumulative change tables is to provide clinicians with guidance when interpreting two MoCA scores. This table indicates when a score at Time 2 should raise concern given a particular score at Time 1. Cumulative percentages of frequencies for MoCA scores at Time 1 (y-axis) by Time 2 (x-axis) are displayed in Tables 6–10. The numbers represent a cumulative percent of the sample who, at a given score at Time 1, obtained a particular score or lower at Time 2. For example, among cognitively normal 60-year-olds (see Table 7) scoring 21 at Time 1, 55% of people scored a 23 or below and 45% scored above. While some clinicians may be tempted to describe this as an improvement, the percentile indicates that amount of improvement is well within expectations. We also included dark gray– and light gray–shaded boxes to signify when the likelihood of obtaining a Time 2 score was less than 50% or 10%, respectively, given a person’s baseline score. If the aforementioned individual had instead scored an 18 at Time 2, the clinician would likely be more concerned as that score was observed in less than 10% of the sample scoring a 21 at Time 1.
Table 7.
Cumulative percentages of frequencies for MoCA scores at Time 1 and Time 2 for the normal cognition group, ages 50 and older

|
Regression Estimation
Tobit regression models predicting total scores for the MoCA/MoCA-22 are presented in Tables 11 and 12 for individuals younger than 50 and 50 years and older, respectively. Across all models, more years of education were associated with higher MoCA scores, and age had a negative relationship with MoCA scores that was linear below 50 years of age but demonstrated an accelerating decline above 50 years for both the MoCA and MoCA-22. MoCA-22 scores decelerated at a slightly slower rate indicating that omitting visuospatial/executive and naming items may be a limitation of the test. For models including sex, men had lower predicted scores relative to women. Race and ethnicity were also significantly associated with lower predicted scores on the MoCA and MoCA-22 for all races using non-Hispanic White individuals as the reference group. Demographically adjusted tables derived from the regression equations for all combinations of sex, race, and ethnicity stratified by age group and education level for both MoCA total and MoCA-22 score are presented in Tables 13–16.
Table 12.
Tobit regression models predicting MoCA and MoCA-22 total scores by demographic variables among persons 50 and older
| MoCA Total Score | MoCA-22 Score | |||||
|---|---|---|---|---|---|---|
| Est | Std Err | p | Est | Std Err | p | |
| Model 1 | ||||||
| Intercept | 24.24 | 1.44 | *** | 16.04 | 1.24 | *** |
| Age | 0.08 | 0.04 | * | 0.11 | 0.03 | ** |
| Age^2 | −0.001 | 0.0002 | *** | −0.001 | 0.0002 | *** |
| Education (ref: 12 years) | ||||||
| <12 years | −4.46 | 0.19 | *** | −3.37 | 0.16 | *** |
| 14 years | 0.92 | 0.11 | *** | 0.76 | 0.09 | *** |
| 16 years | 1.96 | 0.09 | *** | 1.47 | 0.08 | *** |
| 18+ | 2.56 | 0.09 | *** | 1.88 | 0.07 | *** |
| Model 2 | ||||||
| Intercept | 24.44 | 1.44 | *** | 16.31 | 1.23 | *** |
| Age | 0.08 | 0.04 | 0.10 | 0.03 | ** | |
| Age^2 | 0.00 | 0.00 | *** | 0.00 | 0.00 | *** |
| Education (ref: 12 years) | ||||||
| <12 years | −4.44 | 0.19 | *** | −3.35 | 0.16 | *** |
| 14 years | 0.93 | 0.11 | *** | 0.77 | 0.09 | *** |
| 16 years | 2.00 | 0.09 | *** | 1.54 | 0.08 | *** |
| 18+ | 2.62 | 0.09 | *** | 1.97 | 0.07 | *** |
| Sex (ref: female) | −0.43 | 0.06 | *** | −0.59 | 0.05 | *** |
| Model 3 | ||||||
| Intercept | 24.19 | 1.37 | *** | 15.99 | 1.20 | *** |
| Age | 0.12 | 0.04 | ** | 0.13 | 0.03 | *** |
| Age^2 | −0.001 | 0.0003 | *** | −0.001 | 0.0002 | *** |
| Education (ref: 12 years) | ||||||
| <12 years | −3.49 | 0.19 | *** | −2.58 | 0.17 | *** |
| 14 years | 0.79 | 0.10 | *** | 0.67 | 0.09 | *** |
| 16 years | 1.51 | 0.09 | *** | 1.16 | 0.08 | *** |
| 18+ | 2.07 | 0.08 | *** | 1.55 | 0.07 | *** |
| Race (ref: White) | ||||||
| Black | −2.11 | 0.08 | *** | −1.41 | 0.07 | *** |
| Am. Indian or Alaska Native | −1.90 | 0.30 | *** | −1.68 | 0.26 | *** |
| Native Hawaiian or Pac. Islander | −1.37 | 0.78 | −0.71 | 0.68 | ||
| Asian | −1.23 | 0.16 | *** | −1.05 | 0.14 | *** |
| Other | −1.66 | 0.31 | *** | −1.30 | 0.27 | *** |
| Unknown | −0.84 | 0.35 | * | −0.76 | 0.31 | * |
| Ethnicity (ref: non-Hispanic) | ||||||
| Hispanic | −1.61 | 0.12 | *** | −1.26 | 0.11 | *** |
| Unknown | 0.20 | 0.41 | 0.13 | 0.36 | ||
| Model 4 | ||||||
| Intercept | 24.48 | 1.36 | *** | 16.32 | 1.19 | *** |
| Age | 0.11 | 0.04 | ** | 0.13 | 0.03 | *** |
| Age^2 | −0.001 | 0.0003 | *** | −0.001 | 0.002 | *** |
| Education (ref: 12 years) | ||||||
| <12 years | −3.45 | 0.19 | *** | −2.54 | 0.16 | *** |
| 14 years | 0.80 | 0.10 | *** | 0.67 | 0.09 | *** |
| 16 years | 1.55 | 0.09 | *** | 1.22 | 0.08 | *** |
| 18+ | 2.15 | 0.08 | *** | 1.64 | 0.07 | *** |
| Sex (ref: female) | −0.60 | 0.06 | *** | −0.71 | 0.05 | *** |
| Race (ref: White) | ||||||
| Black | −2.19 | 0.08 | *** | −1.50 | 0.07 | *** |
| Am. Indian or Alaska Native | −1.44 | 0.13 | *** | −1.75 | 0.26 | *** |
| Native Hawaiian or Pac. Islander | −0.13 | 0.77 | −0.66 | 0.67 | ||
| Asian | −1.25 | 0.16 | *** | −1.07 | 0.14 | *** |
| Other | −1.67 | 0.31 | *** | −1.32 | 0.27 | *** |
| Unknown | −0.82 | 0.35 | * | −0.74 | 0.30 | * |
| Ethnicity (ref: non-Hispanic) | ||||||
| Hispanic | −1.63 | 0.12 | *** | −1.29 | 0.10 | *** |
| Unknown | 0.18 | 0.41 | 0.10 | 0.36 | ||
* p < .05.
** p < .01.
*** p < .001.
Table 14.
Regression-based norms for Hispanic White women and men across ages and education levels
| MoCA | MoCA-22 | ||||||
|---|---|---|---|---|---|---|---|
| ≥2 | ≥9 | ≥25 | ≥2 | ≥9 | ≥25 | ||
| <50 | <12 years | 20/20 | 22/21 | 23/23 | 14/14 | 15/15 | 17/17 |
| High school | 22/22 | 24/24 | 25/25 | 15/15 | 17/17 | 18/18 | |
| Associate’s degree | 23/23 | 25/24 | 26/26 | 16/16 | 17/17 | 19/19 | |
| Bachelor’s degree | 23/23 | 25/25 | 26/26 | 16/16 | 18/18 | 19/19 | |
| Graduate degree | 24/24 | 26/26 | 27/27 | 17/17 | 19/18 | 20/20 | |
| 50–59 | <12 years | 16/16 | 18/18 | 20/20 | 11/11 | 13/12 | 14/14 |
| High school | 20/19 | 22/21 | 24/23 | 14/13 | 15/15 | 17/17 | |
| Associate’s degree | 21/20 | 23/22 | 24/24 | 14/14 | 16/15 | 18/17 | |
| Bachelor’s degree | 21/21 | 23/23 | 25/25 | 15/14 | 17/16 | 18/18 | |
| Graduate degree | 22/21 | 24/23 | 26/25 | 15/15 | 17/16 | 19/18 | |
| 60–69 | <12 years | 16/15 | 18/17 | 20/19 | 11/10 | 13/12 | 14/13 |
| High school | 19/19 | 21/21 | 23/22 | 14/13 | 15/14 | 17/16 | |
| Associate’s degree | 20/20 | 22/21 | 24/23 | 14/13 | 16/15 | 17/17 | |
| Bachelor’s degree | 21/20 | 23/22 | 25/24 | 15/14 | 16/16 | 18/17 | |
| Graduate degree | 22/21 | 23/23 | 25/25 | 15/14 | 17/16 | 18/18 | |
| 70–79 | <12 years | 15/15 | 17/16 | 19/18 | 10/10 | 12/11 | 14/13 |
| High school | 19/18 | 21/20 | 22/22 | 13/12 | 15/14 | 16/15 | |
| Associate’s degree | 19/19 | 21/21 | 23/22 | 14/13 | 15/15 | 17/16 | |
| Bachelor’s degree | 20/20 | 22/21 | 24/23 | 14/13 | 16/15 | 17/17 | |
| Graduate degree | 21/20 | 23/22 | 24/24 | 15/14 | 16/16 | 18/17 | |
| 80–89 | <12 years | 14/13 | 16/15 | 18/17 | 10/9 | 11/11 | 13/12 |
| High school | 18/17 | 19/19 | 21/21 | 12/11 | 14/13 | 15/15 | |
| Associate’s degree | 18/18 | 20/20 | 22/21 | 13/12 | 14/14 | 16/15 | |
| Bachelor’s degree | 19/18 | 21/20 | 23/22 | 13/13 | 15/14 | 17/16 | |
| Graduate degree | 20/19 | 22/21 | 23/23 | 14/13 | 15/15 | 17/16 | |
| 90+ | <12 years | 12/11 | 14/13 | 16/15 | 8/7 | 10/9 | 11/11 |
| High school | 15/15 | 17/17 | 19/19 | 10/10 | 12/11 | 14/13 | |
| Associate’s degree | 16/16 | 18/18 | 20/19 | 11/10 | 13/12 | 14/14 | |
| Bachelor’s degree | 17/16 | 19/18 | 21/20 | 12/11 | 13/13 | 15/14 | |
| Graduate degree | 18/17 | 20/19 | 21 /21 | 12/11 | 14/13 | 15/15 | |
Notes: The displayed scores indicate the lowest demographically adjusted score that exceeds the percentile specified at the top of the column. Scores on the left and right within a cell represent the adjusted score for women and men, respectively. Norms were derived from the regression equations presented in Tables 11 and 12.
Table 15.
Regression-based norms for non-Hispanic Black women and men across ages and education levels
| MoCA | MoCA-22 | ||||||
|---|---|---|---|---|---|---|---|
| ≥2 | ≥9 | ≥25 | ≥2 | ≥9 | ≥25 | ||
| <50 | <12 years | 16/16 | 18/18 | 19/19 | 11/11 | 13/13 | 14/14 |
| High school | 18/18 | 20/20 | 22/21 | 13/13 | 14/14 | 16/16 | |
| Associate’s degree | 19/19 | 21/21 | 22/22 | 14/13 | 15/15 | 16/16 | |
| Bachelor’s degree | 19/19 | 21/21 | 23/23 | 14/14 | 15/15 | 17/17 | |
| Graduate degree | 20/20 | 22/22 | 24/24 | 15/15 | 16/16 | 18/17 | |
| 50–59 | <12 years | 16/15 | 18/17 | 20/19 | 11/10 | 13/12 | 14/14 |
| High school | 19/19 | 21/21 | 23/22 | 14/13 | 15/15 | 17/16 | |
| Associate’s degree | 20/20 | 22/21 | 24/23 | 14/14 | 16/15 | 17/17 | |
| Bachelor’s degree | 21/20 | 23/22 | 25/24 | 15/14 | 16/16 | 18/17 | |
| Graduate degree | 22/21 | 23/23 | 25/25 | 15/15 | 17/16 | 18/18 | |
| 60–69 | <12 years | 15/15 | 17/17 | 19/18 | 11/10 | 12/12 | 14/13 |
| High school | 19/18 | 21/20 | 23/22 | 13/13 | 15/14 | 17/16 | |
| Associate’s degree | 20/19 | 22/21 | 23/23 | 14/13 | 16/15 | 17/16 | |
| Bachelor’s degree | 20/20 | 22/22 | 24/23 | 15/14 | 16/15 | 18/17 | |
| Graduate degree | 21/20 | 23/22 | 25/24 | 15/14 | 17/16 | 18/17 | |
| 70–79 | <12 years | 15/14 | 16/16 | 18/18 | 10/10 | 12/11 | 13/13 |
| High school | 18/17 | 20/19 | 22/21 | 13/12 | 14/14 | 16/15 | |
| Associate’s degree | 19/18 | 21/20 | 23/22 | 13/13 | 15/14 | 17/16 | |
| Bachelor’s degree | 20/19 | 21/21 | 23/23 | 14/13 | 16/15 | 17/16 | |
| Graduate degree | 20/20 | 22/21 | 24/23 | 14/14 | 16/15 | 18/17 | |
| 80–89 | <12 years | 14/13 | 15/15 | 17/17 | 9/9 | 11/10 | 13/12 |
| High school | 17/16 | 19/18 | 21/20 | 12/11 | 14/13 | 15/14 | |
| Associate’s degree | 18/17 | 20/19 | 21/21 | 13/12 | 14/14 | 16/15 | |
| Bachelor’s degree | 19/18 | 20/20 | 22/22 | 13/12 | 15/14 | 16/16 | |
| Graduate degree | 19/19 | 21/20 | 23/22 | 14/13 | 15/15 | 17/16 | |
| 90+ | <12 years | 11/11 | 13/13 | 15/15 | 8/7 | 9/9 | 11/10 |
| High school | 15/14 | 17/16 | 19/18 | 10/10 | 12/11 | 14/13 | |
| Associate’s degree | 16/15 | 18/17 | 19/19 | 11/10 | 13/12 | 14/14 | |
| Bachelor’s degree | 16/16 | 18/18 | 20/20 | 11/11 | 13/12 | 15/14 | |
| Graduate degree | 17/16 | 19/18 | 21/20 | 12/11 | 14/13 | 15/14 | |
Notes: The displayed scores indicate the lowest demographically adjusted score that exceeds the percentile specified at the top of the column. Scores on the left and right within a cell represent the adjusted score for women and men, respectively. Norms were derived from the regression equations presented in Tables 11 and 12.
DISCUSSION
In this study, we present demographically adjusted normative information for the MoCA/MoCA-22 and offer multiple methods for interpreting changes in scores over approximately 1 year in clinical and non-clinical groups. All approaches provide robust methods for adjusting for demographic performance effects.
Regression models confirmed lower scores from individuals who were older, male, had fewer years of formal education, and identified as racial/ethnic minorities. The same general pattern was observed when applied to the MoCA-22. In this sample, there was a clear quadratic effect on MoCA score observed for age after 50 years old such that initial scores showed an accelerating pattern of decline over time. This trajectory is consistent with findings on general cognitive ability in adults across the age spectrum (Craik&Bialystok, 2006; Gluhm,et al., 2013). Although the MoCA recommends awarding a “bonus point” if an individual’s level of education is less than 12 years, this adjustment comes with only a slight increase in specificity at a cost of a detrimental effect on sensitivity (Gagnon,et al., 2013). Our results provide a more refined correction that encompasses a larger continuum of educational attainment and more accurately quantifies the effects of education on cognitive test performance. Regarding score differences among genders and racial and ethnic groups, there is a large body of research that highlights the cultural, socioeconomic, and other variables that correlate with race and influence test performances (Fujii, 2017). These data assist clinicians in placing MoCA scores in proper demographic context as the goal in evaluations is often to determine cognitive decline, especially when establishing diagnoses according to the most frequently used classification schemas (Albert,et al., 2011; APA, 2022; Petersen&Negash, 2008).
The test–retest coefficients of the MoCA/MoCA-22 coefficients tended to be poorest for the cognitively healthy sample and much higher for the full sample and each clinical group. Poor temporal stability seen in the cognitively healthy samples is likely related to a high degree of negative skew and low performance variability. Additionally, poor temporal stability was the most apparent in persons younger than 50 years old highlighting the need to exercise caution when interpreting change in scores across time in this group. Therefore, the MoCA is not psychometrically adequate for describing variations in normal cognition across time and is better suited to describe the cognition of people with pathology. Poor temporal stability was most apparent when examining individual items or cognitive domains.
The MoCA is typically interpreted according to the total score; however, some evaluators interpret scores by domain or even by item in an attempt to characterize cognitive strengths and weaknesses. This approach to interpretation is only appropriate if the test is sufficiently reliable and if the items and domains are sufficiently correlated with clinical outcomes. Although this study does not address the predictive validity of domains or items, the poor reliability underscores the limitations of the MoCA at the more granular level. With the clinical groups, the test–retest correlations were modest and do not provide as precise a measure as is standard in neuropsychological assessments (Calamia,et al., 2013), although they may be useful in generating tentative clinical hypotheses. For cognitively healthy samples, the total MoCA score is adequate, but the domains are too temporally unstable and should not be used to describe components of cognition. In fact, none of the test–retest reliability coefficients for the normal cognition groups reached minimally acceptable standards (e.g., 0.70; Slick, 2006) at the domain level at any age. The strong ceiling effects of the MoCA are likely attenuating the reliability of this group, suggesting that global cognition is difficult to reliably assess in individuals who are cognitively normal. For individuals with clinical disorders, total scores have good temporal stability with domain scores generally in the 0.6’s, which also fall short of aforementioned reliability standards. We emphasize that the inadequate reliability of the MoCA domains should serve as a deterrent for clinicians that may be tempted to interpret results at this level.
The MoCA is not only used for triage and cognitive screening but also commonly used to track changes over time. Until now, there was little statistical guidance to assist evaluators in determining when scores are significantly different at subsequent screenings. Consequently, decisions regarding meaningful change were largely subjective; however, this informal approach introduces an unknown degree of error. Conceptually, RCIs acknowledge scores change over time because of genuine differences in the measured construct and changes due to measurement error. Subsequent RCI approaches have incorporated additional systematic influences on performance change, including test–retest practice effects, regression to the mean, and other statistical phenomena. Applying more sophisticated RCI metrics to the MoCA is challenging as these data are truncated for higher functioning individuals and are characterized by significant negative skew and invariance of some items. Indeed, regression to the mean is apparent in the data when reviewing changes in mean scores across two administrations as shown in Table 7. Regression to the mean strongly influences the observed scores at Time 2. For example, cognitively normal individuals aged 50 and older who score less than 27 tend to obtain a higher score at their subsequent evaluation, whereas those scoring 27 or above tend to have lower scores on their second administration.
Consider a 60-year-old cognitively normal patient who obtains a score of 21 on the first administration of the MoCA and returns for re-screening. Before re-administering the MoCA, the clinician reviews Table 7 and learns that 71% of similar individuals with scores of 21 at Time 1 score the same or better at Time 2, with a mean score of 22.9; however, this individual is re-screened and earns a score of 18. This degree of change is observed in only 8% of the group which may warrant additional evaluation, whereas a change in the other direction of the same magnitude is much less remarkable and insufficient evidence of “improvement.” A complementary way of examining the same performances would be to regard a raw improvement of three scores to exceed Time 2 expectations by 1.1 points, whereas a raw decline of 3 points more accurately indicates scoring 4.9 points below expectation. Our approach capitalizes on the large sample that permits using raw data descriptively, as the systematic influences are inherent, and thus provides information on the likelihood for an obtained change in score at a subsequent evaluation to make statistically sound and data-driven judgments.
There are several limitations of the present study. First, the sample composition consisted of English speakers from the United States, treatment-seeking volunteers (which may tend to be highly educated, altruistic, and curious), and disproportionately fewer members of minority racial and ethnic groups, all of which may limit generalizability of the findings. Rentería,et al.(2023) observed that NACC participants are not representative of the U.S. population across age, education, and race/ethnicity. In fact, they noted that NACC participants were older and more educated across racial/ethnic groups, suggestive of a selection bias. This speaks to the larger problem that even with a sample size of this magnitude, the individuals receiving these services are highly educated and White. Individuals from minoritized ethnocultural backgrounds are not appropriately represented in clinical research (Brewster,et al., 2019; Kawas,et al., 2021; Mindt,et al., 2023). Although we attempt to mitigate this limitation with the option of removing race/ethnicity as a variable in our regression model, the ongoing issue of misrepresentation of non-White individuals in clinical research persists.
Second, some degree of classification bias is inherent in the data as individuals classifying participants had access to their MoCA performances. The impact of this would be some degree of homogenization within each of the diagnostic groups. For example, the cognitively normal group would have a restricted range of scores tending toward high scores whereas the diagnostic groups would tend to have mostly lower scores. It is reassuring, however, that these individuals also had access to the patients’ performances on a battery of neuropsychological tests that were likely given more weight than the cognitive screener when assigning cognitive diagnoses. Third, these data reveal a potential limitation of the test, that is, item invariance. Specifically, four of six orientation items were responded to with over 99% accuracy by cognitively healthy people. More concerning, the clock contour tended to have a high score across all participants. This item was correct by 99% of cognitively healthy participants and 92% of those with clinical diagnoses; therefore, this item is unlikely to be useful in differentiating between groups or quantifying change in cognitive functioning over time.
The MoCA is reliable in the total score across all diagnostic groups, but less so by domains and even less so by items. We recommended regression-based formulas rather than group means for interpreting individual scores since regression is a more robust method to adjust for demographic performance differences. We also leveraged a large data set to provide a method of determining when the amount of observed change in MoCA performance is uncommon across multiple administrations.
Funding
No funding was received for this study.
Conflict of Interest
The authors do not have any conflicts of interest to disclose. This work was authored as part of the contributor’s official duties as an Employee of the United States Government and is therefore a work of the United States Government. In accordance with 17U. S. C 105, no copyright protection is available for such works under U.S. Law.
Acknowledgements
The NACC database is funded by NIA/NIH Grant U24 AG072122. NACC data are contributed by the NIA-funded ADCs: P50 AG005131 (PI James Brewer, MD, PhD), P50 AG005133 (PI Oscar Lopez, MD), P50 AG005134 (PI Bradley Hyman, MD, PhD), P50 AG005136 (PI Thomas Grabowski, MD), P50 AG005138 (PI Mary Sano, PhD), P50 AG005142 (PI Helena Chui, MD), P50 AG005146 (PI Marilyn Albert, PhD), P50 AG005681 (PI John Morris, MD), P30 AG008017 (PI Jeffrey Kaye, MD), P30 AG008051 (PI Thomas Wisniewski, MD), P50 AG008702 (PI Scott Small, MD), P30 AG010124 (PI John Trojanowski, MD, PhD), P30 AG010129 (PI Charles DeCarli, MD), P30 AG010133 (PI Andrew Saykin, PsyD), P30 AG010161 (PI David Bennett, MD), P30 AG012300 (PI Roger Rosenberg, MD), P30 AG013846 (PI Neil Kowall, MD), P30 AG013854 (PI Robert Vassar, PhD), P50 AG016573 (PI Frank LaFerla, PhD), P50 AG016574 (PI Ronald Petersen, MD, PhD), P30 AG019610 (PI Eric Reiman, MD), P50 AG023501 (PI Bruce Miller, MD), P50 AG025688 (PI Allan Levey, MD, PhD), P30 AG028383 (PI Linda Van Eldik, PhD), P50 AG033514 (PI Sanjay Asthana, MD, FRCP), P30 AG035982 (PI Russell Swerdlow, MD), P50 AG047266 (PI Todd Golde, MD, PhD), P50 AG047270 (PI Stephen Strittmatter, MD, PhD), P50 AG047366 (PI Victor Henderson, MD, MS), P30 AG049638 (PI Suzanne Craft, PhD), P30 AG053760 (PI Henry Paulson, MD, PhD), P30 AG066546 (PI Sudha Seshadri, MD), P20 AG068024 (PI Erik Roberson, MD, PhD), P20 AG068053 (PI Marwan Sabbagh, MD), P20 AG068077 (PI Gary Rosenberg, MD), P20 AG068082 (PI Angela Jefferson, PhD), P30 AG072958 (PI Heather Whitson, MD), P30 AG072959 (PI James Leverenz, MD).
Contributor Information
Lauren N Ratcliffe, Mental Health Service, VA Ann Arbor Healthcare System, Ann Arbor, MI, USA; Department of Psychiatry, Neuropsychology Section, Michigan Medicine, Ann Arbor, MI, USA; Department of Clinical Psychology, Mercer University College of Health Professions, Atlanta, GA, USA.
Andrew C Hale, Mental Health Service, VA Ann Arbor Healthcare System, Ann Arbor, MI, USA; Department of Psychiatry, Neuropsychology Section, Michigan Medicine, Ann Arbor, MI, USA.
Taylor McDonald, Department of Clinical Psychology, Mercer University College of Health Professions, Atlanta, GA, USA.
Kelsey C Hewitt, Department of Neurology, Emory University School of Medicine, Atlanta, GA, USA.
Christopher M Nguyen, Department of Psychiatry and Behavioral Health, Ohio State University Wexner Medical Center, Columbus, OH, USA.
Robert J Spencer, Mental Health Service, VA Ann Arbor Healthcare System, Ann Arbor, MI, USA; Department of Psychiatry, Neuropsychology Section, Michigan Medicine, Ann Arbor, MI, USA.
David W Loring, Department of Neurology, Emory University School of Medicine, Atlanta, GA, USA; Department of Pediatrics, Emory University School of Medicine, Atlanta, GA, USA.
References
- Albert, M. S., DeKosky, S. T., Dickson, D., Dubois, B., Feldman, H. H., Fox, N. C., et al. (2011). The diagnosis of mild cognitive impairment due to Alzheimer’s disease: Recommendations from the National Institute on Aging-Alzheimer’s association workgroups on diagnostic guidelines for Alzheimer’s disease. Alzheimer’s & Dementia, 7(3), 270–279. 10.1016/j.jalz.2011.03.008. [DOI] [PMC free article] [PubMed] [Google Scholar]
- American Psychiatric Association (2022). Diagnostic and statistical manual of mental disorders, fifth edition text revision (DSM-5-TR). Washington, DC: American Psychiatric Association. [Google Scholar]
- Army Individual Test Battery (1944). Manual of directions and scoring. Washington, DC: War Department, Adjutant Generals’ Office. [Google Scholar]
- Benge, J. F., & Kiselica, A. M. (2021). Rapid communication: Preliminary validation of a telephone adapted Montreal cognitive assessment for the identification of mild cognitive impairment in Parkinson’s disease. The Clinical Neuropsychologist, 35(1), 133–147. 10.1080/13854046.2020.1801848. [DOI] [PubMed] [Google Scholar]
- Bernstein, I., Lacritz, L., Barlow, C., Weiner, M., & DeFina, L. (2011). Psychometric evaluation of the Montreal cognitive assessment (MoCA) in three diverse samples. The Clinical Neuropsychologist, 25(1), 119–126. 10.1080/13854046.2010.533196. [DOI] [PubMed] [Google Scholar]
- Brewster, P., Barnes, L., Haan, M., Johnson, J., Manly, J., Nápoles, A., et al. (2019). Progress and future challenges in aging and diversity research in the United States. Alzheimer's & Dementia, 15(7), 995–1003. 10.1016/j.jalz.2018.07.221. [DOI] [PMC free article] [PubMed] [Google Scholar]
- Burke, S., Grudzien, A., Burgess, A., Rodriguez, M., Rivera, Y., & Loewenstein, D. (2021). The utility of cognitive screeners in the detection of dementia spectrum disorders in Spanish-speaking populations. Journal of Geriatric Psychiatry and Neurology, 34(2), 102–118. 10.1177/0891988720915513. [DOI] [PMC free article] [PubMed] [Google Scholar]
- Calamia, M., Markon, K., & Tranel, D. (2013). The robust reliability of neuropsychological measures: Meta-analyses of test-retest correlations. The Clinical Neuropsychologist, 27(7), 1077–1105. 10.1080/13854046.2013.809795. [DOI] [PubMed] [Google Scholar]
- Carson, N., Leach, L., & Murphy, K. (2018). A re-examination of Montreal cognitive assessment (MoCA) cutoff scores. International Journal of Geriatric Psychiatry, 33(2), 379–388. 10.1002/gps.4756. [DOI] [PubMed] [Google Scholar]
- Cooley, S., Heaps, J., Bozenius, J., Salminen, L., Baker, L., Scott, S., et al. (2015). Longitudinal change in performance on the Montreal cognitive assessment in older adults. Clinical Neuropsychology, 29(6), 824–835. 10.1080/13854046.2015.1087596. [DOI] [PMC free article] [PubMed] [Google Scholar]
- Craft, S., Newcomer, J., Kanne, S., Dagogo-Jack, S., Cryer, P., Sheline, Y., et al. (1996). Memory improvement following induced hyperinsulinemia in Alzheimer’s disease. Neurobiology of Aging, 17(1), 123–130. 10.1016/0197-4580(95)02002-0. [DOI] [PubMed] [Google Scholar]
- Craik, F. I. M., & Bialystok, E. (2006). Cognition through the lifespan: Mechanisms of change. Trends in Cognitive Sciences, 10(3), 131–138. 10.1016/j.tics.2006.01.007. [DOI] [PubMed] [Google Scholar]
- Dautzenberg, G., Lijmer, J., & Beekman, A. (2020). Diagnostic accuracy of the Montreal cognitive assessment (MoCA) for cognitive screening in old age psychiatry: Determining cutoff scores in clinical practice. Avoiding spectrum bias caused by healthy controls. International Journal of Geriatric Psychiatry, 35(3), 261–269. 10.1002/gps.5227. [DOI] [PMC free article] [PubMed] [Google Scholar]
- Folstein, M. F., Folstein, S. E., & Fanjiang, G.. (2002). Mini-mental state examination: clinical guide. Psychological Assessment Resources. [Google Scholar]
- Folstein, M. F., Folstein, S. E., & McHugh, P. R. (1975). "Mini-mental state". A practical method for grading the cognitive state of patients for the clinician. Journal of Psychiatric Research, 12(3), 189–198. 10.1016/0022-3956(75)90026-6. [DOI] [PubMed] [Google Scholar]
- Fujii, D. (2017). Conducting a culturally informed neuropsychological evaluation. American Psychological Association. http://www.jstor.org/stable/j.ctv1chs1dz. 10.1037/15958-000. [DOI] [Google Scholar]
- Gagnon, G., Hansen, K. T., Woolmore-Goodwin, S., Gutmanis, I., Wells, J., Borrie, M., et al. (2013). Correcting the MoCA for education: Effect on sensitivity. Canadian Journal of Neurological Sciences, 40(5), 678–683. 10.1017/S0317167100014918. [DOI] [PubMed] [Google Scholar]
- Gluhm, S., Goldstein, J., Loc, K., Colt, A., Van Liew, C., & Corey-Bloom, J. (2013). Cognitive performance on the mini-mental state examination and the Montreal cognitive assessment across the healthy adult lifespan. Cognitive and Behavioral Neurology: Official Journal of the Society for Behavioral and Cognitive Neurology, 26(1), 1–5. 10.1097/WNN.0b013e31828b7d26. [DOI] [PMC free article] [PubMed] [Google Scholar]
- Gollan, T., Wessberger, G., Runnqvist, E., Montoya, R., & Cera, M. (2012). Self-ratings of spoken language dominance: A multilingual naming test (MINT) and preliminary norms for young and aging Spanish-English bilinguals. Bilingualism: Language and Cognition, 15(3), 594–615. 10.1017/S1366728911000332. [DOI] [PMC free article] [PubMed] [Google Scholar]
- Guilmette, T. J., Sweet, J. J., Hebben, N., Koltai, D., Mahone, E. M., Spiegler, B. J., et al. (2020). American Academy of clinical neuropsychology consensus conference statement on uniform labeling of performance test scores. The Clinical Neuropsychologist, 34(3), 437–453. 10.1080/13854046.2020.1722244. [DOI] [PubMed] [Google Scholar]
- Hinton-Bayre, A. D., & Kwapil, K. J. (2017). Best practice approaches for evaluating significant change for individuals. In Bowden, S. C. (Ed.), Neuropsychological assessment in the age of evidence-based practice, (pp. 121–154). New York: Oxford University Press. [Google Scholar]
- Hoops, S., Nazem, S., Siderowf, A. D., Duda, J. E., Xie, S. X., Stern, M. B., et al. (2009). Validity of the MoCA and MMSE in the detection of MCI and dementia in Parkinson disease. Neurology, 73(21), 1738–1745. 10.1212/WNL.0b013e3181c34b47. [DOI] [PMC free article] [PubMed] [Google Scholar]
- Jeffers, S. L. (2019). Refining Brief Assessment Tools for Mild Cognitive Impairment: Increasing Accuracy on the Montreal Cognitive Assessment for United States Populations (Order No. 22619107). (2307191291). https://www.proquest.com/dissertations-theses/refining-brief-assessment-tools-mild-cognitive/docview/2307191291/se-2. [Google Scholar]
- Katz, M. J., Wang, C., Nester, C. O., Derby, C. A., Zimmerman, M. E., Lipton, R. B., et al. (2021). T-MoCA: A valid phone screen for cognitive impairment in diverse community samples. Alzheimer’s & Dementia: Diagnosis, Assessment & Disease Monitoring, 13(1), e12144. 10.1002/dad2.12144. [DOI] [PMC free article] [PubMed] [Google Scholar]
- Kawas, C., Corrada, M., & Whitmer, R. (2021). Diversity and disparities in dementia diagnosis and care: A challenge for all of us. JAMA Neurology, 78(6), 650–652. 10.1001/jamaneurol.2021.0285. [DOI] [PubMed] [Google Scholar]
- Kiselica, A. M., Kaser, A. N., Webber, T. A., Small, B. J., & Benge, J. F. (2020). Development and preliminary validation of standardized regression-based change scores as measures of transitional cognitive decline. Archives of Clinical Neuropsychology, 35(7), 1168–1181. 10.1093/arclin/acaa042. [DOI] [PMC free article] [PubMed] [Google Scholar] [Retracted]
- Kopecek, M., Bezdicek, O., Sulc, Z., Lukavsky, J., & Stepankova, H. (2016). Montreal cognitive assessment and mini-mental status examination reliable change indices in healthy older adults. International Journal of Geriatric Psychiatry, 32(8), 868–875. 10.1002/gps.4539. [DOI] [PubMed] [Google Scholar]
- Krishnan, K., Rossetti, H., Hynan, L. S., Carter, K., Falkowski, J., Lacritz, L., et al. (2017). Changes in Montreal cognitive assessment scores over time. Assessment, 24(6), 772–777. 10.1177/1073191116654217. [DOI] [PMC free article] [PubMed] [Google Scholar]
- Luis, C., Keegan, A., & Mullan, M. (2009). Cross validation of the Montreal cognitive assessment in community dwelling older adults residing in the southeastern US. International Journal of Geriatric Psychiatry, 24(2), 197–201. 10.1002/gps.2101. [DOI] [PubMed] [Google Scholar]
- Malek-Ahmadi, M., Powell, J., Belden, C., O'Connor, K., Evans, L., Coon, D., et al. (2015). Age- and education-adjusted normative data for the Montreal cognitive assessment (MoCA) in older adults age 70-99. Aging, Neuropsychology, and Cognition, 22(6), 755–761. 10.1080/13825585.2015.1041449. [DOI] [PubMed] [Google Scholar]
- McPherson, S., & Koltai, D. (2018). A practical guide to geriatric neuropsychology. New York: Oxford University Press. [Google Scholar]
- Milani, S., Marsiske, M., Cottler, L., Chen, X., & Striley, C. (2018). Optimal cutoffs for the Montreal cognitive assessment vary by race and ethnicity. Alzheimer's & Dementia, 10(1), 773–781. 10.1016/j.dadm.2018.09.003. [DOI] [PMC free article] [PubMed] [Google Scholar]
- Mindt, M. R., Okonkwo, O., Weiner, M. W., Veitch, D. P., Aisen, P., Ashford, M., et al. (2023). Improving generalizability and study design of Alzheimer's disease cohort studies in the United States by including under-represented populations. Alzheimer's & Dementia, 19(4), 1549–1557. 10.1002/alz.12823. [DOI] [PMC free article] [PubMed] [Google Scholar]
- Nasreddine, Z., Phillips, N., Bédirian, V., Charbonneau, S., Whitehead, V., Collin, I., et al. (2005). The Montreal cognitive assessment, MoCA: A brief screening tool for mild cognitive impairment. Journal of the American Geriatrics Society, 53(4), 695–699. 10.1111/j.1532-5415.2005.53221.x. [DOI] [PubMed] [Google Scholar]
- Oudman, E., Postma, A., Van der Stigchel, S., Appelhof, B., Wijnia, J. W., & Nijboer, T. C. W. (2014). The Montreal cognitive assessment (MoCA) is superior to the mini mental state examination (MMSE) in detection of Korsakoff’s syndrome. The Clinical Neuropsychologist, 28(7), 1123–1132. 10.1080/13854046.2014.960005. [DOI] [PubMed] [Google Scholar]
- Petersen, R., & Negash, S. (2008). Mild cognitive impairment: An overview. CNS Spectrums, 13(1), 45–53. 10.1017/S1092852900016151. [DOI] [PubMed] [Google Scholar]
- Petersen, R. C., Smith, G. E., Waring, S. C., Ivnik, R. J., Tangalos, E. G., & Kokmen, E. (1999). Mild cognitive impairment: Clinical characterization and outcome. Archives of Neurology, 56(3), 303–308. 10.1001/archneur.56.3.303. [DOI] [PubMed] [Google Scholar]
- Pinto, T. C., Machado, L., Bulgacov, T. M., Rodrigues-Júnior, A. L., Costa, M. L., Ximenes, R. C., & Sougey, E. B. (2019). Is the Montreal Cognitive Assessment (MoCA) screening superior to the Mini-Mental State Examination (MMSE) in the detection of mild cognitive impairment (MCI) and Alzheimer’s Disease (AD) in the elderly? International Psychogeriatrics, 31(4), 491–504. [DOI] [PubMed] [Google Scholar]
- Possin, K., Laluz, V., Alcantar, O., Miller, B., & Kramer, J. (2011). Distinct neuroanatomical substrates and cognitive mechanisms of figure copy performance in Alzheimer’s disease and behavioral variant frontotemporal dementia. Neuropsychologia, 49(1), 43–48. 10.1016/j.neuropsychologia.2010.10.026. [DOI] [PMC free article] [PubMed] [Google Scholar]
- Rabin, L., Paolillo, E., & Barr, W. (2016). Stability in test-usage practices of clinical neuropsychologists in the United States and Canada over a 10-year period: A follow-up survey of INS and NAN members. Archives of Clinical Neuropsychology, 31(3), 206–230. 10.1093/arclin/acw007. [DOI] [PubMed] [Google Scholar]
- Rentería, M. A., Mobley, T. M., Evangelista, N. D., Medina, L. D., Deters, K. D., Fox-Fuller, J. T., et al. (2023). Representativeness of samples enrolled in Alzheimer’s disease research centers. Alzheimer’s & Dementia: Diagnosis, Assessment & Disease Monitoring, 15(2), e12450. 10.1002/dad2.12450. [DOI] [PMC free article] [PubMed] [Google Scholar]
- Roalf, D., Moberg, P., Xie, S., Wolk, D., Moelter, S., & Arnold, S. (2013). Comparative accuracies of two common screening instruments for the classification of Alzheimer’s disease, mild cognitive impairment and healthy aging. The Journal of the Alzheimer's Association, 9(5), 529–537. 10.1016/j.jalz.2012.10.001. [DOI] [PMC free article] [PubMed] [Google Scholar]
- Rossetti, H. C., Lacritz, L. H., Cullum, C. M., & Weiner, M. F.. (2011). Normative data for the Montreal Cognitive Assessment (MoCA) in a population-based sample. Neurology, 77(13), 1272–1275. [DOI] [PubMed] [Google Scholar]
- Rossetti, H., Smith, E., Hynan, L., Lacritz, L., Cullum, C., Van Wright, A., et al. (2019). Detection of mild cognitive impairment among community-dwelling African Americans using the Montreal cognitive assessment. Archives of Clinical Neuropsychology, 34(6), 809–813. 10.1093/arclin/acy091. [DOI] [PMC free article] [PubMed] [Google Scholar]
- Sachs, B. C., Chelune, G. J., Rapp, S. R., Couto, A. M., Willard, J. J., Williamson, J. D., et al. (2021). Robust demographically-adjusted normative data for the Montreal cognitive assessment (MoCA): Results from the systolic blood pressure intervention trial. The Clinical Neuropsychologist., 36(8), 2237–2259. 10.1080/13854046.2021.1967450. [DOI] [PMC free article] [PubMed] [Google Scholar]
- Slick, D. J. (2006). Psychometrics in neuropsychological assessment. In Strauss, E., Sherman, E. M., & Spreen, O. (Eds.), A compendium of neuropsychological tests: Administration, norms, and commentary (3rd ed., pp. 1–43). Oxford University Press. [Google Scholar]
- Smith, T., Gildeh, N., & Holmes, C. (2007). The Montreal cognitive assessment: Validity and utility in a memory clinic setting. Canadian Journal of Psychiatry, 52(5), 329–332. 10.1177/070674370705200508. [DOI] [PubMed] [Google Scholar]
- Tobit, J. (1958). Estimation of relationships for limited dependent variables. Econometrica, 26(1), 24–36. 10.2307/1907382. [DOI] [Google Scholar]
- Weintraub, S., Besser, L., Dodge, H. H., Teylan, M., Ferris, S., Goldstein, F. C., et al. (2018). Version 3 of the Alzheimer disease centers’ neuropsychological test battery in the uniform data set (UDS). Alzheimer Disease and Associated Disorders, 32(4), 351–358. 10.1097/WAD.0000000000000279. [DOI] [PMC free article] [PubMed] [Google Scholar]
- Wittich, W., Phillips, N., Nasreddine, Z. S., & Chertkow, H. (2010). Sensitivity and specificity of the Montreal cognitive assessment modified for individuals who are visually impaired. Journal of Visual Impairment & Blindness, 104(6), 360–368. 10.1177/0145482X1010400606. [DOI] [Google Scholar]