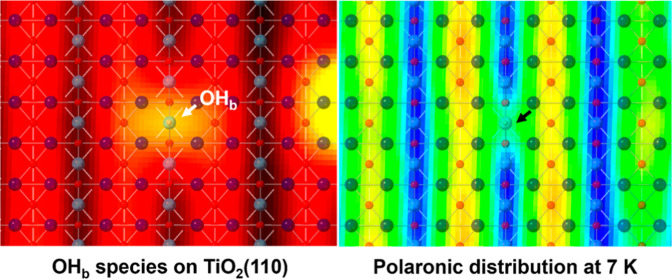
Abstract
Using scanning tunneling microscopy (STM), we investigate the spatial distribution of the bridging hydroxyl (OHb) bound excess electrons on the rutile TiO2(110) surface and its temperature dependence. By performing simultaneously recorded empty and filled state imaging on single OHbs at different temperatures in STM, we determine that the spatial distribution of the OHb bound excess electrons retains a symmetric four-lobe structure around the OHb at both 78 and 7 K. This indicates that OHbs are much weaker charge traps compared to bridging O vacancies (Ob-vac). In addition, by sequentially removing the capping H of each OHb using voltage pulses, we find that the annihilation of each OHb is accompanied by the disappearance of some lobes in the filled state STM, thus verifying the direct correlation between OHbs and their excess electrons.
Introduction
A Polaron is a quasiparticle formed when an electronic charge carrier introduced into a dielectric becomes localized at one of the symmetrically equivalent sites available. This alters the equilibrium positions of the surrounding lattice ions and subsequently creates a potential well that traps the carrier.1
These self-trapped polarons are believed to play a vital role in the physics and chemistry of many metal oxides, and technologically relevant phenomena as diverse as photolysis,2 high temperature conductivity3 and resistive switching.4 In light of this, polarons in materials including transition metal oxides, cuprates and 2D materials have been extensively characterized,5−26 and their influence on physical phenomena such as charge transport, surface reactivity and colossal magneto-resistance widely studied.4,27−35
Titanium dioxide (TiO2), a prototypical metal oxide system with applications ranging across heterogeneous catalysis, photolysis and solar cells etc.,36−40 has recently become a realistic material platform with which to study the polaron properties and their relevance to chemical processes. Taking the most stable (110) face of TiO2 in the rutile form as an example: its surface structure (Figure 1a) comprises rows of fivefold coordinated Ti4+ ions that alternate with those of twofold coordinated bridging O2– ions (Ob).41 TiO2 is a wide band-gap insulator (Egap ∼ 3 eV), which can be made semiconducting upon reduction by cycles of ion sputtering and annealing.42 Such a reduction process leads to the formation of bridging oxygen vacancies (Ob-vacs) on the surface,43−45 and two excess electrons for each created Ob-vac. Previous studies showed that these excess electrons mainly reside at the subsurface Ti6c sites (beneath the surface Ti5c rows) surrounding the Ob-vacs and reduce the associating Ti ions,30,46−49 with a small number occupying the surface Ti sites as observed by resonant photoemission diffraction.50,51 This results in Ti3+ 3d derived defect states, namely the band gap state (BGS), formed at ∼1 eV below the Fermi level (EF) within the band gap.52,53 Further studies verified the polaronic character of the Ob-vac bound excess electrons,54−56 and their strong interaction with adsorbates in model chemical processes.31,57,58
Figure 1.
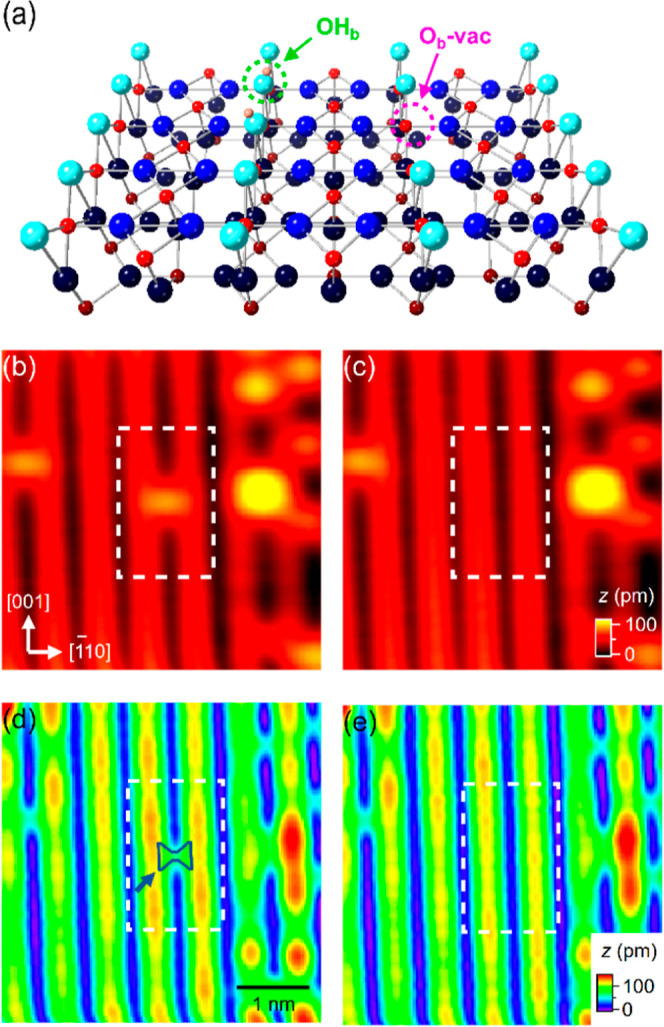
(a) Structural model of rutile TiO2(110). Spheres of different colors represent Obs (cyan), in-plane Os (mid blue), subsurface Os (dark blue), surface Ti ions (mid red), sub-surface Ti ions (dark red), and H atoms (pale pink), respectively. Ob-vac and OHb species are also indicated. (b) Empty- and (d) filled-states 78 K STM images of (4 nm)2 TiO2(110) with a single OHb. In (d), a bow-tie feature at the OHb site that links the adjacent Ti5c rows is indicated (c,e) As (b,d), recorded after removal of the capping H atom (marked by an arrow) from the OHb with a 3 V, 1 ms tip pulse. Scan parameters (V, I): (b,d) 0.9 V, 50 pA, and (c,e) −1 V, 50 pA. Dashed rectangles mark the region where the four-lobe excess electron distribution surrounding the OHb (d) disappears after the capping H removal.
Ob-vacs on TiO2(110) are the most reactive sites for a diverse set of chemical reactions. Taking H2O adsorption on TiO2(110) as an example: H2O molecules adsorb dissociatively at Ob-vacs, forming a pair of bridging hydroxyls (OHb) for each Ob-vac.59−63 Over time, the OHbs within the OHb pair diffuse away from each other and form two single OHbs. Previous studies showed that dissociative H2O adsorption on TiO2(110) does not cause any change to the BGS population. On this basis, one can assume that upon dissociative H2O adsorption, the excess electrons originally belonging to Ob-vacs are transferred to the newly formed OHb pairs, with each pair sharing two excess electrons. Also, it is believed that further splitting of a OHb pair into two single OHbs should lead to a redistribution of the excess electrons between the two OHbs.
Scanning tunneling microscopy (STM), resonant photoemission diffraction, and density functional theory (DFT) calculations have been widely used to study the excess electron distribution in different metal oxide systems owing to their complementary advantages. In particular, using simultaneously recorded empty-(ES) and filled-states (FS) imaging (or dual-mode imaging) in STM, we previously observed that the Ob-vac bound electron polaron distribution adopts a symmetric four-lobe structure surrounding the Ob-vac at 78 K, which transforms into one of the three in-equivalent two-lobe structures as the temperature drops to 7 K.56 Here, we use low temperature dual-mode imaging in STM to determine how the bound polarons are distributed around the OHb species following dissociative H2O adsorption. Moreover, we investigate their temperature dependent behavior. The answers to these questions will further our understanding of the intrinsic difference between Ob-vac and OHb species as charge traps. It will also illuminate the debate about the difference between the two types of OHb (one formed at the Ob-vac site and another at one of the neighboring Ob site).60
Experimental Section
STM experiments were performed using an Omicron GmbH low temperature scanning tunneling microscope housed in an ultrahigh vacuum chamber with a base pressure in the 10–11 mbar region. To probe excess electrons associated with OHb, we performed simultaneously recorded filled (FS, using negative samples bias) and empty states (ES, using positive sample bias) STM imaging (namely, dual-mode imaging): in the forward scan along the fast scan direction, a line of topography data is recorded at positive sample bias; in the backward scan, a line of data is recorded with negative sample bias so that two images (ES and FS images) are recorded quasi-simultaneously. This eliminates the effects of thermal or piezo drift so that images obtained at opposite polarities can be directly correlated. To rule out the possibility of introducing any artifact from the forward scan to the backward scan, the polarity was occasionally reversed, i.e. the forward scans were negatively biased and backward scans were positively biased. No difference was observed in the resulting images.
To obtain a TiO2(110) single crystal sample with sufficient electrical conductivity for STM measurements at very low temperatures (T ∼ 7 K), we employed a special sample preparation procedure: first, a fresh rutile TiO2(110) sample (Pi-Kem) was subjected to about a hundred cycles of argon ion sputtering and vacuum annealing up to 1000 K; then, the as-prepared sample was left in the preparation chamber at a base pressure of 2 × 10⁻¹⁰ mbar at room temperature. In this environment, water from the residual vacuum reacts with Ob-vacs on the sample surface, forming two OHbs for each Ob-vac.59−61 In this way, a fully hydroxylated surface (h-TiO2) with a high density of OHbs is formed. This reaction removes all the surface Ob-vacs.64
We previously showed that the Ob-vac bound polarons separated from each other by at least three unit cells along the [001] direction, or at least one unit cell along [1̅10] have no measurable interaction with each other.56 On this basis, we prepared single OHbs on h-TiO2 as follows: first using dual-mode imaging to locate the OHbs isolated from regions of charged impurities. Then, using voltage pulses (3 V, 1 ms at 78 K; 3.5 V, 1 ms at 7 K) we removed the capping Hs of all other OHbs surrounding our targeted OHb species.65 This led to a small surface area, usually about (5 nm)-2 containing only a few single noninteracting OHbs with their associated excess electron distributions.
Results and Discussion
Figure 1 shows a dual-mode 78 K image of a single OHb on TiO2(110) (Figure 1b,d), and those taken after the removal of its capping H (Figure 1c,e) using a +3 V, 1 ms tip pulse. Before the capping H removal, the FS image of a single OHb is characterized by a bowtie-shaped feature at its position linking the neighboring Ti5c rows, altogether with a nearly symmetric four-lobe structure with lobes located at the diagonal Ti5c sites (Figure 1d). All of these features disappear after the capping H is removed (Figure 1e). Previous STM work by Minato et al. observed a similar FS image of single OHb.52 Previous DFT calculations of the hydroxylated TiO2(110) surface show that the Ti6c sites in the second subsurface layer beneath the surface Ti5c rows are the most stable sites for the OHb-polaron occupation.46,66 On this basis, we attribute the observed enhanced contrast along the Ti5c rows in the FS images to the excess electrons populating in the second subsurface layer underneath the surface Ti5c rows.
We previously reported that the spatial distribution of the Ob-vac bound excess electrons on the reduced surface of TiO2(110) (r-TiO2) transforms from a symmetric four lobe structure at 78 K into one of three asymmetric, two lobe structures at 7 K.56 Our findings confirmed the polaronic nature of the excess electrons on TiO2(110), which motivates this study of the spatial distribution of the OHb bound excess electrons and its temperature dependence. Before looking into this, we first examined how the FS image contrast changes when the capping Hs of a group of OHbs are removed by using tip pulses. The results are shown in Figure 2, where all of the capping Hs at the center of the imaged region (marked by dashed rectangles) are removed (Figure 2a). In the FS images (Figure 2b), the H-stripped area appears much darker along the Ti5c rows compared with the H-capped region. Hence, there is a direct correlation between OHbs and the excess electrons that appear as lobes on the Ti5c rows in the FS images (Figure 2b). There are two likely modes in which the excess electrons could dissipate, depending on whether H is desorbed as a cation or a neutral species. In the former, electrons would be lost to the STM apparatus, while in the latter, the electrons would be captured by the bridging O ions.
Figure 2.
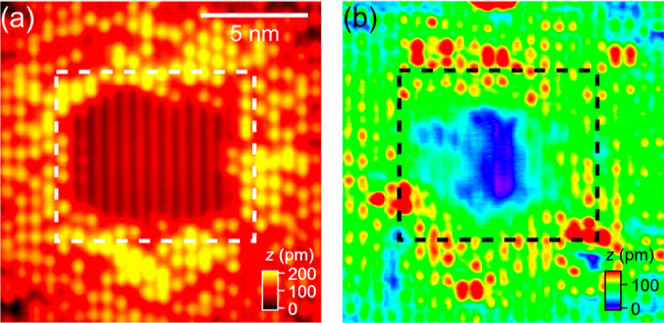
(a) ES- and (b) FS- images of h-TiO2 recorded after sequential removal of the capping Hs of all OHbs in the central part of the scanned region using +3.5 V, 1 ms tip pulses. The images were recorded at 7 K. Image size: (15 nm)2. Scan parameters (V, I): (a) +2 V, 10 pA; (b) −2 V, 1 pA.
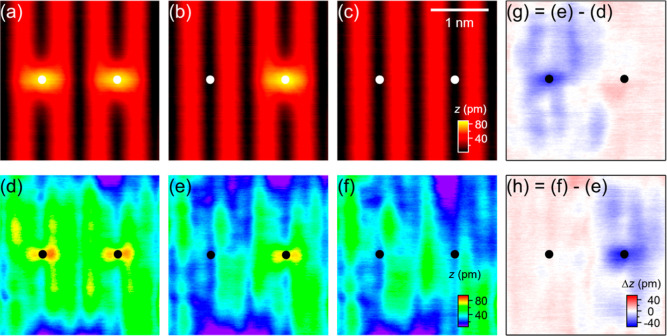
Having established the relationship between OHbs and their associating excess electrons, we turn to the 7 K distribution of excess electrons surrounding single OHb species. Figure 3 shows the dual-mode images recorded before and after the capping Hs of two single OHbs was sequentially removed using +3.5 V, 1 ms tip pulses. The ES images in Figure 3a–c simply evidence the conversion of OHb to Ob. In the FS image (Figure 3d), each OHb image appears to be characterized by a nearly symmetric four-lobe structure. This is very different from the behavior of Ob-vacs, the excess electron distribution of which is highly asymmetric at 7 K.56 We attribute this difference to the absence of polaron hopping at low temperature in the case of the Ob-vac bound electrons but not for the OHb polarons. Intuitively, the much faster hopping of the OHb bound electrons evidenced at 7 K can be understood by (i) the weaker attractive force of OHb (formal charge of 1+) to electrons as compared to Ob-vac (formal charge of 2+), and (ii) the much smaller local distortion of the lattice from the formation of an OHb by adding a H to an Ob as compared to that of Ob-vac (by losing an Ob).
Figure 3.
Simultaneously recorded (a) ES and (d) FS images of TiO2(110) containing two single OHbs. The images were recorded at 7 K. (b,e) As (a,d) recorded after the capping H of the OHb on the left was removed by a +3.5 V, 1 ms tip pulse. (c,f) As (b,e) recorded after removal of the capping H of the OHb on the right. Circles mark the OHb positions. Image size: (2.74 nm)2. Scan parameters (V, I): (a–c) +2 V, 30 pA; (d–f) −2 V, 1 pA. (g–h) Difference images formed by subtraction of the FS image in (d) from that in (e), and of the FS image in (e) from that in (f), respectively.
Not only is there little difference between the spatial distribution of the OHb bound excess electrons at 78 and 7 K, but there is also a similar effect of removing capping H at the two temperatures. Figure 3 shows the dual-mode images of two separated single OHbs, and those recorded after the sequential removal of their capping Hs by tip pulses. After the capping H on the left is removed (Figure 3b), not only the bowtie-shaped feature in the FS STM at the OHb center disappears, the lobes distributed at the Ti5c sites around the OHb (Figure 3d) also vanish in the FS image (Figure 3e). The similar observation also applies to the OHb on the right (see Figure 3e,f). To better visualize the changes in the FS images, we present in Figure 3g,h, the difference images formed by subtraction of the FS images taken before and after each capping H removal. There, one clearly can see that each OHb is characterized by a bowtie-shaped feature at the center with four lobes distributed at each of the second nearest Ti5c sites around it. This again confirms the observation of a nearly symmetric, four-lobe structure for the distribution of the OHb-bound excess electrons at 7 K. Taking a closer look at the difference image (Figure 3g), we also observe a redistribution of the excess electrons in the vicinity of the OHb on the right after the capping H of the OHb on the left is removed, as evidenced by the additional lobe of density loss in the bottom region between the two OHbs. In addition, the difference images (Figure 3g,h) show only a reduction in the FS contrast in close proximity to the OHbs, while that in the surrounding region remains unchanged. This is consistent with dissipation of the excess electrons through the STM apparatus or capture by bridging O ions, as noted above.
Previous studies showed that when a H2O molecule adsorbs dissociatively at an Ob-vac, two OHbs, one at the Ob-vac site (namely v-OHb) and another at one of the two nearest-neighboring Ob ions (namely b-OHb), are formed.59,62 A later STM study by Zhang et al. determined that the capping Hs of b-OHbs are ten times more likely to hop along the Ti5c rows compared to v-OHbs, evidencing their inequivalence.60 One possible scenario is that the distribution of the excess electrons, originally belonging to the Ob-vac, between v- and b-OHb within a newly formed OHb pair is uneven. To gain further insight into this, we employed a “pulse and track” approach, i.e. recorded dual-mode STM images before and after each successive removal of the capping Hs from the OHbs within the OHb pair using tip pulses. In doing so, we aim to find out how the excess electrons are trapped and how they are distributed around each of the OHbs within the OHb pair. Before discussing that, we first discuss how successive tip-induced removal of the capping Hs of the OHb species surrounding a OHb pair influence the polaron distribution of the OHb pair.
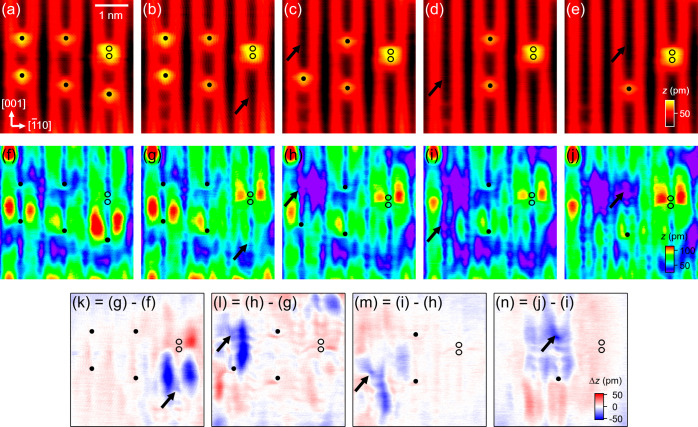
Figure 4 shows a series of simultaneously recorded dual-mode images, recorded at 6.6 K, taken before and after the sequential removal of each of the capping Hs with tip pulses (+3.5 V, 1 ms). Before imaging, the capping Hs of most of the OHbs originally present in the scanned region were removed using the same tip pulses. This leaves only five OHbs and one OHb pair remaining in the scanned region. As shown in the FS images (Figure 4f–j) and in the difference images (Figure 4k–n), the removal of each capping H is always accompanied by changes in image contrast in the FS image. Taking the OHb at the bottom right as an example, after its capping H is removed (Figure 4b), the two lobes originally present at the Ti5c sites above that of OHb disappear (Figure 4f). Their disappearance is also accompanied by some increase in the intensity of the lobes at the Ti sites above the OHb pair at the top right of the image (Figure 4g). This indicates that not only does the removal of that capping H lead to a dissipation of the associated excess electrons but also it results in modification of the excess electron distribution surrounding that OHb-pair. Similar changes to the excess electron distributions surrounding the OHb and OHb pair on the surface have also been observed following the removal of other capping Hs, see the images (Figure 4g–j) and the corresponding difference images (Figure 4l–n) for such changes.
Figure 4.
Simultaneously recorded (a) ES and (f) FS images of h-TiO2. Before imaging, the capping Hs of most OHbs originally present were removed using +3.5 V, 1 ms tip pulses, leaving only five OHbs and one OHb pair remaining in the imaged region. (b–j) As (a–f) following the sequential removal of the capping H of each of the OHb species using the same tip pulses. Solid circles mark the positions of single OHbs. Open circles mark those in the OHb pair. Arrows indicate the capping H being removed in each frame. All images were recorded at 6.6 K. Image size: (4 × 4) nm2. Scan parameters (V, I): (a–e) +2 V, 30 pA; (f–j) −2 V, 1 pA. (k–n) Difference images formed by subtraction of the FS images obtained before and after the removal of the capping H within each OHb species.
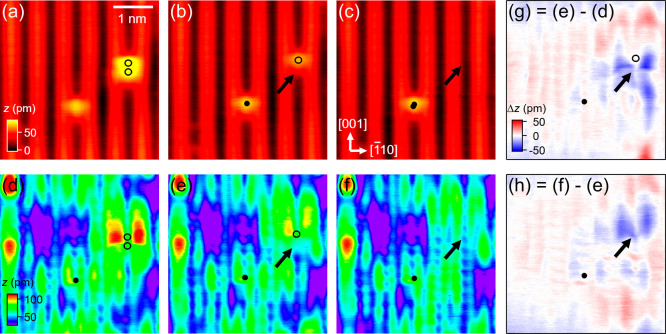
In addition to studying the influence of neighboring OHbs on the polaron distribution surrounding a OHb pair, we have also investigated how the polaron distribution surrounding an OHb pair changes upon the sequential removal of its capping Hs, and our results are shown in Figure 5. The initial empty and filled state images are shown in Figure 5a,d, respectively. The filled state image evidences a distribution of the OHb pair bound polarons that has a three lobe structure. The apparent asymmetry in the FS image is consistent with the asymmetric behavior observed by Zhang et al. in the mobility of the two types of bridging hydroxyls.60 After the first capping H within the OHb pair was removed by a tip pulse (Figure 5b), the lobes become significantly weaker in intensity and displace away from their original positions (Figure 5e,g). Then, after the second capping H was removed (Figure 5c), the lobes further weaken and dissipate further away from the original position of the OHb pair (Figure 5f,h). Based on the above, we conclude that, first, OHbs are weaker as charge traps compared to a OHb pair, and second, as all the charge traps on the surface are removed, the excess electrons originally bound to those charge traps are dissipated. Meanwhile, the resulting absence of any charge traps leads to much more uniform appearance along the Ti5c rows (Figure 5f).
Figure 5.
Simultaneously recorded (a) ES and (d) FS images of TiO2(110) containing one single OHb and one OHb pair. (b–c) As (a), but recorded after the capping H atoms of the OHb pair were removed sequentially using +2.6 V, 200 ms tip pulses. Solid circles mark the positions of single OHb. Open circles mark the OHb within the OHb pair. Arrows indicate the capping H that was removed in each frame. (e–f) Corresponding FS images of (b–c), respectively. All images were recorded at 6.6 K. Image size: (4 × 4) nm2. Scan parameters (V, I): (a–c) ±2 V, 30 pA; (d–f) −2 V, 1 pA. (g–h) Difference images formed by subtraction of the FS images obtained before and after the removal of each capping H within the OHb pair.
Through comparison of the STM data shown in Figures 3–5, we find that the almost symmetric four-lobe structure of the spatial distribution of the OHb bound polarons at T = 7 K transforms into one of the asymmetric two- or three-lobe structures as temperature is reduced to 6.6 K. We attribute such change in the polaronic distribution to the temperature-dependent hopping behavior of polarons: at 7 K polarons still hop between the subsurface Ti6c sites surrounding a OHb and their motion starts to freeze; at 6.6 K their motion becomes completely frozen and depending on the local chemical environment,56 their distribution about a OHb adopts one of the asymmetric structures.
Summary
To summarize, employing dual-mode imaging to study the spatial distribution of the OHb bound excess electrons on the (110) surface of TiO2 rutile, we found that their distributions retain a symmetric, four-lobe structure at temperature of 7 K, suggesting that OHbs are much weaker as charge traps compared to Ob-vacs, with their associated polarons requiring much less energy to hop over different Ti sites surrounding the vacancies. In addition, using voltage pulses to sequentially remove the capping H of each of the OHbs and monitoring the corresponding changes in the image contrast within the FS STM, we found that every capping H removal is accompanied by the disappearance of some FS contrast surrounding the removed capping H position, thus verifying that each OHb, once formed, is accompanied by a polaron.
Acknowledgments
We are grateful to Matthew Wolf for useful discussions. This work was supported by the European Research Council Advanced Grant ENERGYSURF (G.T.), the EPSRC through grant EP/L015277/1, European Cooperation in Science and Technology Action CM1104, the Royal Society (UK), and Alexander von Humboldt Stiftung (Germany). C.M.Y. acknowledges support from a TDLI Start-up fund.
The authors declare no competing financial interest.
Special Issue
Published as part of The Journal of Physical Chemistry Cvirtual special issue “Francesc Illas and Gianfranco Pacchioni Festschrift”.
References
- Emin D.Polarons; Cambridge University Press: Cambridge, 2012. [Google Scholar]
- Metal Oxide Catalysis; Jackson S. D., Hargreaves J. S. J., Eds.; Wiley VCH: Weinheim, 2009; . [Google Scholar]
- Polarons and Bipolarons in High-Tc Superconductors and Related Materials; Salje E. K. H., Alexandrov A. S., Liang W. Y., Eds.; Cambridge University Press: Cambridge, 1995; . [Google Scholar]
- Wang M.; Bi C.; Li L.; Long S.; Liu Q.; Lv H.; Lu N.; Sun P.; Liu M. Thermoelectric Seebeck effect in oxide-based resistive switching memory. Nat. Commun. 2014, 5, 4598. 10.1038/ncomms5598. [DOI] [PMC free article] [PubMed] [Google Scholar]
- Polarons in Advanced Materials; Alexandrov A. S., Ed. ; Springer Series in Materials Science; Springer: Dordrecht, 2007; Vol. 103 [Google Scholar]
- Nagels P.; Denayer M.; Devreese J. Electrical properties of single crystals of uranium dioxide. Solid State Commun. 1963, 1, 35–40. 10.1016/0038-1098(63)90388-0. [DOI] [Google Scholar]
- Crevecoeur C.; De Wit H. Electrical conductivity of Li doped MnO. J. Phys. Chem. Solids 1970, 31, 783–791. 10.1016/0022-3697(70)90212-X. [DOI] [Google Scholar]
- Stoneham A. M.; Gavartin J.; Shluger A. L.; Kimmel A. V.; Ramo D. M.; Rønnow H. M.; Aeppli G.; Renner C. Trapping, self-trapping and the polaron family. J. Phys.: Condens. Matter 2007, 19, 255208. 10.1088/0953-8984/19/25/255208. [DOI] [Google Scholar]
- Coropceanu V.; Cornil J.; da Silva Filho D. A.; Olivier Y.; Silbey R.; Brédas J. L. Charge Transport in Organic Semiconductors. Chem. Rev. 2007, 107, 926–952. 10.1021/cr050140x. [DOI] [PubMed] [Google Scholar]
- Zhugayevych A.; Tretiak S. Theoretical Description of Structural and Electronic Properties of Organic Photovoltaic Materials. Annu. Rev. Phys. Chem. 2015, 66, 305–330. 10.1146/annurev-physchem-040214-121440. [DOI] [PubMed] [Google Scholar]
- De Sio A.; Troiani F.; Maiuri M.; Réhault J.; Sommer E.; Lim J.; Huelga S. F.; Plenio M. B.; Rozzi C. A.; Cerullo G.; et al. Tracking the coherent generation of polaron pairs in conjugated polymers. Nat. Commun. 2016, 7, 13742. 10.1038/ncomms13742. [DOI] [PMC free article] [PubMed] [Google Scholar]
- Kaminski A.; Das Sarma S. Polaron Percolation in Diluted Magnetic Semiconductors. Phys. Rev. Lett. 2002, 88, 247202. 10.1103/PhysRevLett.88.247202. [DOI] [PubMed] [Google Scholar]
- Teresa J. M. D.; Ibarra M. R.; Algarabel P. A.; Ritter C.; Marquina C.; Blasco J.; García J.; del Moral A.; Arnold Z. Evidence for magnetic polarons in the magneto-resistive perovskites. Nature 1997, 386, 256–259. 10.1038/386256a0. [DOI] [Google Scholar]
- Zhou J.-S.; Goodenough J. B. Zener versus de Gennes ferromagnetism in La1-xSrxMnO3. Phys. Rev. B 2000, 62, 3834–3838. 10.1103/PhysRevB.62.3834. [DOI] [Google Scholar]
- Daoud-Aladine A.; Rodríguez-Carvajal J.; Pinsard-Gaudart L.; Fernández-Díaz M. T.; Revcolevschi A. Zener Polaron Ordering in Half-Doped Manganites. Phys. Rev. Lett. 2002, 89, 097205. 10.1103/physrevlett.89.097205. [DOI] [PubMed] [Google Scholar]
- Yamada Y.; Hino O.; Nohdo S.; Kanao R.; Inami T.; Katano S. Polaron Ordering in Low-Doping La1-xSrxMnO3. Phys. Rev. Lett. 1996, 77, 904–907. 10.1103/PhysRevLett.77.904. [DOI] [PubMed] [Google Scholar]
- Zhao G.-M.; Hunt M. B.; Keller H.; Müller K. A. Evidence for polaronic supercarriers in the copper oxide superconductors La2-xSrxCuO4. Nature 1997, 385, 236–239. 10.1038/385236a0. [DOI] [Google Scholar]
- Cortecchia D.; Yin J.; Bruno A.; Lo S.-Z. A.; Gurzadyan G. G.; Mhaisalkar S.; Brédas J. L.; Soci C. Polaron self-localization in white-light emitting hybrid per- ovskites. J. Mater. Chem. C 2017, 5, 2771–2780. 10.1039/C7TC00366H. [DOI] [Google Scholar]
- Miyata K.; Meggiolaro D.; Trinh M. T.; Joshi P. P.; Mosconi E.; Jones S. C.; De Angelis F.; Zhu X.-Y. Large polarons in lead halide perovskites. Sci. Adv. 2017, 3, e1701217 10.1126/sciadv.1701217. [DOI] [PMC free article] [PubMed] [Google Scholar]
- Chen Q.; Wang W.; Peeters F. M. Magneto-polarons in monolayer transition-metal dichalcogenides. J. Appl. Phys. 2018, 123, 214303. 10.1063/1.5025907. [DOI] [Google Scholar]
- Kang M.; Jung S. W.; Shin W. J.; Sohn Y.; Ryu S. H.; Kim T. K.; Hoesch M.; Kim K. S. Holstein polaron in a valley-degenerate two-dimensional semiconductor. Nat. Mater. 2018, 17, 676–680. 10.1038/s41563-018-0092-7. [DOI] [PubMed] [Google Scholar]
- McKenna K. P.; Wolf M. J.; Shluger A. L.; Lany S.; Zunger A. Two-Dimensional Polaronic Behavior in the Binary Oxides m-HfO2 and m-ZrO2. Phys. Rev. Lett. 2012, 108, 116403. 10.1103/PhysRevLett.108.116403. [DOI] [PubMed] [Google Scholar]
- Reticcioli M.; Wang Z.; Schmid M.; Wrana D.; Boatner L. A.; Diebold U.; Setvin M.; Franchini C. Competing electronic states emerging on polar surfaces. Nat. Commun. 2022, 13, 4311. 10.1038/s41467-022-31953-6. [DOI] [PMC free article] [PubMed] [Google Scholar]
- Liu H.; Wang A.; Zhang P.; Ma C.; Chen C.; Liu Z.; Zhang Y.-Q.; Feng B.; Cheng P.; Zhao J.; et al. Atomic-scale manipulation of single-polaron in a two-dimensional semiconductor. Nat. Commun. 2023, 14, 3690. 10.1038/s41467-023-39361-0. [DOI] [PMC free article] [PubMed] [Google Scholar]
- Cai M.; Miao M.-P.; Liang Y.; Jiang Z.; Liu Z.-Y.; Zhang W.-H.; Liao X.; Zhu L.-F.; West D.; Zhang S.; et al. Manipulating single excess electrons in monolayer transition metal dihalide. Nat. Commun. 2023, 14, 3691. 10.1038/s41467-023-39360-1. [DOI] [PMC free article] [PubMed] [Google Scholar]
- Yue X.; Wang C.; Zhang B.; Zhang Z.; Xiong Z.; Zu X.; Liu Z.; Hu Z.; Odunm-baku G. O.; Zheng Y.; et al. Real-time observation of the buildup of polaron in α-FAPbI3. Nat. Commun. 2023, 14, 917. 10.1038/s41467-023-36652-4. [DOI] [PMC free article] [PubMed] [Google Scholar]
- Nelson J.; Kwiatkowski J. J.; Kirkpatrick J.; Frost J. M. Modeling Charge Transport in Organic Photovoltaic Materials. Acc. Chem. Res. 2009, 42, 1768–1778. 10.1021/ar900119f. [DOI] [PubMed] [Google Scholar]
- Ortmann F.; Bechstedt F.; Hannewald K. Charge transport in organic crystals: Theory and modelling. Phys. Status Solidi B 2011, 248, 511–525. 10.1002/pssb.201046278. [DOI] [Google Scholar]
- Di Valentin C.; Pacchioni G.; Selloni A. Reduced and n-Type Doped TiO2: Nature of Ti3+Species. J. Phys. Chem. C 2009, 113, 20543–20552. 10.1021/jp9061797. [DOI] [Google Scholar]
- Papageorgiou A. C.; Beglitis N. S.; Pang C. L.; Teobaldi G.; Cabailh G.; Chen Q.; Fisher A. J.; Hofer W. A.; Thornton G. Electron traps and their effect on the surface chemistry of TiO2(110). Proc. Natl. Acad. Sci. USA 2010, 107, 2391–2396. 10.1073/pnas.0911349107. [DOI] [PMC free article] [PubMed] [Google Scholar]
- Reticcioli M.; Sokolović I.; Schmid M.; Diebold U.; Setvin M.; Franchini C. Interplay between Adsorbates and Polarons: CO on Rutile TiO2(110). Phys. Rev. Lett. 2019, 122, 016805. 10.1103/PhysRevLett.122.016805. [DOI] [PubMed] [Google Scholar]
- Yin W.-J.; Wen B.; Zhou C.; Selloni A.; Liu L.-M. Excess electrons in reduced rutile and anatase TiO2. Surf. Sci. Rep. 2018, 73, 58–82. 10.1016/j.surfrep.2018.02.003. [DOI] [Google Scholar]
- Reticcioli M.; Setvin M.; Hao X.; Flauger P.; Kresse G.; Schmid M.; Diebold U.; Franchini C. Polaron-Driven Surface Reconstructions. Phys. Rev. X 2017, 7, 031053. 10.1103/PhysRevX.7.031053. [DOI] [Google Scholar]
- Millis A. J.; Mueller R.; Shraiman B. I. Fermi-liquid-to-polaron crossover. II. Double exchange and the physics of colossal magnetoresistance. Phys. Rev. B 1996, 54, 5405–5417. 10.1103/PhysRevB.54.5405. [DOI] [PubMed] [Google Scholar]
- Verdi C.; Caruso F.; Giustino F. Origin of the crossover from polarons to Fermi liquids in transition metal oxides. Nat. Commun. 2017, 8, 15769. 10.1038/ncomms15769. [DOI] [PMC free article] [PubMed] [Google Scholar]
- Imagawa H.; Tanaka T.; Takahashi N.; Matsunaga S.; Suda A.; Shinjoh H. Synthesis and characterization of Al2O3 and ZrO2–TiO2 nano-composite as a support for NOx storage–reduction catalyst. J. Catal. 2007, 251, 315–320. 10.1016/j.jcat.2007.08.002. [DOI] [Google Scholar]
- Fujishima A.; Honda K. Electrochemical Photolysis of Water at a Semiconductor Electrode. Nature 1972, 238, 37–38. 10.1038/238037a0. [DOI] [PubMed] [Google Scholar]
- O’Regan B.; Grätzel M. A low-cost, high-efficiency solar cell based on dye-sensitized colloidal TiO2 films. Nature 1991, 353, 737–740. 10.1038/353737a0. [DOI] [Google Scholar]
- Grätzel M. Photoelectrochemical cells. Nature 2001, 414, 338–344. 10.1038/35104607. [DOI] [PubMed] [Google Scholar]
- Majumder D.; Roy S. Room Temperature Synthesis of TiO2 Nanospheres: Ammonia Sensing Characteristics. Mater. Today: Proc. 2018, 5, 9811–9816. 10.1016/j.matpr.2017.10.171. [DOI] [Google Scholar]
- Pang C. L.; Lindsay R.; Thornton G. Chemical reactions on rutile TiO2(110). Chem. Soc. Rev. 2008, 37, 2328–2353. 10.1039/b719085a. [DOI] [PubMed] [Google Scholar]
- Diebold U. The surface science of titanium dioxide. Surf. Sci. Rep. 2003, 48, 53–229. 10.1016/S0167-5729(02)00100-0. [DOI] [Google Scholar]
- Hugenschmidt M. B.; Gamble L.; Campbell C. T. The interaction of H2O with a TiO2(110) surface. Surf. Sci. 1994, 302, 329–340. 10.1016/0039-6028(94)90837-0. [DOI] [Google Scholar]
- Henderson M. A. Structural Sensitivity in the Dissociation of Water on TiO2 Single- Crystal Surfaces. Langmuir 1996, 12, 5093–5098. 10.1021/la960360t. [DOI] [Google Scholar]
- Henderson M. A. A surface perspective on self-diffusion in rutile TiO2. Surf. Sci. 1999, 419, 174–187. 10.1016/S0039-6028(98)00778-X. [DOI] [Google Scholar]
- Deskins N. A.; Rousseau R.; Dupuis M. Localized Electronic States from Surface Hydroxyls and Polarons in TiO2(110). J. Phys. Chem. C 2009, 113, 14583–14586. 10.1021/jp9037655. [DOI] [Google Scholar]
- Deskins N. A.; Rousseau R.; Dupuis M. Distribution of Ti3+ Surface Sites in Reduced TiO2. J. Phys. Chem. C 2011, 115, 7562–7572. 10.1021/jp2001139. [DOI] [Google Scholar]
- Kowalski P. M.; Camellone M. F.; Nair N. N.; Meyer B.; Marx D. Charge Localization Dynamics Induced by Oxygen Vacancies on the TiO2(110) Surface. Phys. Rev. Lett. 2010, 105, 146405. 10.1103/physrevlett.105.146405. [DOI] [PubMed] [Google Scholar]
- Reticcioli M.; Setvin M.; Schmid M.; Diebold U.; Franchini C. Formation and dynamics of small polarons on the rutile TiO2(110) surface. Phys. Rev. B 2018, 98, 045306. 10.1103/PhysRevB.98.045306. [DOI] [Google Scholar]
- Krüger P.; Bourgeois S.; Domenichini B.; Magnan H.; Chandesris D.; Le Fèvre P.; Flank A. M.; Jupille J.; Floreano L.; Cossaro A.; et al. Defect States at the TiO2(110) Surface Probed by Resonant Photoelectron Diffraction. Phys. Rev. Lett. 2008, 100, 055501. 10.1103/physrevlett.100.055501. [DOI] [PubMed] [Google Scholar]
- Krüger P.; Jupille J.; Bourgeois S.; Domenichini B.; Verdini A.; Floreano L.; Morgante A. Intrinsic Nature of the Excess Electron Distribution at the TiO2(110) Surface. Phys. Rev. Lett. 2012, 108, 126803. 10.1103/physrevlett.108.126803. [DOI] [PubMed] [Google Scholar]
- Minato T.; Sainoo Y.; Kim Y.; Kato H. S.; Aika K.-i.; Kawai M.; Zhao J.; Petek H.; Huang T.; He W.; et al. The electronic structure of oxygen atom vacancy and hydroxyl impurity defects on titanium dioxide (110) surface. J. Chem. Phys. 2009, 130, 124502. 10.1063/1.3082408. [DOI] [PubMed] [Google Scholar]
- Yim C. M.; Pang C. L.; Thornton G. Oxygen Vacancy Origin of the Surface Band-Gap State of TiO2(110). Phys. Rev. Lett. 2010, 104, 036806. 10.1103/PhysRevLett.104.036806. [DOI] [PubMed] [Google Scholar]
- Sezen H.; Buchholz M.; Nefedov A.; Natzeck C.; Heissler S.; Di Valentin C.; Wöll C. Probing electrons in TiO2 polaronic trap states by IR-absorption: Evidence for the existence of hydrogenic states. Sci. Rep. 2014, 4, 3808. 10.1038/srep03808. [DOI] [PMC free article] [PubMed] [Google Scholar]
- Setvin M.; Franchini C.; Hao X.; Schmid M.; Janotti A.; Kaltak M.; Van de Walle C. G.; Kresse G.; Diebold U. Direct View at Excess Electrons in TiO2 Rutile and Anatase. Phys. Rev. Lett. 2014, 113, 086402. 10.1103/PhysRevLett.113.086402. [DOI] [PubMed] [Google Scholar]
- Yim C.; Watkins M.; Wolf M.; Pang C.; Hermansson K.; Thornton G. Engineering Polarons at a Metal Oxide Surface. Phys. Rev. Lett. 2016, 117, 116402. 10.1103/PhysRevLett.117.116402. [DOI] [PubMed] [Google Scholar]
- Yim C. M.; Chen J.; Zhang Y.; Shaw B.-J.; Pang C. L.; Grinter D. C.; Bluhm H.; Salmeron M.; Muryn C. A.; Michaelides A.; et al. Visualization of Water- Induced Surface Segregation of Polarons on Rutile TiO2(110). J. Phys. Chem. Lett. 2018, 9, 4865–4871. 10.1021/acs.jpclett.8b01904. [DOI] [PubMed] [Google Scholar]
- Gao C.; Zhang L.; Zheng Q.; Zhao J. Tuning the Lifetime of Photoexcited Small Polarons on Rutile TiO2 Surface via Molecular Adsorption. J. Phys. Chem. C 2021, 125, 27275–27282. 10.1021/acs.jpcc.1c07697. [DOI] [Google Scholar]
- Bikondoa O.; Pang C. L.; Ithnin R.; Muryn C. A.; Onishi H.; Thornton G. Direct visualization of defect-mediated dissociation of water on TiO2(110). Nat. Mater. 2006, 5, 189–192. 10.1038/nmat1592. [DOI] [Google Scholar]
- Zhang Z.; Bondarchuk O.; Kay B. D.; White J. M.; Dohnálek Z. Imaging Water Dissociation on TiO2(110): Evidence for Inequivalent Geminate OH Groups. J. Phys. Chem. B 2006, 110, 21840–21845. 10.1021/jp063619h. [DOI] [PubMed] [Google Scholar]
- Wendt S.; Schaub R.; Matthiesen J.; Vestergaard E.; Wahlström E.; Rasmussen M.; Thostrup P.; Molina L.; Lægsgaard E.; Stensgaard I.; et al. Oxygen vacancies on TiO2(110) and their interaction with H2O and O2: A combined high-resolution STM and DFT study. Surf. Sci. 2005, 598, 226–245. 10.1016/j.susc.2005.08.041. [DOI] [Google Scholar]
- Wendt S.; Matthiesen J.; Schaub R.; Vestergaard E. K.; Lægsgaard E.; Besen-bacher F.; Hammer B. Formation and Splitting of Paired Hydroxyl Groups on Reduced TiO2(110). Phys. Rev. Lett. 2006, 96, 066107. 10.1103/PhysRevLett.96.066107. [DOI] [PubMed] [Google Scholar]
- Brookes I. M.; Muryn C. A.; Thornton G. Imaging Water Dissociation on TiO2(110). Phys. Rev. Lett. 2001, 87, 266103. 10.1103/PhysRevLett.87.266103. [DOI] [PubMed] [Google Scholar]
- Matthey D.; Wang J. G.; Wendt S.; Matthiesen J.; Schaub R.; Lægsgaard E.; Hammer B.; Besenbacher F. Enhanced Bonding of Gold Nanoparticles on Oxidized TiO2(110). Science 2007, 315, 1692–1696. 10.1126/science.1135752. [DOI] [PubMed] [Google Scholar]
- Minato T.; Kajita S.; Pang C.-L.; Asao N.; Yamamoto Y.; Nakayama T.; Kawai M.; Kim Y. Tunneling Desorption of Single Hydrogen on the Surface of Titanium Dioxide. ACS Nano 2015, 9, 6837–6842. 10.1021/acsnano.5b01607. [DOI] [PubMed] [Google Scholar]
- Deskins N. A.; Dupuis M. Electron transport via polaron hopping in bulk TiO2: A density functional theory characterization. Phys. Rev. B 2007, 75, 195212. 10.1103/PhysRevB.75.195212. [DOI] [Google Scholar]


