

Abstract
Objectives:
Identifying whether obesity is a risk factor for dementia is complicated by the possibility of weight change as dementia evolves. This article investigates an extended time path of body mass index (BMI) before and after incident dementia in a nationally representative sample.
Methods:
Using the Health and Retirement Study (2000–2016), we examine (1) the longitudinal relationship between BMI and incident dementia and (2) heterogeneity in the BMI trajectory by initial BMI level.
Results:
Weight loss begins at least one decade before incident dementia, then accelerates in the years immediately preceding dementia onset and continues after incident dementia. Those with higher levels of BMI at baseline experienced a much greater decline relative to those with a normal weight.
Discussion:
Our results help explain the contradicting findings in the literature regarding the relationship between obesity and dementia and highlight the need for using extended longitudinal data to understand dementia risk.
Keywords: obesity, cognitive health, weight loss, health and retirement study
Introduction
The concurrent and ongoing epidemics of obesity and dementia have elicited serious concern over the role of obesity in dementia. As even a modest effect of obesity on increasing the risk of dementia could have far-reaching public health implications, a better understanding of the relationship between obesity and dementia is vital (Dahl & Hassing, 2013; Whitmer & Yaffe, 2006). Nevertheless, the extant literature regarding an association between BMI and dementia reveals a complex picture. Associations between BMI and dementia often differ by the age of the study sample. While many studies of older populations have reported that obesity measured at older ages is not associated with, or is inversely associated with, dementia risk (Dahl et al., 2008; Luchsinger et al., 2007; Qizilbash et al., 2015), other studies of overweight or obesity in middle age have found that it is associated with an elevated risk of dementia (Hassing et al., 2009; Pedditzi et al., 2016; Whitmer et al., 2005; Xu et al., 2011). Moreover, studies that used data from the same sample have revealed a changing pattern in the association between BMI and dementia depending on the age at which the BMI was measured. For example, Singh-Manoux and colleagues examined the association between BMI and dementia at ages 50, 60, and 70 and found that only obesity at age 50 is significantly related to dementia risk (Singh-Manoux et al., 2018). Fitzpatrick et al. found that being obese at age 50 is associated with an elevated risk of dementia occurrence but being obese at age 65 is associated with reduced risk (Fitzpatrick et al., 2009). In another study that examined the association between repeated BMI measures and subsequent dementia risk, Li et al. found that BMI at ages 40–49 years was positively associated with incident dementia but BMI after age 70 was negatively associated with dementia (Li et al., 2021).
A compelling explanation of the changing relationship between obesity and dementia risk with age—as well as of some contradictory findings in the literature—is that weight loss may occur during the incubation period of dementia (Buchman et al., 2005; Power et al., 2013; Tolppanen et al., 2014). Although the underlying mechanisms are not well understood, a positive association between BMI and dementia risk could be attributed to vascular mechanisms and metabolic dysfunction, whereas the decline in BMI accompanying the course of dementia could reflect neurodegeneration and pathology of energy homeostatic centers in the brain and could also result from impaired autonomy, eating difficulties, and dementia pharmacotherapies (Aziz et al., 2008; Franx et al., 2017; Poehlman & Dvorak, 2000). Understanding the complex dynamics between BMI and dementia progression will provide key insights that can be used to address the challenges of identifying dementia risk factors, prevention, prognosis, and management.
Some studies have investigated the course of weight change before dementia diagnosis in relatively homogeneous, non-representative populations. Using the record linkage system of the Rochester Epidemiology Project to ascertain incident cases of dementia, Knopman et al. compared the BMI of dementia subjects and age-matched dementia-free control subjects. They found that women with dementia weighed less than the control group starting at least a decade before the onset of dementia and that the difference in weight increased over time, but these findings did not apply to men (Knopman et al., 2007). On the contrary, using data from a sample of Japanese American men in Honolulu, Hawaii, another study found evidence that men who became demented started losing weight at least several years prior to diagnosis (Stewart et al., 2005). In a sample of older French men and women from three cities, Wagner and colleagues contrasted trajectories of BMI between the dementia cases and the dementia-free controls and found that 14 years before diagnosis, BMI was slightly higher for the dementia cases than for the controls, but then the BMI of the cases dropped significantly below that of the controls about two years before diagnosis (Wagner et al., 2018). Previous studies have also shown weight loss among patients with existing dementia (Cronin-Stubbs et al., 1997; Franx et al., 2017; White et al., 1996), but few studies have tracked the trajectory of BMI after incident dementia cases. One study found that BMI leveled off after dementia onset, but did not have a control group (Gu et al., 2014).
Although prior work has made advances in documenting the relationship between weight change and dementia, several limitations are noteworthy. First, most studies were based on ethnically homogenous samples from geographically confined areas or selective populations that limit the external validity of the findings (Mooldijk et al., 2021). For example, Singh-Manoux et al. used the Whitehall II study, which included only British civil servants in London, primarily men (Singh-Manoux et al., 2018). Stewart et al. used a sample of Japanese American men aged 77–98 years in Honolulu (Stewart et al., 2005). Gu et al. used the incident samples with a mean age at the first BMI assessment of about 80 years old (Gu et al., 2014). Despite bearing greater burdens of obesity and dementia, minority ethnic groups, especially African Americans and Hispanics, are rarely included in the study samples. In addition, national data from the US shows that the prevalence of dementia is 3.0%–5.6% for persons aged 67–69 years, and increases to about 11% of those aged 75–79 years (Zhu et al., 2021). Hence, relying on incident cases from an older population results in a highly selective analytic sample. Moreover, studies based on clinical samples are limited by the fact that the factors that bring patients to clinical centers are related to the disease outcome, introducing selection bias (Brayne & Davis, 2012; Schoenmaker & Van Gool, 2004). Taken together, the non-representative and homogenous nature of the samples in prior work limit the generalizability of the findings.
Second, weight change among older adults is common for a variety of reasons, and many studies lack proper controls. For example, Gu et al. examines weight loss after incident dementia diagnosis, but there is no control group, rendering it difficult to ascertain the contribution of age and other factors separately from that of dementia itself on weight change (Gu et al., 2014). Other studies employ a case-control design (Knopman et al., 2007; Wagner et al., 2018), which has well known limitations with respect to the selection of controls (Dohoo et al., 2012).
Third, previous studies, particularly those with long follow-ups, identified dementia based on clinical records, raising the issue of the underascertainment of dementia. There is evidence that a substantial proportion of older adults living with dementia has not been formally diagnosed and that underdiagnosis is geographically and socially patterned (Gianattasio, et al., 2019; Lin et al., 2020). A recent study compared dementia prevalence in older Americans using three different dementia ascertainments/data sources and found that dementia prevalence for African Americans and Hispanics based on diagnosis codes from Medicare claims was only about 50% of the prevalence based on neuropsychological assessments or cognitive tests in population-based surveys (Zhu et al., 2021).
Fourth, many studies used samples in which the prevalence of obesity was far below that in the current American population. In the Whitehall II study, only 10% of participants were obese at age 50 (Singh-Manoux et al., 2018). The sample in the Honolulu-Asia Aging study had an average BMI value below 24, and obesity was uncommon in the sample (Stewart et al., 2005). In contrast, the prevalence of obesity exceeded 42% for Americans aged 60 years and older in 2017–2018 (Hales et al., 2020). Therefore, these studies’ results may not apply to current populations in the United States and the many other countries where obesity is prevalent or rapidly becoming prevalent. Furthermore, the trajectories of BMI may vary depending on the levels of BMI at which weight loss occurred. Due to the low prevalence of obesity, prior work was unable to examine the change in BMI stratified by levels of weight status.
The present study used data from the ongoing US Health and Retirement Study (HRS) to evaluate the time path of BMI before and after incident dementia in older Americans. Compared to prior work, this study contributes to the literature in several important ways. First, we used data from a multiethnic and nationally representative sample of older Americans aged 51 years and older. The HRS oversampled African American and Hispanic populations (Ofstedal & Weir, 2011), providing a racially and ethnically diverse sample of older adults. The representative nature of the sample, together with its wide age range, ensures that the results are less affected by sample selection and survival bias. Second, this study is unique in combining self-respondent surveys and proxy interviews to ascertain dementia. Because cognitive deficits directly affect subjects’ ability to participate, nonresponse and attrition due to cognitive impairment and dementia are likely to introduce bias when assessing dementia risk (Chatfield et al., 2005). To retain impaired older adults in the study sample, the HRS obtained proxy interviews for participants who were unable to respond to the survey, greatly ameliorating the biasing effects of dementia underdiagnosis and cognition-related nonresponse and attrition in our study (Ofstedal & Fisher, 2005; Weir et al., 2011).
Third, this study uses a fixed-effects approach, which effectively eliminates the linear influence of confounding by time-invariant individual characteristics, including education, race/ethnicity, genetic factors, early-life nutrition, and development, as well as environmental factors and some health and behavioral characteristics (Allison, 1994; Gunasekara et al., 2014). Importantly, many of these are related to BMI and dementia (and their determinants) but unmeasured, or difficult to measure, and, therefore, uncontrolled in previous research. We also adjust for important time-varying health and behavioral variables. Fourth, this study employs a flexible modeling strategy on repeated measurements of BMI and cognitive status to capture potential nonlinearity in the time path of BMI change. Finally, we investigated the heterogeneity in the BMI trajectory by initial BMI level, which has not been studied in prior research, with the exception of Gu et al. (2014). In sum, this study brings new evidence regarding the trajectory of BMI before and after dementia among a current multiethnic US population. Results from this study will improve the understanding of the complex interplay between BMI and dementia.
Data and Methods
Sample
To examine the time path of BMI before and after incident dementia, we used the 2000–2016 waves of the HRS. The HRS is an ongoing nationally representative survey of the US population over the age of 50 designed and conducted by the University of Michigan. Since 1992, the HRS has followed respondents longitudinally until death and added younger cohorts every six years to maintain a representative sample (Sonnega et al., 2014). The HRS has played an important role in studies documenting national trends in obesity, cardiovascular health, and dementia in older Americans. Details regarding the HRS survey design and procedures are available from the University of Michigan (http://hrsonline.isr.umich.edu). Our observation window spanned from 2000—the first wave with consistent cognition questions—through 2016. To identify incident dementia, we restricted our analysis to individuals who were dementia-free at the first wave of observation, had at least two cognitive data points, and had complete covariate data, for a final sample size of 47, 362 observations from 15,410 individuals who were age 51 and over at the first wave of observation.
Measures
The BMI for each wave was calculated as weight in kilograms divided by squared height in meters [weight (kg)/height (m2)]. Weight was reported at each wave, and height was reported at the first interview. In this study, we treated BMI as a continuous measurement of weight status. We top-coded the variable at the 99th percentile and bottom-coded the variable at the first percentile for each sex. Dementia at each wave was assessed based on either a respondent- or proxy-based assessment of cognitive status using the Langa-Weir classifications (Crimmins et al., 2011), and incident dementia was based on a change in the cognitive status between two waves. The Langa-Weir approach classifies individuals into three categories based on a summary score of cognitive function for self- and proxy respondents: intact cognition, cognitive impairment without dementia, or dementia. For the self-respondents, cognition was assessed using a battery of tests, including immediate and delayed 10-noun free recall tests to measure memory, a serial subtraction of seven test to measure working memory, and a counting backward test to measure the speed of mental processing. For the proxy respondents, a combination of instrumental activities of daily living, proxy assessment of the subject’s memory, and the interviewer’s assessment of the subject’s cognition was used to assess cognitive function. Because our objective is to examine the relationship between BMI and dementia, the most severe form of cognitive impairment, we adopt a dichotomous approach focusing on dementia compared to not having dementia, which includes intact cognition and cognitive impairment without dementia. The Langa-Weir classification was validated in the HRS Aging, Demographics, and Memory Study and has been widely used in dementia research.
Time-invariant individual-level factors were accounted for by fixed effects. Time-varying covariates include age, chronic diseases, smoking status, and difficulty with eating at each survey wave. For chronic diseases, we assessed hypertension, diabetes, cancer, heart disease, and stroke at each wave based on whether a doctor ever told the respondent that they had the condition. Smoking status was coded as one if the respondent was currently smoking at this wave and zero if the respondent was not currently smoking. Difficulty with eating was coded as one if respondents reported having any difficulty with eating and zero if not.
Analysis
To quantify dementia-associated weight loss, we need to compare BMI trajectories between individuals with and without dementia. In this study, we included individuals with and without dementia to model and compare BMI trajectories controlling for covariates. In this way, the difference in BMI between those with and without dementia could represent the decline that is related to dementia rather than just aging. The analysis of the trajectory of BMI before and after dementia is based on the following linear model that predicts BMI level as a function of a vector of dummy variables that indicate the time distance between incident dementia and each observation wave, as well as time-variant and time-invariant covariates
BMIit denotes BMI level for person i at observation wave t (survey year, in calendar time). Incident dementia can occur at different waves for different individuals. We coded the occurrence of incident dementia as a set of dummy variables Dj, it that measures the time (number of waves) between the current observation wave t and the wave during which incident dementia occurred, including time points before and after incident dementia. The range of j represents the study window that is from a to b. Negative values represent waves prior to an occurrence of incidence dementia, while positive values represent waves after an occurrence. Dj, i, t = 1 if survey year t is j waves before/after incident dementia occurred for individual i; otherwise 0. In the main analysis of the paper, we tracked the trajectory of BMI from five waves (about 10 years) before incident dementia to two waves (four years) after incident dementia. In this case, a = 5, b = +2.
Hence, for each survey year t, we have a set of dummy variables for each individual i:
D −5, i, t = 1 if survey year t is 5 waves before incident dementia occurred, otherwise 0;
D −4, i, t = 1 if survey year t is 4 waves before incident dementia occurred, otherwise 0;
…
D+1, i, t = 1 if survey year t is 1 wave after incident dementia occurred, otherwise 0;
D+2, i, t = 1 if survey year t is 2 waves after incident dementia occurred, otherwise 0.
This approach has been described by Allison (1994) to model the time path of effects after an event has occurred. We extended this approach to further include the time path before the occurrence of an event. βj captures the difference in BMI between those with Dj, it = 1 and those with Dj, it = 0 at every j. The time path of BMI is expressed as the series of βj. This model design permits flexibility in the estimate of the shape of the overall trajectory. ai is individual fixed effects. Many factors can affect the relationship between BMI and dementia (and their determinants), including commonly observed factors such as race/ethnicity and education, but also important unobserved factors such as genetics and underlying behavioral dispositions. Including individual fixed effects (ai) effectively eliminates all time-invariant differences between individuals, regardless of whether they are observed and measured. Fixed effects also address measurement errors in BMI caused by time-invariant individuals’ tendency to misreport weight and height. Xit represents time-variant covariates that are known to affect BMI and dementia at time t, including age, chronic diseases, smoking status, and difficulty with eating. λt is survey year fixed effects. eit is the error term.
In order to model D −5, it, we must have five waves of data available after any given BMIit. Our sample is thus limited to respondents who entered the HRS by 2006, because those who entered after this wave do not have five waves of data available going forward (the data end at 2016). In addition, 5255 respondents did not have 5 subsequent waves of data available for any D −5, it due to death or attrition. The full sample selection process is described in Figure 1.
Figure 1.
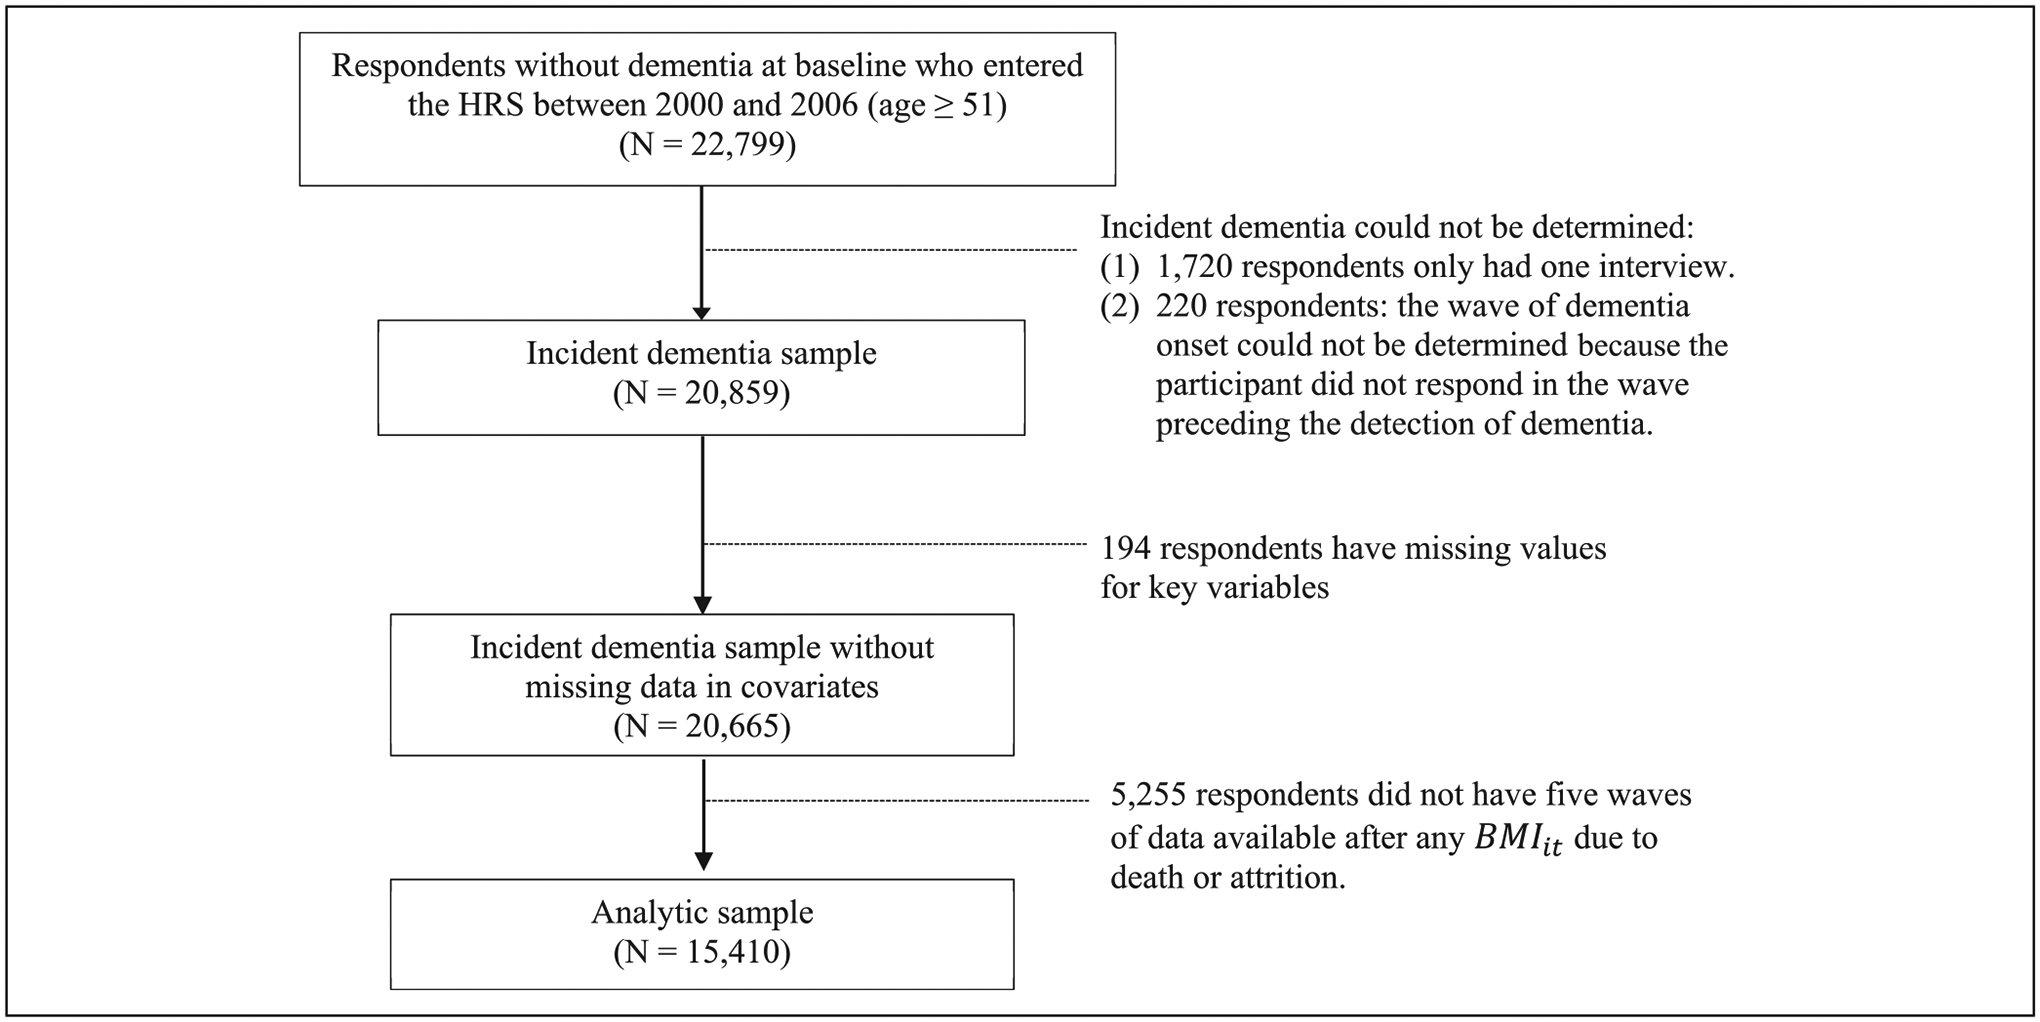
Sample Selection Process.
In the main results, we reported the change in BMI from five waves (about 10 years) preceding incident dementia to two waves (about four years) following incident dementia. We chose this time window because we intended to observe the years before and after incident dementia with an emphasis on the BMI decline before dementia onset, and because the average length of survival after dementia onset is less than six–eight years for older adults (Joling et al., 2020; Wolfson et al., 2001). Estimates of BMI more than six years after incident dementia are, thus, likely to be subject to substantial survival bias. Model 1 controls only for age and survey year fixed effects. We then added disease presence, smoking status, and difficulty with eating at each wave (Model 2) to assess the extent to which the association between dementia and changes in BMI is attributable to ill health, smoking, and eating difficulty. Because of potential gender differences in BMI and dementia risk, we estimated the models separately for men and women. We then estimated the models stratified by initial BMI level to explore the heterogeneity in the BMI trajectory by initial weight status (normal weight: below 25, overweight: 25–29.9, and obese: 30 and above). All analyses were conducted using Stata 17.
Results
Table 1 presents the weighted distribution of sociodemographic characteristics, disease, smoking, difficulty with eating, and BMI at each respondent’s first wave of observation for men and women by dementia status. Among 6,351 men and 9,059 women in the analytic sample, 1,054 men and 1,660 women had incident dementia by the end of the study. For both men and women, the mean age was 61 years for those without incident dementia and above 70 for those with incident dementia. Those without incident dementia had more years of schooling than those with incident dementia. Non-Hispanic Whites are less likely to have incident dementia than non-Hispanic blacks and Hispanics. Chronic diseases are more prevalent among those with dementia. The mean BMI at the first wave of observation was about 28 for both men and women, regardless of whether they had incident dementia during the study period.
Table 1.
Characteristics of Sample at Respondents’ Entry, Health and Retirement Study.
| Men | Women | |||
|---|---|---|---|---|
| Without incident dementia | With incident dementia | Without incident dementia | With incident dementia | |
| Age, mean | 61.27 (7.67) | 70.32 (9.91) | 61.02 (8.05) | 72.27 (10.48) |
| Years of education, mean | 13.16 (3.08) | 10.27 (3.99) | 12.72 (2.78) | 10.37 (3.58) |
| % Non-Hispanic Whites | 78.86 | 65.80 | 74.74 | 60.03 |
| % Non-Hispanic Blacks | 10.73 | 20.66 | 14.74 | 25.00 |
| % Hispanics | 7.98 | 11.96 | 8.32 | 12.84 |
| % Other races/ethnicities | 2.43 | 1.58 | 2.19 | 2.14 |
| % Hypertension | 41.27 | 50.25 | 40.88 | 59.63 |
| % Diabetes | 12.58 | 21.75 | 10.50 | 20.85 |
| % Cancer | 7.34 | 9.96 | 8.67 | 9.85 |
| % Heart Disease | 16.16 | 28.08 | 10.28 | 22.64 |
| % Stroke | 3.35 | 12.34 | 2.64 | 11.25 |
| % Current smoking | 15.73 | 16.38 | 14.01 | 11.78 |
| % Difficulty with eating | .38 | 3.00 | .92 | 4.85 |
| BMI at baseline, mean | 28.61 (4.28) | 27.61 (4.38) | 28.78 (5.66) | 28.05 (5.72) |
| BMI: < 25 | 19.13 | 30.68 | 29.04 | 33.62 |
| BMI: 25.0–29.9 | 48.60 | 43.41 | 34.76 | 34.74 |
| BMI: 30+ | 32.27 | 25.92 | 36.20 | 31.63 |
| N | 5,297 | 1,054 | 7,399 | 1,660 |
Note. Weighted means (standard deviations) and percentages are reported.
Table 2 presents the coefficients of the models predicting repeated measures of BMI. When the model with individual and survey year fixed effects controls only for age (Model 1), BMI is inversely associated with all the dummy variables that indicate the time distance between each observation wave and incident dementia. For example, for men, the coefficients for the time indicator of 10, 8, 6, 4, 2 years before incident dementia are −.29, −.39, −.62, −.82, and −1.17, respectively, and are statistically significant. This means that BMI for someone 10 years prior to incident dementia is .29 less than for those without dementia, and this difference increases to 1.17 in two years preceding incident dementia, and 1.75 by the wave of incident dementia. By four years after incident dementia this differential has increased to 2.46 BMI units. These coefficients indicate that a continuous decline in BMI starts at least about 10 years (i.e., five waves) prior to incident dementia and continues as dementia progresses. Note that the decrease in BMI is especially prominent during the years immediately preceding incident dementia and accelerates after incident dementia. We tested the significance of the difference in estimates from adjacent years (displayed at the bottom panel of Table 2). We find that the decline in BMI is significant for both men and women at almost all years. Controlling for disease presence, smoking status, and eating difficulty does not change the pattern in a meaningful way (Model 2), indicating that chronic diseases, smoking, and eating disability are unlikely to explain the observed decline in BMI along the dementia course. The difference between estimates for men vs. women is also displayed in Table 2, along with significance testing based on fully interacted models. Here, we find that women experience a significantly larger decline from four years before dementia onset until dementia onset. The direction of the associations between BMI and the other time-varying covariates are in line with our expectations.
Table 2.
Fixed Effects Estimates From Linear Models Predicting Body Mass Index Before and After Incident Dementia.
| Model 1 | Model 2 | |||||
|---|---|---|---|---|---|---|
| Men [1] | Women [2] | Difference [2]−[1] | Men [1] | Women [2] | Difference [2]−[1] | |
| Pre-incident dementia | ||||||
| 10 years (5 waves) | −.29*** [.09] | −.27*** [.08] | .02 [.12] | −.27** [.09] | −.27** [.08] | .00 [.12] |
| 8 years (4 waves) | −.39*** [.12] | −.46*** [.11] | −.07 [.16] | −.37** [.12] | −.44*** [.11] | −.07 [.16] |
| 6 years (3 waves) | −.62*** [.14] | −.96*** [.13] | −.34 [.20] | −.58*** [.14] | −.93*** [.13] | −.35 [.19] |
| 4 years (2 waves) | −.82*** [.16] | −1.30*** [.16] | −.48* [.23] | −.76*** [.16] | −1.26*** [.16] | −.50* [.23] |
| 2 years (1 wave) | −1.17*** [.19] | −1.78*** [.18] | −.61* [.26] | −1.09*** [.19] | −1.71*** [.18] | −.62* [.26] |
| Wave of incident dementia | −1.75*** [.21] | −2.46*** [.21] | −.71* [.30] | −1.60*** [.21] | −2.30*** [.21] | −.70* [.30] |
| Post-incident dementia | ||||||
| 2 years (1 wave) | −2.12*** [.26] | −2.77*** [.25] | −.65 [.36] | −1.94*** [.26] | −2.53*** [.25] | −.59 [.36] |
| 4 years (2 waves) | −2.46*** [.36] | −3.28*** [.33] | −.82 [.49] | −2.21*** [.36] | −2.99*** [.34] | −.78 [.49] |
| Age | −.13** [.04] | −.02 [.04] | .11 [.06] | −.13*** [.04] | −.01 [.04] | .12 [.06] |
| Hypertension | .04 [.08] | −.03 [.07] | −.07 [.11] | |||
| Diabetes | −.38*** [.11] | −.34* [.12] | .04 [.17] | |||
| Cancer | .06 [.13] | −.20 [.16] | −.26 [.21] | |||
| Heart Disease | −.14 [.10] | −.05 [.12] | .09 [.15] | |||
| Stroke | −.33* [.16] | −.54** [.20] | −.21 [.25] | |||
| Current smoking status | −.82*** [.11] | −.66*** [.12] | .16 [.17] | |||
| Difficulty with eating | −.40* [.19] | −.50** [.15] | −.10 [.24] | |||
| Number of person-waves | 19,102 | 28,260 | 19,102 | 28,260 | ||
| Number of persons | 6,351 | 9,059 | 6,351 | 9,059 | ||
| F tests (p values) | ||||||
| −10 years = −8 years | .213 | .032 | .220 | .046 | ||
| −8 years = −6 years | .012 | <.001 | .027 | <.001 | ||
| −6 years = −4 years | .050 | <.001 | .062 | <.001 | ||
| −4 years = −2 years | <.001 | <.001 | .001 | <.001 | ||
| −2 years = 0 year | <.001 | <.001 | <.001 | <.001 | ||
| 0 year = +2 years | .027 | .055 | .046 | .144 | ||
| +2 years = +4 years | .261 | .058 | .356 | .093 | ||
Notes. Regression coefficients and robust [standard errors] are reported. Individual and survey year fixed effects are included in all models. Significance:
p < .1,
p < .05,
p < .01,
p < .001
To assess heterogeneity in the BMI trend by initial BMI, we stratified the sample by baseline BMI level: normal weight, overweight, and obesity. Results from models controlling for individual and survey year fixed effects, time-varying age, disease presence, smoking status, and eating difficulty are reported in Table 3. The stratified analyses revealed evidence that the extent of BMI decline is associated with baseline BMI level and the results are displayed in graphical form in Figure 2. In general, all groups experienced a continuous decline in BMI before and after incident dementia. However, for both men and women, those who were obese at the baseline experienced a larger decline in BMI over time, whereas those with a normal BMI at the baseline had some decline in BMI, but to a much lesser extent. We tested for the significance of these differences in BMI decline based on fully interacted models [Table 3]. Due to relatively small sample size and large standard errors for each BMI group within gender, the extent of BMI decline among those overweight or obese at baseline only became significantly greater than that among those with normal weight from the wave of incident dementia for men. For women, significant differences between those with normal weight and the obese were observed starting at about six to eight years before incident dementia. The gradient in the extent of BMI decline by the baseline BMI level is more pronounced among women [Figure 2]. We also conducted an exploratory race-stratified analysis but found we do not have sufficient power to detect significant race/ethnic differences.
Table 3.
Fixed Effects Estimates From Linear Models Predicting Body Mass Index Before and After Incident Dementia by Baseline BMI Level.
| Men | Women | |||||||||
|---|---|---|---|---|---|---|---|---|---|---|
| BMI<25 | 25 ≤BMI <30 | BMI ≥30 | Difference | BMI<25 | 25 ≤BMI <30 | BMI ≥30 | Difference | |||
| [1] | [2] | [3] | [2] – [1] | [3] – [1] | [1] | [2] | [3] | [2] – [1] | [3] – [1] | |
| Pre-incident dementia | ||||||||||
| 10 years (5 waves) | −.05 [.16] | −.33** [.11] | −.43 [.25] | −.28 [.19] | −.38 [.29] | −.24* [.11] | −.44*** [.14] | −.12 [.20] | −.20 [.18] | .12 [.23] |
| 8 years (4 waves) | −.25 [.19] | −.40** [.15] | −.48 [.30] | −.15 [.24] | −.23 [.36] | −.30* [.13] | −.33† [.18] | −.78** [.25] | −.03 [.23] | −.48† [.29] |
| 6 years (3 waves) | −.46* [.20] | −.52** [.19] | 1.01 * [.42] | −.06 [.27] | −.55 [.47] | −.61*** [.15] | −.99*** [.21] | −1.35*** [.32] | −.38 [.26] | −.74* [.36] |
| 4 years (2 waves) | −.46† [.23] | −.86*** [.22] | −1.17* [.45] | −.40 [.32] | −.71 [.51] | −.90*** [.18] | −1.13*** [.26] | −2.01*** [.38] | −.23 [.31] | −1.11** [.42] |
| 2 years (1 wave) | −.69* [.27] | −1.28*** [.25] | −1.53** [.52] | −.59 [.37] | −.84 [.59] | −1.16*** [.20] | −1.86*** [.29] | −2.37*** [.46] | −.70* [.35] | −1.21* [.50] |
| Wave of incident dementia | −1.00** [.30] | −1.96*** [.28] | −2.13*** [.61] | −.96* [.42] | −1.13† [.68] | −1.62*** [.24] | −2.33*** [.34] | −3.55*** [.54] | −.70† [.41] | −1.93** [.59] |
| Post-incident dementia | ||||||||||
| 2 years (1 wave) | −1.07** [.36] | −2.25*** [.36] | −2.95** [.74] | −1.18* [.51] | −1.88* [.82] | −1.63*** [.28] | −2.56*** [.41] | −4.21*** [.63] | −.93† [.49] | −2.58*** [.69] |
| 4 years (2 waves) | −.67 [.52] | −2.83*** [.49] | −3.44** [.91] | −2.16** [.71] | −2.77** [1.05] | −1.90*** [.46] | −2.82*** [.56] | −4.89*** [.74] | −.92 [.72] | −2.99*** [.87] |
| Age | −.11 [.07] | −.12* [.05] | −.18 [.11] | −.01 [.08] | −.07 [.13] | −.03 [.05] | −.01 [.06] | −.06 [.10] | .02 [.08] | −.03 [.11] |
| Hypertension | .08 [.14] | .01 [.11] | .01 [.19] | −.07 [.18] | −.07 [.23] | −.03 [.09] | −.01 [.10] | −.09 [.20] | .02 [.13] | −.06 [.22] |
| Diabetes | −.24 [.28] | −.27 [.15] | −.35 [.19] | −.03 [.32] | −.11 [.34] | −.07 [.23] | −.20 [.19] | −.34 [.21] | −.13 [.30] | −.27 [.31] |
| Cancer | .14 [.15] | .18 [.17] | −.26 [.33] | .04 [.23] | −.40 [.37] | −.08 [.20] | −.11 [.24] | −.69 [.45] | −.03 [.31] | −.61 [.49] |
| Heart Disease | −.05 [.17] | −.25* [.13] | .07 [.23] | −.20 [.21] | .12 [.28] | .11 [.15] | −.25 [.18] | .09 [.28] | −.36 [.24] | −.02 [.32] |
| Stroke | .05 [.21] | −.68** [.22] | −.13 [.40] | −.73* [.30] | −.18 [.45] | .06 [.18] | −.82** [.28] | −1.19* [.59] | −.88** [.33] | −1.25* [.62] |
| Current smoking status | −.77*** [.15] | −.74*** [.17] | −.93*** [.26] | .03 [.22] | −.16 [.31] | −.74*** [.16] | −.55** [.20] | −.62* [.30] | .19 [.26] | .12 [.34] |
| Difficulty with eating | −.27 [.24] | −.35 [.29] | −.82 [.47] | −.08 [.38] | −.55 [.53] | −.12 [.19] | −.81*** [.24] | −.94** [.36] | −.69* [.31] | −.82* [.41] |
| Number of person-waves | 4,783 | 9,421 | 4,898 | 10.481 | 10,079 | 7,700 | ||||
| Number of persons | 1,602 | 3,109 | 1,640 | 3,331 | 3,174 | 2,554 | ||||
Notes. Regression coefficients and robust [standard errors] are reported. Individual and survey year fixed effects are included in all models. Significance:
p < .1,
p < .05,
p < .01,
p < .001
Figure 2.
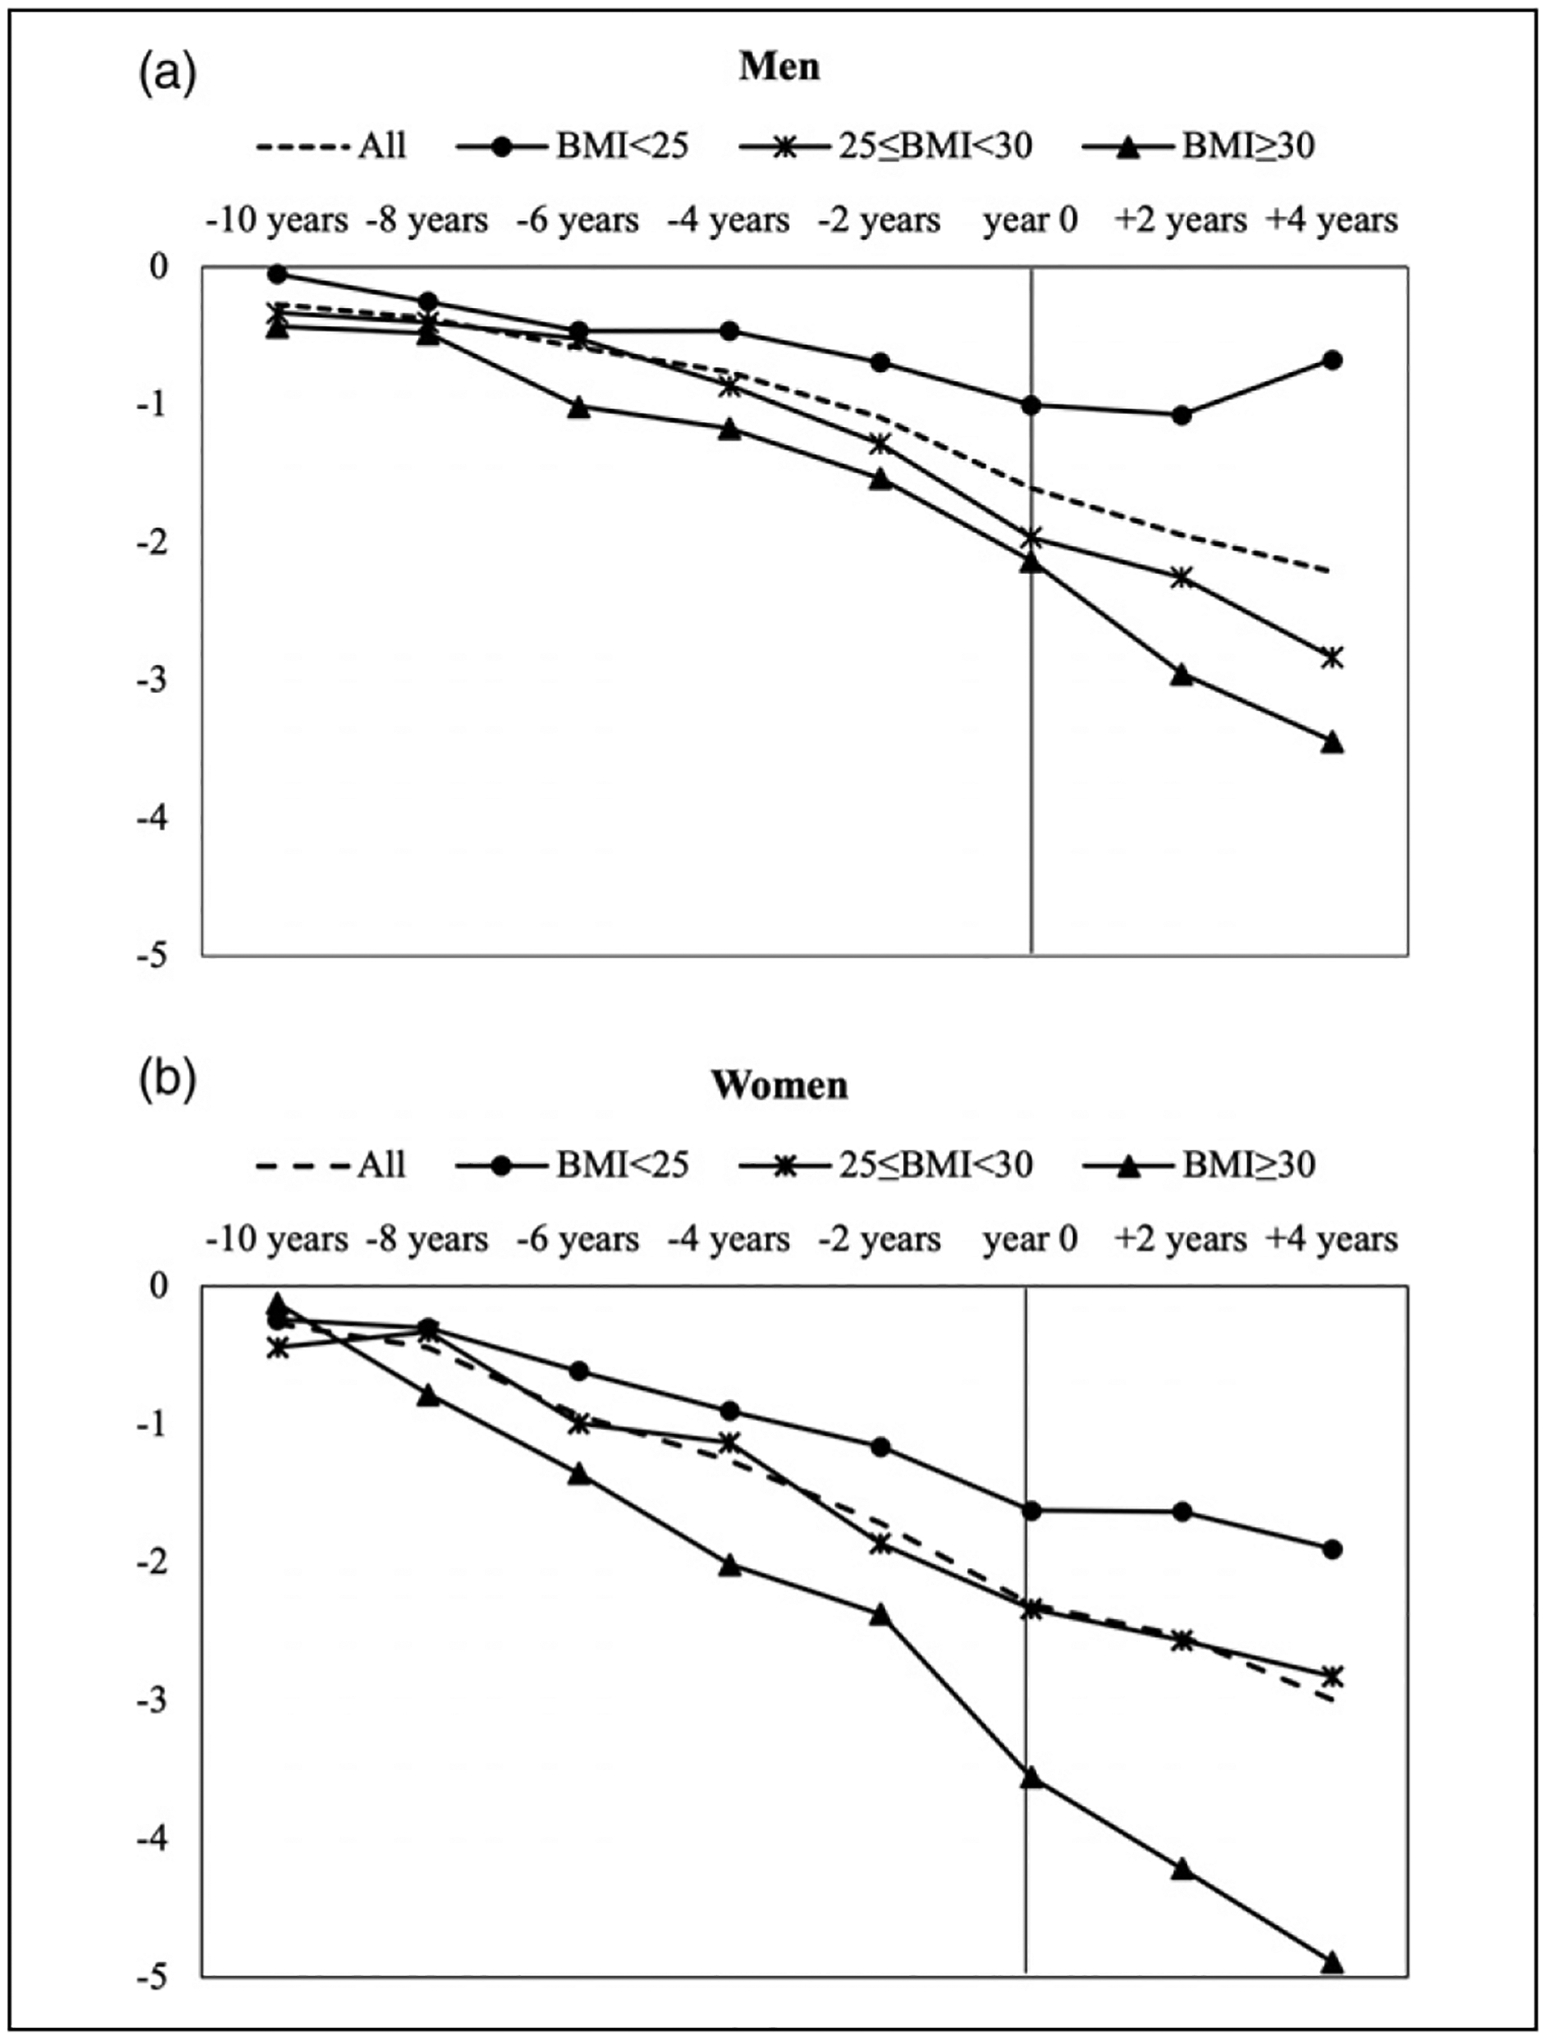
Changes in BMI Before and After Incident Dementia.
Conclusion and Discussion
Leveraging 16 years of data from an ongoing nationally representative study where physical and cognitive health are assessed every two years, we employed a flexible model design and found a nonlinear decline of BMI before and after incident dementia. Weight loss begins at least 10 years before diagnosis, accelerates about two to four years immediately preceding dementia onset, and continues after incident dementia, showing that weight loss is a potential marker of incipient dementia. Several potential mechanisms linking dementia and weight loss are possible. The causal links are likely to be bidirectional. Weight loss could be an early manifestation of dementia, as ongoing dementia-related pathophysiologic changes can cause weight loss due to loss of appetite, pain, and/or high energy expenditure caused by increased physical activity (e.g., excessive pacing) or increased energy needs (Cerejeira et al., 2012; Franx et al., 2017; Poehlman & Dvorak, 2000). Further, weight loss may accelerate dementia process. For instance, leptin, a hormone secreted primarily by adipocytes, seems to be implicated in cognitive decline and the dementia process. Some studies have shown that higher leptin levels are associated with slower cognitive decline through possible mechanisms including modulation of synaptic plasticity and clearance of beta amyloid (Holden et al., 2009; Zeki Al Hazzouri et al., 2012). Therefore, reduced leptin due to weight loss could contribute to the cognitive impairment and dementia process. Although the underlying mechanisms are complex and out of the scope of this paper, our findings clearly show that weight loss appears to begin long before the symptoms of dementia, and unintentional weight loss should be considered a potential early warning sign for the development of dementia. These findings could help prompt the early evaluation and diagnosis of dementia and facilitate access to care and treatment.
Few studies have examined gender-specific patterns in this area (Knopman et al., 2007). In our study, we observed weight loss in both men and women before and after incident dementia, and the magnitude of weight loss was greater in women than in men. Although the basis for the gender difference is unclear and no plausible hypothesis for this observation can be addressed with the available data, it may be attributable to one or a combination of factors: (1) men with dementia lose less weight than women with dementia, and/or (2) men without dementia tend to lose more weight than women without dementia. Additionally, we investigated heterogeneity in the BMI trajectory by initial BMI level, which revealed a more nuanced picture. The extent of BMI decline during the course of dementia development seems to relate to the initial BMI level such that those with a higher level of obesity at baseline had a BMI decline to a much greater extent than those with a normal weight. These findings highlight the importance of weight monitoring in all older adults. Among those with a normal weight, relatively small weight loss could be an early warning sign of dementia, whereas even among those with higher levels of obesity, weight loss deserves attention.
Rising obesity rates have elicited serious concerns over obesity as a risk factor for developing dementia in an aging population. Weight loss in the long incubation period of dementia may be one of the important explanations for the changing relationship between obesity and dementia risk depending on the age at which BMI is measured. Furthermore, the gradients in the extent of BMI decline by initial BMI offer possible explanations for the inconsistent findings from the studies conducted at very different times and focused on populations and subpopulations with different levels of BMI. Weight loss, especially the relatively rapid weight loss among individuals with higher BMI, complicates efforts to pinpoint the consequences of excess weight on dementia. If individuals with higher initial BMI have a higher risk of becoming demented but experience greater weight loss starting long before dementia onset, then those with dementia may have lower BMI than those without dementia at a subsequent time point. Ultimately, the true risk of dementia conferred by obesity could be attenuated or even reversed in old age. Our study suggests that identifying whether obesity is a risk factor for dementia is challenging and ideally requires data on BMI more than 10 years before incident dementia occurs. Our results are robust to a number of sensitivity analyses including using the random-effects approach and excluding extreme fixed effects outliers.
To assess the roles of unintentional weight loss due to illness, smoking, and having difficulty eating, we controlled for diagnosed conditions, smoking status, and eating disability over time. The observed BMI change before and after incident dementia was largely unchanged. This result is consistent with other research which found that vascular diseases and functional impairment do not account for the extent of weight loss observed over the course of dementia (Stewart et al., 2005). This suggests that other unmeasured factors associated with dementia progression, such as metabolic aberration and anorexia, may be responsible for weight loss. However, it is crucial to bear in mind that no conclusions can be drawn about causality from our study. Instead of elucidating pathways and mechanisms by which dementia causes weight loss or weight loss aggravates the pathogenic process that mediates dementia, our aim was to describe the dynamic change of BMI in relation to the onset and progression of dementia. It also remains unclear whether obesity and weight loss are risk factors or manifestations of impending dementia.
We note several limitations of our research. First, it may be speculated that measurement errors in self-reported weight could contaminate our results. Low cognitive function and dementia could affect the reliability of self-reported weight. If subjects with low cognition or dementia underreported their weight to a greater extent than those of intact cognition, our results might have overestimated the decline in BMI. In our analysis, we cannot use measured weight because the HRS only started measuring weight in 2006, on a half sample of self-respondents in each wave. Thus, measured weight is only available after 2006 for the entire sample every four years. Notwithstanding, we can investigate the measurement error in self-reported weight by comparing the available self-reported and measured weight in the HRS from 2006 to 2016. As shown in Supplemental Table S1, regardless of gender, almost all groups underreported their weight. Notably, those with normal cognitive function underreported weight to a greater degree than those with cognitive impairment and dementia. This evidence suggests that it is unlikely that we overestimated the decline of BMI because of potential measurement errors in reported BMI among those with dementia. If anything, our estimates may be biased toward the null, which means that the decline could be even more substantial if measured weight data were used in the analysis. In addition, misreporting related to the time-invariant individual-level characteristics has been taken into account by including fixed effects in our models.
Second, correctly identifying incident dementia is challenging because dementia onset is typically not the result of a dramatic change but rather marks passing a threshold on a continuum of the cognitive scale. The HRS core lacks a direct measure of dementia status because a clinical assessment for dementia is expensive and currently not practical in a large longitudinal survey like the HRS. An alternative and feasible approach is to use an index of cognitive ability based on HRS survey measures and apply a cutoff point whereby individuals whose index value falls below the cutoff are deemed to have dementia. The cutoff approach is imperfect as it can produce false positives and false negatives, but it is nonetheless a simple and transparent research design that is commonly used in dementia research. In the HRS, several methods have been developed to classify dementia status algorithmically, as the HRS’s Aging, Demographics, and Memory Study contains a clinical diagnosis of dementia, providing a good setting for algorithm development. Two other methods for dementia ascertainment in the HRS are available, but both are only for the population aged 70 years and older (Gianattasio et al., 2019; Hurd et al., 2013). Prior research has compared different methods for algorithmic classification of dementia status in the HRS (e.g., Gianattasio et al., 2019). Although no method is perfect, the overall accuracy of these methods is similar. Langa-Weir classifications are straightforward, have high sensitivity in differentiating dementia from cognitively intact status, and are available for all respondents. Additionally, some recent research has suggested a reduction in the severity of neurocognitive disorders among those with dementia (Akushevich, et al., 2018). However, if such a reduction is indeed the case, then Langa-Weir classifications may miss some dementia cases because those participants may have only mild symptoms. Misclassifying dementia cases and assigning them to the no dementia group (the control group in this study, all D = 0) would bias our results towards null.
Third, our results may be subject to right-censored bias and mortality bias. To track BMI trajectories starting from five waves before incident dementia, we need to have five waves of data available after any given BMI observation for person i at time t in the model. If persons with dementia are less likely to have a sufficient number of waves due to death or attrition, our estimates are likely biased towards the null. The ideal data to examine the time path of BMI and dementia would be a nationally representative sample of people where we could observe their dementia status and BMI for long periods of time starting at a reasonably young age with no attrition and no inter-wave non-participation. Such an ideal dataset, however, does not exist. We re-ran the analysis based on alternate study time windows as sensitivity analyses. Although the absolute differences vary depending on the sample, the pattern of the BMI trajectories does not change. Our findings still hold. Additionally, bias due to mortality is an important consideration in longitudinal studies of older adults. As weight loss is associated with increased mortality, mortality can obscure or exaggerate the relationship between weight loss and dementia, so we limited the study window to four years after incident dementia so that the results reflecting weight loss after onset are less affected by mortality. Nevertheless, estimates of BMI at two years and four years after incident dementia are likely to be affected to some degree by survival bias. However, because those with dementia have a greater mortality risk than those without dementia and those who died would be expected to have the most severe weight loss, the observed BMI decline after dementia is likely to be biased towards null because only survivors are included in the analysis.
Despite the limitations, our findings have important implications. Understanding the longitudinal interrelationship between obesity and dementia over time is paramount to investigating the risk of dementia conferred by excess weight and helps to clarify the varied and inconsistent findings between prior studies. This study rigorously examined the dynamic change of BMI along the evolution of dementia in a nationally representative sample of current older Americans. Our study reveals that weight loss begins at least 10 years before incident dementia, accelerates in the years immediately preceding incident dementia, and continues after incident dementia. Recognizing continuous weight loss as a vital warning sign for dementia progression can help promote early diagnosis and subsequent access to services, support, and interventions, which can be crucial for delaying institutionalization, maintaining quality of life, improving the health and well-being of caregivers and family, and reducing the cost of long term care for the health care system (Robinson et al., 2015; Weimer & Sager, 2009). The complicated dynamics between obesity and dementia over the long term highlight the complexity of identifying risk and protective factors for dementia and the challenge of understanding of the burden of obesity across the life course on dementia.
Supplementary Material
Funding
The author(s) disclosed receipt of the following financial support for the research, authorship, and/or publication of this article: This work was supported by the National Institute on Aging of the National Institute of Health (K99 AG070274 and P30 AG066615) and the Eunice Kennedy Shriver National Institute of Child Health and Human Development of the National Institutes of Health T32 HD091058.
Footnotes
Declaration of conflicting interests
The author(s) declared no potential conflicts of interest with respect to the research, authorship, and/or publication of this article.
Supplemental Material
Supplemental material for this article is available online.
References
- Akushevich I, Yashkin AP, Kravchenko J, Ukraintseva S, Stallard E, & Yashin AI (2018). Time trends in the prevalence of neurocognitive disorders and cognitive impairment in the United States: The effects of disease severity and improved ascertainment. Journal of Alzheimer’s Disease, 64(1), 137–148. [DOI] [PMC free article] [PubMed] [Google Scholar]
- Allison PD (1994). Using panel data to estimate the effects of events. Sociological Methods & Research, 23(2), 174–199. 10.1177/0049124194023002002 [DOI] [Google Scholar]
- Aziz NA, van der Marck MA, Pijl H, Olde Rikkert MGM, Bloem BR, & Roos RAC (2008). Weight loss in neurodegenerative disorders. Journal of Neurology, 255(12), 1872–1880. 10.1007/s00415-009-0062-8 [DOI] [PubMed] [Google Scholar]
- Brayne C, & Davis D (2012). Making Alzheimer’s and dementia research fit for populations. Lancet (London, England), 380(9851), 1441–1443. 10.1016/S0140-6736(12)61803-0 [DOI] [PMC free article] [PubMed] [Google Scholar]
- Buchman AS, Wilson RS, Bienias JL, Shah RC, Evans DA, & Bennett DA (2005). Change in body mass index and risk of incident Alzheimer disease. Neurology, 65(6), 892–897. 10.1212/01.wnl.0000176061.33817.90 [DOI] [PubMed] [Google Scholar]
- Cerejeira J, Lagarto L, & Mukaetova-Ladinska EB (2012). Behavioral and psychological symptoms of dementia. Frontiers in Neurology, 3, 73. 10.3389/fneur.2012.00073 [DOI] [PMC free article] [PubMed] [Google Scholar]
- Chatfield MD, Brayne CE, & Matthews FE (2005). A systematic literature review of attrition between waves in longitudinal studies in the elderly shows a consistent pattern of dropout between differing studies. Journal of Clinical Epidemiology, 58(1), 13–19. 10.1016/j.jclinepi.2004.05.006 [DOI] [PubMed] [Google Scholar]
- Crimmins EM, Kim JK, Langa KM, & Weir DR (2011). Assessment of cognition using surveys and neuropsychological assessment: The health and retirement study and the aging, Demographics, and memory study. The Journals of Gerontology. Series B, Psychological Sciences and Social Sciences, 66(Suppl 1), i162–i171. 10.1093/geronb/gbr048 [DOI] [PMC free article] [PubMed] [Google Scholar]
- Cronin-Stubbs D, Beckett LA, Scherr PA, Field TS, Chown MJ, Pilgrim DM, Bennett DA, Evans DA, & Evans DA (1997). Weight loss in people with alzheimer’s disease: A prospective population based analysis. BMJ (Clinical Research Ed.), 314(7075), 178–179. 10.1136/bmj.314.7075.178 [DOI] [PMC free article] [PubMed] [Google Scholar]
- Dahl AK, & Hassing LB (2013). Obesity and cognitive aging. Epidemiologic Reviews, 35, 22–32. 10.1093/epirev/mxs002 [DOI] [PubMed] [Google Scholar]
- Dahl AK, Löppönen M, Isoaho R, Berg S, & Kivelä S-L (2008). Overweight and obesity in old age are not associated with greater dementia risk. Journal of the American Geriatrics Society, 56(12), 2261–2266. 10.1111/j.1532-5415.2008.01958.x [DOI] [PubMed] [Google Scholar]
- Dohoo I, Martin W, & Stryhn H (2012). Methods in epidemiologic research. In Charlottetown, prince edward island (2012th ed., p. 890). VER Inc. [Google Scholar]
- Fitzpatrick AL, Kuller LH, Lopez OL, Diehr P, O’Meara ES, Longstreth WT, & Luchsinger JA (2009). Midlife and late-life obesity and the risk of dementia: Cardiovascular health study. Archives of Neurology, 66(3), 336–342. 10.1001/archneurol.2008.582 [DOI] [PMC free article] [PubMed] [Google Scholar]
- Franx BAA, Arnoldussen IAC, Kiliaan AJ, & Gustafson DR (2017). Weight loss in patients with dementia: Considering the potential impact of pharmacotherapy. Drugs & Aging, 34(6), 425–436. 10.1007/s40266-017-0462-x [DOI] [PMC free article] [PubMed] [Google Scholar]
- Gianattasio KZ, Prather C, Glymour MM, Ciarleglio A, & Power MC (2019a). Racial disparities and temporal trends in dementia misdiagnosis risk in the United States. Alzheimer’s & Dementia (New York, N. Y.), 5, 891–898. 10.1016/j.trci.2019.11.008 [DOI] [PMC free article] [PubMed] [Google Scholar]
- Gianattasio KZ, Wu Q, Glymour MM, & Power MC (2019b). Comparison of methods for algorithmic classification of dementia status in the health and retirement study. Epidemiology, 30(2), 291–302. 10.1097/EDE.0000000000000945 [DOI] [PMC free article] [PubMed] [Google Scholar]
- Gu Y, Scarmeas N, Cosentino S, Brandt J, Albert M, Blacker D, Dubois B, & Stern Y (2014). Change in body mass index before and after Alzheimer’s disease onset. Current Alzheimer Research, 11(4), 349–356. 10.2174/1567205010666131120110930 [DOI] [PMC free article] [PubMed] [Google Scholar]
- Gunasekara FI, Richardson K, Carter K, & Blakely T (2014). Fixed effects analysis of repeated measures data. International Journal of Epidemiology, 43(1), 264–269. 10.1093/ije/dyt221 [DOI] [PubMed] [Google Scholar]
- Hales CM, Carroll MD, Fryar CD, & Ogden CL (2020). Prevalence of obesity and severe obesity among adults: United States, 2017–2018. NCHS Data Brief, 1(360), 1–8. [PubMed] [Google Scholar]
- Hassing LB, Dahl AK, Thorvaldsson V, Berg S, Gatz M, Pedersen NL, & Johansson B (2009). Overweight in midlife and risk of dementia: A 40-year follow-up study. International Journal of Obesity, 33(8), 893–898. 10.1038/ijo.2009.104 [DOI] [PMC free article] [PubMed] [Google Scholar]
- Holden KF, Lindquist K, Tylavsky FA, Rosano C, Harris TB, & Yaffe K Health ABC studystudy. (2009). Serum leptin level and cognition in the elderly: Findings from the Health ABC Study. Neurobiology of Aging, 30(9), 1483–1489. 10.1016/j.neurobiolaging.2007.11.024 [DOI] [PMC free article] [PubMed] [Google Scholar]
- Hurd MD, Martorell P, Delavande A, Mullen KJ, & Langa KM (2013). Monetary costs of dementia in the United States. The New England Journal of Medicine, 368(14), 1326–1334. 10.1056/NEJMsa1204629 [DOI] [PMC free article] [PubMed] [Google Scholar]
- Joling KJ, Janssen O, Francke AL, Verheij RA, Lissenberg-Witte BI, Visser P-J, & van Hout HPJ (2020). Time from diagnosis to institutionalization and death in people with dementia. Alzheimer’s & Dementia: The Journal of the Alzheimer’s Association, 16(4), 662–671. 10.1002/alz.12063 [DOI] [PMC free article] [PubMed] [Google Scholar]
- Knopman DS, Edland SD, Cha RH, Petersen RC, & Rocca WA (2007). Incident dementia in women is preceded by weight loss by at least a decade. Neurology, 69(8), 739–746. 10.1212/01.wnl.0000267661.65586.33 [DOI] [PubMed] [Google Scholar]
- Li J, Joshi P, Ang TFA, Liu C, Auerbach S, Devine S, & Au R (2021). Mid- to late-life body mass index and dementia risk: 38 Years of follow-up of the framingham study. American Journal of Epidemiology, 190(12), 2503–2510. 10.1093/aje/kwab096 [DOI] [PMC free article] [PubMed] [Google Scholar]
- Lin P, Cohen JT, Neumann PJ, Cohen JT, Neumann PJ, Faul JD, & Freund KM (2020). Preparing the health-care system to pay for new Alzheimer’s drugs. Alzheimer’s & Dementia: The Journal of the Alzheimer’s Association, 16(11), 1568–1570. 10.1002/alz.12155 [DOI] [PMC free article] [PubMed] [Google Scholar]
- Luchsinger JA, Patel B, Tang M-X, Schupf N, & Mayeux R (2007). Measures of adiposity and dementia risk in elderly persons. Archives of Neurology, 64(3), 392–398. 10.1001/archneur.64.3.392 [DOI] [PMC free article] [PubMed] [Google Scholar]
- Mooldijk SS, Licher S, & Wolters FJ (2021). Characterizing demographic, racial, and geographic diversity in dementia research: A systematic review. JAMA Neurology, 78(10), 1255–1261. 10.1001/jamaneurol.2021.2943 [DOI] [PubMed] [Google Scholar]
- Ofstedal MB, & Fisher G (2005). Documentation of cognitive functioning measures in the health and retirement study. Institute for Social Research, University of Michigan. [Google Scholar]
- Ofstedal MB, & Weir DR (2011). Recruitment and retention of minority participants in the health and retirement study. The Gerontologist, 51(Suppl 1), S8–S20. 10.1093/geront/gnq100 [DOI] [PMC free article] [PubMed] [Google Scholar]
- Pedditzi E, Peters R, & Beckett N (2016). The risk of overweight/obesity in mid-life and late life for the development of dementia: A systematic review and meta-analysis of longitudinal studies. Age and Ageing, 45(1), 14–21. 10.1093/ageing/afv151 [DOI] [PubMed] [Google Scholar]
- Poehlman ET, & Dvorak RV (2000). Energy expenditure, energy intake, and weight loss in Alzheimer disease. The American Journal of Clinical Nutrition, 71(2), 650S–655S. 10.1093/ajcn/71.2.650s [DOI] [PubMed] [Google Scholar]
- Power BD, Alfonso H, Flicker L, Hankey GJ, Yeap BB, & Almeida OP (2013). Changes in body mass in later life and incident dementia. International Psychogeriatrics, 25(3), 467–478. 10.1017/S1041610212001834 [DOI] [PubMed] [Google Scholar]
- Qizilbash N, Gregson J, Johnson ME, Pearce N, Douglas I, Wing K, Evans SJW, Pocock SJ, & Pocock SJ (2015). BMI and risk of dementia in two million people over two decades: A retrospective cohort study. The Lancet. Diabetes & Endocrinology, 3(6), 431–436. 10.1016/S2213-8587(15)00033-9 [DOI] [PubMed] [Google Scholar]
- Robinson L, Tang E, & Taylor J-P (2015). Dementia: Timely diagnosis and early intervention. BMJ (Clinical Research Ed.), 350, h3029. 10.1136/bmj.h3029 [DOI] [PMC free article] [PubMed] [Google Scholar]
- Schoenmaker N, & Van Gool WA (2004). The age gap between patients in clinical studies and in the general population: A pitfall for dementia research. The Lancet. Neurology, 3(10), 627–630. 10.1016/S1474-4422(04)00884-1 [DOI] [PubMed] [Google Scholar]
- Singh-Manoux A, Dugravot A, Shipley M, Brunner EJ, Elbaz A, Sabia S, & Kivimaki M (2018). Obesity trajectories and risk of dementia: 28 years of follow-up in the Whitehall II study. Alzheimer’s & Dementia: The Journal of the Alzheimer’s Association, 14(2), 178–186. 10.1016/j.jalz.2017.06.2637 [DOI] [PMC free article] [PubMed] [Google Scholar]
- Sonnega A, Faul JD, Ofstedal MB, Langa KM, Phillips JWR, & Weir DR (2014). Cohort profile: The health and retirement study (HRS). International Journal of Epidemiology, 43(2), 576–585. 10.1093/ije/dyu067 [DOI] [PMC free article] [PubMed] [Google Scholar]
- Stewart R, Masaki K, Xue Q-L, Peila R, Petrovitch H, White LR, & Launer LJ (2005). A 32-year prospective study of change in body weight and incident dementia: The honolulu-asia aging study. Archives of Neurology, 62(1), 55–60. 10.1001/archneur.62.1.55 [DOI] [PubMed] [Google Scholar]
- Tolppanen A-M, Ngandu T, Kåreholt I, Laatikainen T, Rusanen M, Soininen H, & Kivipelto M (2014). Midlife and late-life body mass index and late-life dementia: Results from a prospective population-based cohort. Journal of Alzheimer’s Disease: JAD, 38(1), 201–209. 10.3233/JAD-130698 [DOI] [PubMed] [Google Scholar]
- Wagner M, Helmer C, Tzourio C, Berr C, Proust-Lima C, & Samieri C (2018). Evaluation of the concurrent trajectories of cardiometabolic risk factors in the 14 years before dementia. JAMA Psychiatry, 75(10), 1033–1042. 10.1001/jamapsychiatry.2018.2004 [DOI] [PMC free article] [PubMed] [Google Scholar]
- Weimer DL, & Sager MA (2009). Early identification and treatment of alzheimer’s disease: Social and fiscal outcomes. Alzheimer’s & Dementia: The Journal of the Alzheimer’s Association, 5(3), 215–226. 10.1016/j.jalz.2009.01.028 [DOI] [PMC free article] [PubMed] [Google Scholar]
- Weir D, Faul J, & Langa K (2011). Proxy interviews and bias in the distribution of cognitive abilities due to nonresponse in longitudinal studies: A comparison of HRS and ELSA. Longitudinal and Life Course Studies: International Journal, 2(2), 170–184. 10.14301/llcs.v2i2.116 [DOI] [PMC free article] [PubMed] [Google Scholar]
- White H, Pieper C, Schmader K, & Fillenbaum G (1996). Weight change in Alzheimer’s disease. Journal of the American Geriatrics Society, 44(3), 265–272. 10.1111/j.1532-5415.1996.tb00912.x [DOI] [PubMed] [Google Scholar]
- Whitmer RA, Gunderson EP, Barrett-Connor E, Quesenberry CP, & Yaffe K (2005). Obesity in middle age and future risk of dementia: A 27 year longitudinal population based study. BMJ (Clinical Research Ed.), 330(7504), 1360. 10.1136/bmj.38446.466238.E0 [DOI] [PMC free article] [PubMed] [Google Scholar]
- Whitmer RA, & Yaffe K (2006). Obesity and dementia: Life-course evidence and mechanisms. Aging Health, 2(4), 571–578. 10.2217/1745509X.2.4.571 [DOI] [Google Scholar]
- Wolfson C, Wolfson DB, Asgharian M, M’Lan CE, Ostbye T, Rockwood K, & Hogan DB Clinical Progression of Dementia Study Group. (2001). A reevaluation of the duration of survival after the onset of dementia. The New England Journal of Medicine, 344(15), 1111–1116. 10.1056/NEJM200104123441501 [DOI] [PubMed] [Google Scholar]
- Xu WL, Atti AR, Gatz M, Pedersen NL, Johansson B, & Fratiglioni L (2011). Midlife overweight and obesity increase late-life dementia risk: A population-based twin study. Neurology, 76(18), 1568–1574. 10.1212/WNL.0b013e3182190d09 [DOI] [PMC free article] [PubMed] [Google Scholar]
- Zeki Al Hazzouri A, Haan MN, Whitmer RA, Yaffe K, & Neuhaus J (2012). Central obesity, leptin and cognitive decline: The sacramento area latino study on aging. Dementia and Geriatric Cognitive Disorders, 33(6), 400–409. 10.1159/000339957 [DOI] [PMC free article] [PubMed] [Google Scholar]
- Zhu Y, Chen Y, Crimmins EM, & Zissimopoulos JM (2021). Sex, race, and age differences in prevalence of dementia in medicare claims and survey data. The Journals of Gerontology. Series B, Psychological Sciences and Social Sciences, 76(3), 596–606. 10.1093/geronb/gbaa083 [DOI] [PMC free article] [PubMed] [Google Scholar]
Associated Data
This section collects any data citations, data availability statements, or supplementary materials included in this article.