

Abstract
Performance-based measures of frailty are associated with healthcare utilization after kidney transplantation (KT) but require in-person assessment. A promising alternative is self-reported frailty. The goal of this study was to examine the ability of performance-based and self-reported frailty measures to predict 30-day rehospitalizations after KT. We conducted a prospective, observational cohort study involving 272 adults undergoing KT at Mayo Clinic in Minnesota, Florida, or Arizona. We simultaneously measured frailty prior to KT using the Physical Frailty Phenotype (PFP), the Short Physical Performance Battery (SPPB), and self-report (the Patient-Reported Outcomes Measurement Information System [PROMIS] 4-item physical function short form v2.0). Both the PFP and self-reported frailty were independently associated with more than a 2-fold greater odds of 30-day rehospitalizations, while the SPPB was not. To our knowledge, this is the first study to assess the prognostic value of all three of the above frailty measures in patients undergoing KT. The PFP is more prognostic than the SPPB when assessing risk of 30-day rehospitalizations; self-reported frailty can complement the PFP but not replace it. However, the 4-item survey assessing self-reported frailty represents a simple way to identify patients undergoing KT surgery who would benefit from interventions to lower the risk of rehospitalizations.
Keywords: frailty, kidney transplantation, rehospitalizations
INTRODUCTION
Over the past decade, there has been increased recognition of the importance of frailty in predicting kidney transplantation (KT) outcomes.1,2 We now know that patients who are frail experience higher rates of mortality before and after KT compared to patients who are non-frail.3–5 The significance of frailty in KT has been so well established that approximately two-thirds of United States (U.S.) transplant centers have incorporated frailty testing into their KT evaluation process.6
Despite increased awareness of the impact of frailty in KT, an important unanswered question remains – how best to measure frailty? Most studies examining frailty in patients undergoing KT have utilized two different performance-based measures: the Physical Frailty Phenotype (PFP) that assesses weight loss, exhaustion, gait speed, weak grip strength, and decreased physical activity,7 and the Short Physical Performance Battery (SPPB) that measures balance, chair stand time, and gait speed.8 Scores on both measures are predictive of post-KT rehospitalization and mortality.4,9–11 Unfortunately, both measures involve tests of physical performance (i.e. grip strength and gait speed) and are thus limited by their need for supervised assessment involving trained personnel and specialized clinic space (e.g., a relatively private hallway where gait speed can be measured safely and accurately). Transplant centers would benefit from understanding which performance-based measure of frailty (the PFP or the SPPB) is more predictive of adverse KT outcomes. Further, a more easily obtained frailty measure capable of detecting the same risk of KT outcomes as performance-based measures would be useful.
One promising alternative to performance-based measures of frailty is self-reported frailty. Unlike performance-based measures, self-reported frailty does not require in-person or supervised assessment. Self-reported frailty has been shown to predict postoperative complications, including rehospitalizations, better than performance-based measures of frailty in community-dwelling older adults.12 However, it is unclear if self-reported frailty is predictive of rehospitalizations in patients undergoing KT and can fully replace performance-based measures of frailty for this purpose. The aims of this study were to 1) compare the ability of two different performance-based frailty measures (the PFP and the SPPB) to predict 30-day rehospitalizations after KT and 2) determine whether self-reported frailty can effectively replace performance-based measures of frailty in predicting 30-day rehospitalizations after KT.
METHODS
Study Design.
We conducted a prospective, observational cohort study involving consecutive adult patients undergoing KT alone at Mayo Clinic in Minnesota, Arizona, and Florida from 6/2020 to 2/2022. The performance-based measures of frailty and self-reported frailty outlined below were obtained simultaneously prior to KT (either upon hospital admission in patients undergoing deceased donor KT or at the time of outpatient preanesthesia medical evaluation in patients undergoing living donor KT). Participants and healthcare providers were not aware of the results of the frailty assessments. Participants provided written, informed consent. Our study was approved by the Mayo Clinic Institutional Review Board.
Recipient and KT characteristics [age, sex, race, ethnicity, prior KT, diabetes, pre-KT dialysis, calculated panel reactive antigen (cPRA), body mass index (BMI)] were obtained via patient self-report or via medical records. Charlson Comorbidity Index comorbidities were identified using International Classification of Diseases, Tenth Revision (ICD-10) codes.13 Participants underwent routine outpatient follow-up at Mayo Clinic during the first post-KT month per clinical protocol. Rehospitalizations were defined as any rehospitalization within 30-days of KT surgery and were abstracted from the medical record.
Performance-Based Frailty and Self-Reported Frailty.
Frailty was measured by trained study personnel using two different performance-based measures: the PFP and the SPPB. The PFP was measured according to the five Fried criteria: weight loss, self-reported exhaustion, slow gait speed, weak grip strength, and low self-reported physical activity.7 Each of the components were scored as 1 or 0 with a score of 1 indicating frailty for that component. A total score was calculated based on adding each of the component scores (range 0 to 5). A score of 3 or more was defined as frail, 1–2 as pre-frail, and 0 as not frail according to established guidelines.7 The SPPB was performed using three component measures of lower extremity function: balance, gait speed, and chair stands.8 Participants received a score of 0–4 for each of the three component tests. Scores for the component tests were then summed to provide a total score ranging from 0–12 with lower scores indicating worse function. We defined frailty as a SPPB score ≤ 10 based on prior studies demonstrating a relationship between scores ≤ 10 and KT waitlist mortality, post-KT length of stay, and post-KT mortality.11,14,15
Self-reported frailty was measured using the Patient-Reported Outcomes Measurement Information System (PROMIS) 4-item physical function short form v2.0.16,17 PROMIS physical function measures are validated surveys developed by the National Institutes of Health for use in the general population and patients living with chronic conditions.18–20 The items on the PROMIS 4-item physical function short form ask about patients’ ability to perform various physical activities and are displayed in Figure 1. Each of the 4 items has 5 response options with lower scores indicating worse physical function. The scores for each of the responses are summed and converted to a standardized T-score according to PROMIS scoring guidelines.21 A PROMIS T-score of 50 represents the mean of the general population in the United States with a standard deviation of 10. T-scores < 40 signify moderately to severely reduced physical function according to established cut points.21 In our cohort, we defined self-reported frailty as a T-score < 40.
Figure 1.

Items on the Patient-Reported Outcomes Measurement Information System (PROMIS) 4-item physical function short form. Response options: without any difficulty (5 points), with a little difficulty (4 points), with some difficulty (3 points), with much difficulty (2 points), unable to do (1 point).16,17
Data Analysis.
Data was summarized as counts and percentages or means with standard deviation. We utilized Kaplan-Meier survival analysis and proportional hazards models to examine the relationship between pre-KT frailty as measured by the PFP, the SPPB, and self-report with 30-day rehospitalizations after KT. We utilized Kendall’s τ coefficients and kappa statistics to assess agreement between continuous and categorical scores on each of the three frailty measures, respectively, with 1 indicating perfect agreement and 0 indicating no agreement. To determine the ability of each frailty measure to independently predict risk of 30-day rehospitalization after KT, we adjusted for clinical variables (age, sex, race, body mass index, pre-KT dialysis, number of comorbidities). We also examined the ability of each frailty measure to predict 30-day rehospitalizations after adjusting for each of the other two frailty measures. We initially considered whether measures of frailty could predict 1-year graft and participant survival, but with only 8 death-censored graft losses and 9 participant deaths during the 1-year of follow-up, we lacked statistical power for meaningful analyses. Analyses were performed using Analyses were performed using R v4.1.2 (R Foundation for Statistical Computing, Vienna, Austria). p-values < 0.05 were considered significant.
RESULTS
Study Population.
Baseline characteristics of the study cohort are displayed in Table 1. The cohort consisted of 272 participants with a mean age of 54 ± 13 years. Overall, 156 (57%) of the participants were male, 222 (88%) were white, 79 (29%) had diabetes, and 90 (33%) received a deceased donor KT. Induction immunosuppression consisted of anti-thymocyte globulin in 95 (35%), alemtuzumab in 84 (31%), and basiliximab in 93 (34%). The most common maintenance immunosuppression regimen was tacrolimus, mycophenolate, and prednisone which occurred in 170 (63%) participants. Among the cohort, 19% (n=50) of participants were frail according to the PFP, 56% (n=152) were frail according to the SPPB, and 26% (n=70) were frail according to self-report (Table 2).
Table 1.
Baseline demographics
| Variable | Participants (n=272) |
|---|---|
| Age (years), mean ± SD | 53.7 ± 13.4 |
| Range | 20–79 |
| Male | 156 (57.4%) |
| Race | |
| White | 222 (88.2%) |
| Black | 26 (9.6%) |
| Asian | 9 (3.3%) |
| American Indian | 5 (1.8%) |
| Other/chose not to disclose | 10 (3.7%) |
| Hispanic ethnicity | 25 (9.2%) |
| Pre-transplant dialysis modality | |
| None | 105 (38.6%) |
| Hemodialysis | 119 (43.8%) |
| Peritoneal dialysis | 48 (17.6%) |
| Time on dialysis (years), median [IQR] | 2.9 [0.1–20.1] |
| Calculated panel reactive antibody (cPRA), mean ± SD | 18.6 ± 33.2 |
| Body mass index (kg/m2), mean ± SD | 28.7 ± 5.2 |
| Myocardial infarction | 19 (7.0%) |
| Congestive heart failure | 54 (19.9%) |
| Peripheral vascular disease | 109 (40.1%) |
| Cerebrovascular disease | 36 (13.2%) |
| Chronic obstructive pulmonary disease | 44 (16.2%) |
| Diabetes mellitus | 79 (29.0%) |
| Deceased donor kidney transplant | 90 (33.1%) |
| Induction immunosuppression | |
| Anti-thymocyte globulin | 95 (34.9%) |
| Alemtuzumab | 84 (30.9%) |
| Basiliximab | 93 (34.2%) |
| Maintenance immunosuppression | |
| Tacrolimus/mycophenolate/prednisone | 170 (62.5%) |
| Tacrolimus/mycophenolate | 96 (35.3%) |
| Belatacept/mycophenolate/prednisone | 6 (2.2%) |
| Steroid maintenance therapy | 176 (64.7%) |
SD = standard deviation; IQR = interquartile range;
cPRA = calculate panel reactive antibody
Table 2.
Pre-transplant performance-based measures of frailty and self-reported frailty in patients undergoing kidney transplantation
| PERFORMANCED-BASED MEASURES OF FRAILTY | |
|---|---|
| Physical Frailty Phenotype (PFP) | |
| Total score, median [IQR] | 1 [IQR 1, 2] |
| Frail1 | 50 (18.5%) |
| Pre-frail1 | 165 (60.9%) |
| Not frail1 | 56 (20.7%) |
| Short Physical Performance Battery (SPPB) | |
| Total score, median [IQR] | 10 [IQR 9, 12] |
| Frail2 | 152 (56.1%) |
| SELF-REPORTED FRAILTY | |
| Total score, median [IQR] | 46.5 [IQR 22.6, 57.0] |
| Frail3 | 70 (25.8%) |
Frail = total score ≥ 3, pre-frail = total score 1–2, not frail = total score 0;
Total score ≤ 10;
Patient-Reported Outcomes Measurement Information System (PROMIS) 4-item physical function short form score < 40; IQR = interquartile range
Agreement Between Pre-KT Performance-Based Measures of Frailty and Self-Reported Frailty.
When examining frailty scores as continuous variables, we found that total scores for each of the two performance-based measures of frailty were correlated (Kendall’s τ = −0.3677, p<0.0001). Self-reported frailty score was correlated with PFP and SPPB total scores (Kendall’s τ = −0.2916, p<0.0001 and 0.1917, p<0.0001, respectively) (Table 3). Likewise, when examining frailty as categorical scores, we found that frailty according to both performance-based measures was correlated (kappa = 0.2324, p<0.0001). Frailty by self-report was correlated with frailty by the PFP and by the SPPB (kappa = 0.2984, p<0.0001 and kappa = 0.1899, p=0.0001, respectively) (Table 3). The distribution of participants who were frail by PFP, SPPB, and self-report and their overlap is displayed in Figure 2. Overall, 9% (n=24) of participants were frail according to all three measures, and 37% (n=99) were not frail according to all three measures.
Table 3.
Agreement between frailty scores as measured by the Physical Frailty Phenotype (PFP), the Short Physical Performance Battery (SPPB), and by self-report
| Kendall’s τ1 | p-value | Kappa2 | p-value | |
|---|---|---|---|---|
| Frailty by the PFP and by the SPPB | −0.3677 | <0.0001 | 0.2324 | <0.0001 |
| Frailty by self-report and by the PFP | −0.2916 | <0.0001 | 0.2984 | <0.0001 |
| Frail by self-report and by the SPPB | 0.1917 | <0.0001 | 0.1899 | 0.0001 |
Comparison of continuous scores for each frailty measure;
Comparison of categorical scores for each frailty measure (frail = total PFP score ≥ 3 or SPPB score ≤ 10 or Patient-Reported Outcomes Measurement Information System [PROMIS] 4-item physical function short form score < 40)
Figure 2.

Venn diagram of frailty according to frailty measure among 272 patients undergoing kidney transplantation.
Relationship Between Pre-KT Performance-Based Measures of Frailty, Self-Reported Frailty and 30-Day Rehospitalizations After KT.
Sixty-five (23%) of participants experienced a rehospitalization within 30 days after KT. Reasons for rehospitalization included acute kidney injury in 20% of participants (n=13), gastrointestinal symptoms in 19% (n=12), infection in 19% (n=12), surgical complications in 12% (n=8), hyperkalemia in 11% (n=7), hypotension or hypertension in 8% (n=5), and other reasons in 12% (n=8).
Participants who were frail by each frailty measurement were more likely to experience 30-day rehospitalizations after KT (Figure 3 A–C). Specifically, participants who were frail according to the PFP were more likely to be rehospitalized (44% versus 20%, p=0.0005), as were participants who were frail according to the SPPB (30% versus 17%, p=0.01) and participants with self-reported frailty (39% versus 19%, p=0.001). When examining the overlap between frailty measures, we found that participants who were frail according to all three frailty measures experienced significantly more rehospitalizations than participants who were not frail according to all three frailty measures (50% versus 13%, p=0.0004). We did not observe a relationship between reasons for rehospitalizations and frailty according to any of the measures (data not shown). Likewise, we did not observe a relationship between the length of 30-day rehospitalizations and frailty according to any of the measures (data not shown).
Figure 3.

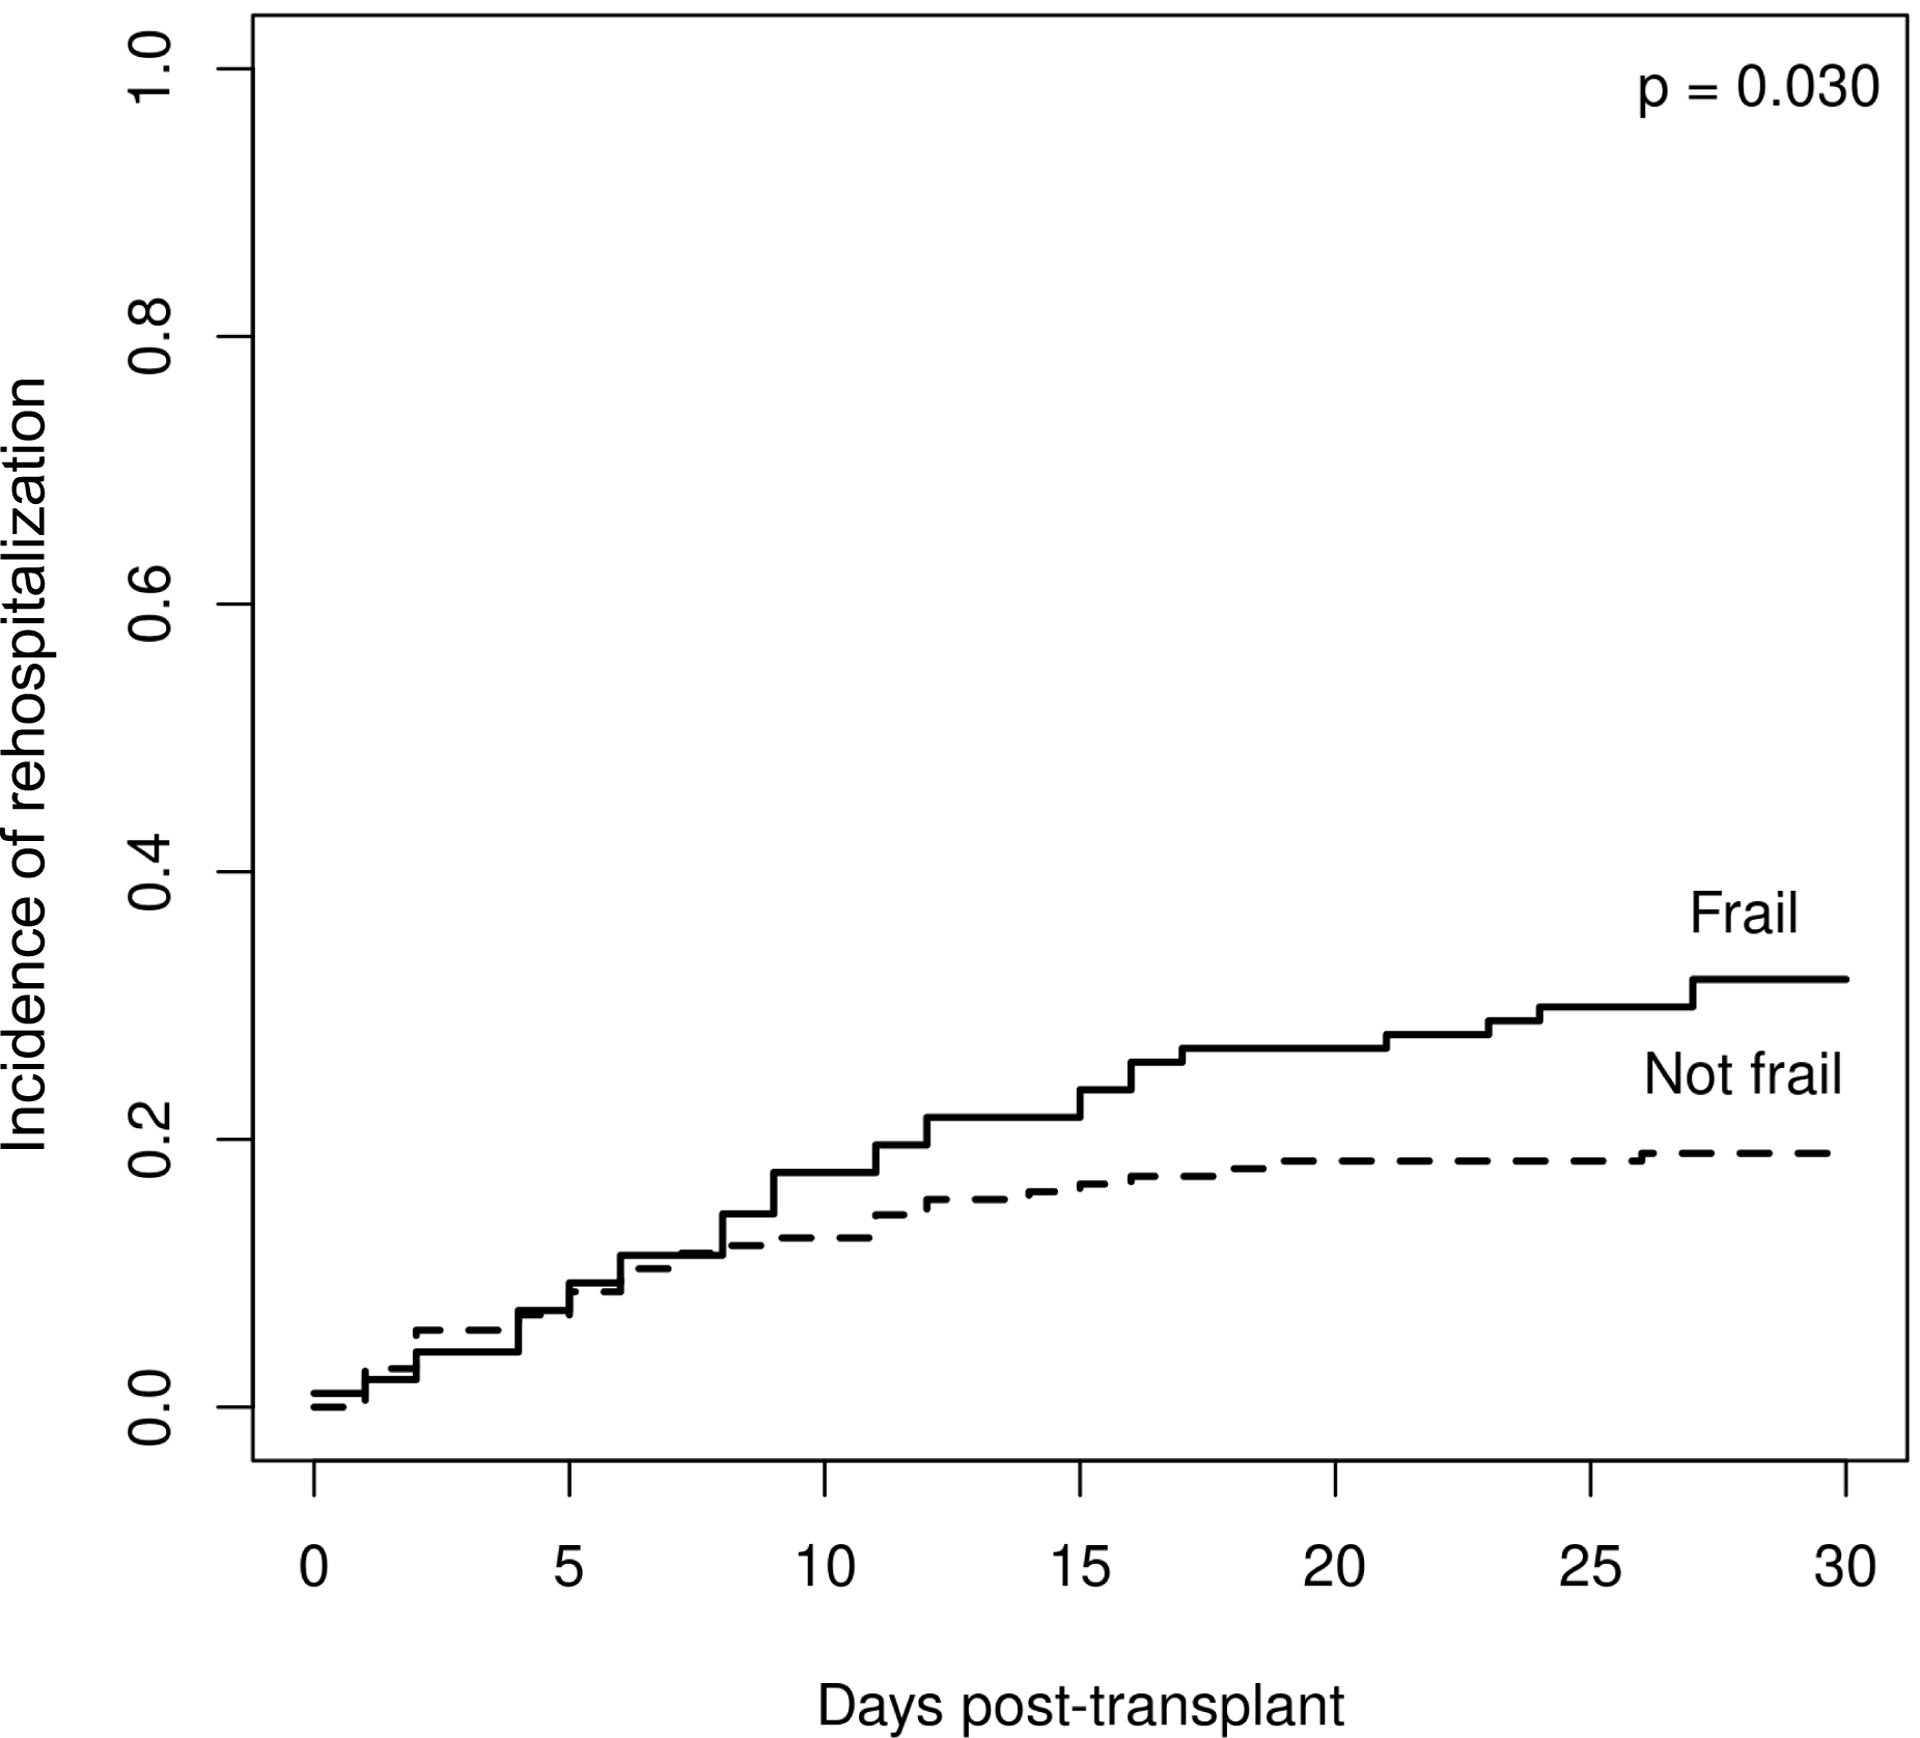

Relationship between frailty and 30-day rehospitalizations after kidney transplantation according to frailty measure. A. Frail by Physical Frailty Phenotype (PFP); B. Frail by Short Physical Performance Battery (SPPB); C. Frail by self-report.
We next examined the relationship between diabetes, frailty measures, and 30-day rehospitalizations. We found that participants with diabetes who were frail by the PFP were significantly more likely to experience 30-day rehospitalizations than participants who were not frail by the PFP (score = 0) (50.0% versus 0.0%, p=0.004). Participants with diabetes who were frail according to the SPPB were not more likely to experience 30-day rehospitalization than participants who were not frail by the SPPB (78.6% versus 21.4%, p=0.27). Lastly, participants with diabetes and self-reported frailty were more likely to experience 30-day rehospitalizations than participants with diabetes and no self-reported frailty (57.1% versus 42.9%, p=0.02).
When examining the relationship between frailty and 30-day rehospitalizations, we found on univariate analysis that frailty according to each of the three measures was associated with a higher risk of 30-day rehospitalizations (Table 4). The relationship between frailty according to PFP, SPPB, or self-report remained statistically significant even after adjusting for clinical variables, including age, sex, race, body mass index, pre-KT dialysis, and number of comorbidities (OR 3.16, 95% CI 1.60–6.25, p=0.001; OR 2.12, 95% CI 1.12–4.00, p=0.02; OR 3.00, 95% CI 1.58–5.70, p=0.008, respectively). However, we found that the relationship between frailty according to the SPPB and 30-day rehospitalizations was no longer significant after adjusting for the PFP or self-reported frailty. In contrast, frailty according to the PFP and self-reported frailty remained significantly associated with 30-day rehospitalizations even after adjusting for either of the other two frailty measures.
Table 4.
Relationship between frailty and 30-day rehospitalizations
| Frailty measure | Unadjusted | Adjusted for clinical variables1 | Adjusted only for Physical Frailty Phenotype (PFP) (continuous) | Adjusted only for Short Physical Performance Battery (SPPB) (continuous) | Adjusted only for self-reported frailty (continuous) | |||||
|---|---|---|---|---|---|---|---|---|---|---|
| OR (95% CI) | p-value | OR (95% CI) | p-value | OR (95% CI) | p-value | OR (95% CI) | p-value | OR (95% CI) | p-value | |
| Frail2 | 3.25 (1.69–6.24) | 0.0005 | 3.16 (1.60–6.25) | 0.001 | 2.83 (1.37–5.81) | 0.005 | 2.37 (1.89–4.70) | 0.01 | ||
| Frail3 | 2.08 (1.16–3.83) | 0.01 | 2.12 (1.12–4.00) | 0.02 | 1.60 (0.84–3.11) | 0.15 | 1.66 (0.90–3.11) | 0.10 | ||
| Frail4 | 2.69 (1.48–4.90) | 0.001 | 3.00 (1.58–5.70) | 0.008 | 2.17 (1.14–4.11) | 0.02 | 2.39 (1.28–4.42) | 0.006 | ||
Age, sex, white race, body mass index, pre-transplant dialysis, number of comorbidities;
Frail = total score ≥ 3, pre-frail = total score 1–2, not frail = total score 0;
Total score ≤ 10;
Patient-Reported Outcomes Measurement Information System (PROMIS) 4-item physical function short form score < 40
DISCUSSION
In this study, we sought to examine the ability of performance-based frailty measures (the PFP and the SPPB) and self-reported frailty (assessed via the PROMIS 4-item physical function short form) to predict 30-day rehospitalizations after KT. To our knowledge, ours is the first study to assess the prognostic value of all three measures in patients undergoing KT. We found that the SPPB captures essentially the same frailty constructs as the PFP and self-report, while the PFP and self-report capture overlapping but distinct frailty phenotypes. We demonstrated that both the PFP and self-reported frailty outperformed the SPPB when assessing risk of 30-day rehospitalizations. Frailty as measured by either the PFP or by self-report was associated with more than a 2-fold greater odds of 30-day rehospitalizations after KT.
Given the prevalence and impact of frailty in KT, the American Society of Transplantation issued a consensus statement emphasizing the need to identify the optimal frailty assessment in patients undergoing KT.22 Our study sought to address this need. We first compared two performance-based measures, the PFP and the SPPB, in predicting 30-day rehospitalizations after KT. The PFP was originally developed by Linda Fried and colleagues and assesses weight loss, self-reported exhaustion, gait speed, grip strength, and self-reported physical activity.7 Although it is typically viewed as the ‘gold-standard’ of frailty assessments, experts have argued that purely objective tests of lower extremity function like the SPPB might be preferable in KT candidates who might underreport their exhaustion and overreport their physical activity on the PFP in an effort to gain access to the KT waiting list.23 Instead, we found that the PFP outperformed the SPPB in predicting 30-day rehospitalizations in our cohort. These findings are similar to a study involving older hospitalized adults which found that frailty by the PFP was associated with rehospitalizations and death, whereas SPPB scores were not.24 We hypothesize that the PFP might perform better, because it captures overall physical, mental, and social health more fully than isolated tests of lower extremity function.25
Our study also examined whether a brief self-report measure could replace the PFP in predicting 30-day rehospitalizations. We measured self-reported frailty using the PROMIS 4-item physical function short form which assesses patients’ ability to perform various physical activities, including climbing stairs and walking.16,17 We found that self-report and the PFP identify overlapping yet distinct frailty constructs. Self-reported frailty predicted 30-day rehospitalizations independently of the PFP and SPPB. Our study findings align with a recent study demonstrating that PROMIS physical function short form scores are associated with rehospitalization after liver transplantation.26
Although self-reported frailty predicted 30-day rehospitalizations in our cohort, we found that it is not a proxy for frailty measured by the PFP. Frailty by the PFP remained associated with 30-day rehospitalizations after adjusting for self-reported frailty. However, our finding that only 4 survey questions independently predicted 30-day rehospitalizations has potential implications for clinical practice. For example, the survey represents a simple way to identify patients undergoing KT surgery who would benefit from interventions to lower the risk of rehospitalizations. The 4 survey questions could be administered at the time of admission for KT. Patients with T-scores < 40 (signifying moderately to severely reduced physical function) might benefit from physical therapy following KT enhanced education regarding discharge instructions at the time of hospital dismissal; more frequent communication with post-KT nurses after discharge regarding symptom monitoring and medication management; and more frequent clinic follow-up during the first 30 days post-KT.
Our study has several limitations. First, the results of our study may not generalize to other patient populations. Our study cohort consisted mainly of patients who were non-Hispanic white. Furthermore, only 29% of participants had diabetes, 38% received a preemptive KT, and 67% received a living donor KT. External validation in a more diverse and potentially more frail cohort is needed. Second, our study involved patients undergoing KT and may not generalize to KT candidates who have not yet been approved for KT. Self-reported frailty measured at the time of KT evaluation may be less predictive given that candidates seeking access to the waiting list may minimize limitations in physical function. Lastly, our study lacked long-term mortality data. Future studies should examine the relationship between self-reported frailty and pre- and post-KT mortality, both of which have been associated with performance-based measures of frailty in prior studies.3,4,11
In summary, our study prospectively examined the ability of performance-based frailty and self-reported frailty to predict 30-day rehospitalizations among patients undergoing KT at three different transplant centers. We demonstrated that the SPPB largely captures the same frailty constructs as the PFP and self-report, while the PFP and self-report capture overlapping but distinct frailty phenotypes. Both the PFP and self-reported frailty outperform the SPPB when assessing risk of post-KT rehospitalization. Self-reported frailty can complement the PFP when assessing risk for 30-day rehospitalization after KT but not replace it.
ACKNOWLEDGEMENTS
We acknowledge the study coordinators without whom this study could not have been completed.
FUNDING
Dr. Lorenz is supported by the National Institute of Diabetes and Digestive and Kidney Diseases of the National Institutes of Health (Award Number DK 123313). This work was also supported by the Mayo Clinic Ara and Sonya Hacet Career Development Award in Transplant.
ABBREVIATIONS
- KT
kidney transplantation
- US
United States
- PFP
Physical Frailty Phenotype
- SPPB
Short Physical Performance Battery
- cPRA
calculated panel reactive antigen
- BMI
body mass index
- ICD-10
International Classification of Diseases, Tenth Revision
- PROMIS
Patient-Reported Outcomes Measurement Information System
- SD
standard deviation
- IQR
interquartile range
Footnotes
DISCLOSURE
The authors declare no conflicts of interest.
DATA AVAILABILITY STATEMENT
The data collected for the study, including individual patient data and a data dictionary that defines each field in the data set, will be made available as deidentified participant data to researchers who propose to use the data for individual patient data meta-analysis. Data will be shared following approval of the proposal by the corresponding author and a signed data access agreement.
REFERENCES
- 1.Lorenz EC, Hickson LJ, Khairallah P, Najafi B, Kennedy CC. Cellular Senescence and Frailty in Transplantation. Curr Transplant Rep. Jun 2023;10(2):51–59. doi: 10.1007/s40472-023-00393-6 [DOI] [PMC free article] [PubMed] [Google Scholar]
- 2.Lorenz EC, Kennedy CC, Rule AD, LeBrasseur NK, Kirkland JL, Hickson LJ. Frailty in CKD and Transplantation. Kidney Int Rep. Sep 2021;6(9):2270–2280. doi: 10.1016/j.ekir.2021.05.025 [DOI] [PMC free article] [PubMed] [Google Scholar]
- 3.Lorenz EC, Cosio FG, Bernard SL, et al. The Relationship Between Frailty and Decreased Physical Performance With Death on the Kidney Transplant Waiting List. Prog Transplant. Jun 2019;29(2):108–114. doi: 10.1177/1526924819835803 [DOI] [PubMed] [Google Scholar]
- 4.McAdams-DeMarco MA, Law A, King E, et al. Frailty and mortality in kidney transplant recipients. Research Support, N.I.H., Extramural Research Support, Non-U.S. Gov’t. Am J Transplant. Jan 2015;15(1):149–54. doi: 10.1111/ajt.12992 [DOI] [PMC free article] [PubMed] [Google Scholar]
- 5.McAdams-DeMarco MA, Ying H, Thomas AG, et al. Frailty, Inflammatory Markers, and Waitlist Mortality Among Patients With End-stage Renal Disease in a Prospective Cohort Study. Transplantation. Oct 2018;102(10):1740–1746. doi: 10.1097/TP.0000000000002213 [DOI] [PMC free article] [PubMed] [Google Scholar]
- 6.McAdams-DeMarco MA, Van Pilsum Rasmussen SE, Chu NM, et al. Perceptions and Practices Regarding Frailty in Kidney Transplantation: Results of a National Survey. Transplantation. Feb 2020;104(2):349–356. doi: 10.1097/TP.0000000000002779 [DOI] [PMC free article] [PubMed] [Google Scholar]
- 7.Fried LP, Tangen CM, Walston J, et al. Frailty in older adults: evidence for a phenotype. J Gerontol A Biol Sci Med Sci. Mar 2001;56(3):M146–56. doi: 10.1093/gerona/56.3.m146 [DOI] [PubMed] [Google Scholar]
- 8.Guralnik JM, Simonsick EM, Ferrucci L, et al. A short physical performance battery assessing lower extremity function: association with self-reported disability and prediction of mortality and nursing home admission. J Gerontol. Mar 1994;49(2):M85–94. doi: 10.1093/geronj/49.2.m85 [DOI] [PubMed] [Google Scholar]
- 9.Lorenz EC, Cheville AL, Amer H, et al. Relationship between pre-transplant physical function and outcomes after kidney transplant. Clin Transplant. May 2017;31(5)doi: 10.1111/ctr.12952 [DOI] [PMC free article] [PubMed] [Google Scholar]
- 10.McAdams-DeMarco MA, Law A, Salter ML, et al. Frailty and early hospital readmission after kidney transplantation. Research Support, N.I.H., Extramural. Am J Transplant. Aug 2013;13(8):2091–5. doi: 10.1111/ajt.12300 [DOI] [PMC free article] [PubMed] [Google Scholar]
- 11.Nastasi AJ, McAdams-DeMarco MA, Schrack J, et al. Pre-Kidney Transplant Lower Extremity Impairment and Post-Kidney Transplant Mortality. Am J Transplant. Jan 2018;18(1):189–196. doi: 10.1111/ajt.14430 [DOI] [PMC free article] [PubMed] [Google Scholar]
- 12.Kapoor A, Matheos T, Walz M, et al. Self-Reported Function More Informative than Frailty Phenotype in Predicting Adverse Postoperative Course in Older Adults. J Am Geriatr Soc. Nov 2017;65(11):2522–2528. doi: 10.1111/jgs.15108 [DOI] [PMC free article] [PubMed] [Google Scholar]
- 13.Deyo RA, Cherkin DC, Ciol MA. Adapting a clinical comorbidity index for use with ICD-9-CM administrative databases. J Clin Epidemiol. Jun 1992;45(6):613–9. doi: 10.1016/0895-4356(92)90133-8 [DOI] [PubMed] [Google Scholar]
- 14.Haugen CE, Agoons D, Chu NM, et al. Physical Impairment and Access to Kidney Transplantation. Transplantation. Feb 2020;104(2):367–373. doi: 10.1097/TP.0000000000002778 [DOI] [PMC free article] [PubMed] [Google Scholar]
- 15.Nastasi AJ, Bryant TS, Le JT, et al. Pre-kidney transplant lower extremity impairment and transplant length of stay: a time-to-discharge analysis of a prospective cohort study. BMC Geriatr. Oct 19 2018;18(1):246. doi: 10.1186/s12877-018-0940-y [DOI] [PMC free article] [PubMed] [Google Scholar]
- 16.Rose M, Bjorner JB, Becker J, Fries JF, Ware JE. Evaluation of a preliminary physical function item bank supported the expected advantages of the Patient-Reported Outcomes Measurement Information System (PROMIS). J Clin Epidemiol. Jan 2008;61(1):17–33. doi: 10.1016/j.jclinepi.2006.06.025 [DOI] [PubMed] [Google Scholar]
- 17.Rose M, Bjorner JB, Gandek B, Bruce B, Fries JF, Ware JE Jr. The PROMIS Physical Function item bank was calibrated to a standardized metric and shown to improve measurement efficiency. J Clin Epidemiol. May 2014;67(5):516–26. doi: 10.1016/j.jclinepi.2013.10.024 [DOI] [PMC free article] [PubMed] [Google Scholar]
- 18.Cella D, Choi SW, Condon DM, et al. PROMIS((R)) Adult Health Profiles: Efficient Short-Form Measures of Seven Health Domains. Value Health. May 2019;22(5):537–544. doi: 10.1016/j.jval.2019.02.004 [DOI] [PMC free article] [PubMed] [Google Scholar]
- 19.Schalet BD, Kaat A, Vrahas M, Buckenmaier CT III, Barnhill R, & Gershon RC Extending the ceiling of an item bank: development of above-average physical function items for PROMIS. Quality of Life Research. 2016;25:109. [Google Scholar]
- 20.Schalet BD, Hays RD, Jensen SE, Beaumont JL, Fries JF, Cella D. Validity of PROMIS physical function measured in diverse clinical samples. J Clin Epidemiol. May 2016;73:112–8. doi: 10.1016/j.jclinepi.2015.08.039 [DOI] [PMC free article] [PubMed] [Google Scholar]
- 21.PROMIS Score Cut Points. Accessed September 1, 2023. https://www.healthmeasures.net/score-and-interpret/interpret-scores/promis/promis-score-cut-points
- 22.Kobashigawa J, Dadhania D, Bhorade S, et al. Report from the American Society of Transplantation on frailty in solid organ transplantation. Am J Transplant. Apr 2019;19(4):984–994. doi: 10.1111/ajt.15198 [DOI] [PMC free article] [PubMed] [Google Scholar]
- 23.Harhay MN, Rao MK, Woodside KJ, et al. An overview of frailty in kidney transplantation: measurement, management and future considerations. Nephrol Dial Transplant. Jul 1 2020;35(7):1099–1112. doi: 10.1093/ndt/gfaa016 [DOI] [PMC free article] [PubMed] [Google Scholar]
- 24.Tew YY, Chan JH, Keeling P, et al. Predicting readmission and death after hospital discharge: a comparison of conventional frailty measurement with an electronic health record-based score. Age Ageing. Sep 11 2021;50(5):1641–1648. doi: 10.1093/ageing/afab043 [DOI] [PMC free article] [PubMed] [Google Scholar]
- 25.Alsaad R, Chen X, McAdams-DeMarco M. The clinical application of frailty in nephrology and transplantation. Curr Opin Nephrol Hypertens. Nov 1 2021;30(6):593–599. doi: 10.1097/MNH.0000000000000743 [DOI] [PMC free article] [PubMed] [Google Scholar]
- 26.Thuluvath AJ, Duarte-Rojo A, Lai JC, et al. Brief PROMIS Assessment Screens for Frailty and Predicts Hospitalizations in Liver Transplant Candidates. Transplantation. Jul 27 2023;doi: 10.1097/TP.0000000000004741 [DOI] [PMC free article] [PubMed] [Google Scholar]
Associated Data
This section collects any data citations, data availability statements, or supplementary materials included in this article.
Data Availability Statement
The data collected for the study, including individual patient data and a data dictionary that defines each field in the data set, will be made available as deidentified participant data to researchers who propose to use the data for individual patient data meta-analysis. Data will be shared following approval of the proposal by the corresponding author and a signed data access agreement.