

Abstract
Age, ethnic background and genetic components have been identified as the established risks for prostate cancer (PCa). Pentraxin 3 (PTX3), originally identified as a pattern‐recognition molecule for defence against infectious agents, has multiple functions in tissue repair and in the regulation of cancer‐associated inflammation. In this study, we sought to investigate the impact of PTX3 gene variants on the development of PCa. Genotypes of four common single‐nucleotide polymorphisms (SNPs) of PTX3 gene, including rs1840680, rs2305619, rs3816527 and rs2120243, were profiled among 705 PCa patients and 705 ethnicity‐matched controls. In this study, we found that patients who carry at least one minor allele (C) of rs3816527 (AC and CC) tended to develop advanced forms of diseases (clinical large T stage, OR, 1.593, p = 0.032; pathologically‐confirmed nodal spread, OR, 1.987, p = 0.011; metastatic tumour, OR, 3.896, p = 0.032) as compared with those homologous for the major allele (AA). Further stratification analysis showed that such association of rs3816527 with lymphatic and distal metastasis of PCa was accentuated in the younger age group (≤65 at diagnosis) but not seen in the older age group (>65 at diagnosis), suggesting an age‐specific effect of PTX3 variants. Prediction of PTX3 protein structure implied that polymorphism may alter the quaternary organization and oligomerization of PTX3 protein. Moreover, our gene silencing experiments and survey of public datasets revealed that elevation of PTX3 levels in PCa was required for cell migration and associated with tumour metastasis. Our results highlight an association of PTX3 rs3816527 with the progression of PCa.
Keywords: metastasis, pentraxin 3, prostate cancer, single‐nucleotide polymorphism
1. INTRODUCTION
Prostate cancer (PCa) is the second most frequent malignancy among men globally, accounting for a substantial portion of cancer‐related deaths. 1 Age, ethnicity and genetic factors have been identified as established risks for PCa. 2 Study of age‐specific incidence curves revealed that the risk for PCa begins to rise sharply after the age of 55 and peaks at the age from 70 to 74. 3 The prevalence of PCa varies greatly across different ethnic populations and geographic regions, with the highest rate among men of African ancestry and the lowest rate among Asian males. 4 , 5 As the presence of a familial aggregation of PCa has been proposed many decades ago, 6 recent advancements in DNA sequencing have uncovered a number of PCa susceptibility genes that control DNA repair mechanisms. 7 These genetic components together with numerous common germline variants that confer low to moderate risks were estimated to underpin more than a third of familial PCa risk. 8 In addition to forementioned risks, other modifiable etiological parameters of PCa, although still debatable, include but not limited to metabolic syndrome, obesity and smoking. 2 Taking such heterogeneous nature of disease aetiology into consideration, all potential causes stated above appear to be interconnected and needed to evaluate the occurrence and prognosis of PCa.
Pentraxins, a cyclic multimeric protein family belonging to soluble pattern recognition receptors (PRRs), are central to complement activation and innate immunity. 9 , 10 , 11 Among the members of this evolutionarily conserved protein family, pentraxin 3 (PTX3) was implicated as essential components of inflammation and tissue remodelling, in addition to its fundamental roles in defence against infectious agents. 12 , 13 Paradoxically, PTX3 can exhibit both suppressive and promotive effects on the progression of cancer. 14 , 15 In line with the observations that silencing of PTX3 expression via an epigenetic manner was detected in some cancer types, 16 , 17 , 18 a tumour suppressor function of PTX3 was demonstrated in gene knockout mice. 18 However, several in vitro experiments performed with manipulation of PTX3 expression indicated that PTX3 acts as a cancer promotor through inducing epithelial‐mesenchymal transition and macrophage chemotaxis. 19 , 20 , 21 These contradictory findings imply that PTX3 may play a dual role in tumorigenesis, possibly depending on the types of malignancies, or on the cells producing it within the tumour microenvironment.
Single‐nucleotide polymorphisms (SNPs) in the PTX3 gene have been associated with the susceptibility to pulmonary aspergillosis, 22 COVID‐19 severity, 23 hepatocellular carcinoma, 24 oral cancer 25 and cervical cancer. 26 Although extensive genome‐wide association studies have reported numerous common SNPs of modest effects on PCa risks, 27 , 28 , 29 , 30 the genetic mechanism behind such susceptibility remains still largely elusive. Here, we used a targeted gene approach with a case–control setting to assess the influence of PTX3 SNPs on the risk of PCa.
2. MATERIALS AND METHODS
2.1. Subjects
A cohort comprising 705 PCa cases who received a robot‐assisted laparoscopic radical prostatectomy from 2012 to 2018 was recruited at Taichung Veteran General Hospital (Taichung, Taiwan) with the approval by the Institutional Review Board (CE19062A). Additionally, 705 non‐cancer males of the same ethnicity who reside in a similar geographic region were randomly selected as a control group. Informed consent and peripheral blood were collected from each subject. Demographic and clinical parameters of PCa cases at diagnosis, such as age, tumour staging, prostate‐specific antigen (PSA) levels, pathologic Gleason scoring, D'Amico risk classification and cancer invasion status (perineural, seminal vesicle and lymphovascular), were retrieved from their medical records.
2.2. Genotyping
Genotypes of four common SNPs in PTX3 gene (rs1840680, rs2305619, rs3816527 and rs2120243) chosen based on their putative associations with many pathogenic conditions 22 , 23 , 24 , 25 , 26 were determined in this investigation. The QIAamp DNA Blood Mini kit (Qiagen, Valencia, CA, USA) was used to extract genomic DNA from whole blood samples and PCa cell lines. Discrimination of alleles for four SNPs was performed via the TaqMan assay with an ABI StepOne™ Real‐Time PCR System (Applied Biosystems, Foster City, CA, USA), and then analysed by SDS version 3.0 software (Applied Biosystems, Foster City, CA, USA).
2.3. Prediction of PTX3 protein structure
Structural information of PTX3 protein was predicted by AlphaFold, a machine learning approach that incorporates physical and biological knowledge regarding protein structures, 31 as the crystal structure of PTX3 has not been determined yet. Full‐length amino acid sequence of human PTX3, consisting of 381 residues, was downloaded from Uniprot (UniProt ID: P26022). Structures of PTX3 were accessed from the AlphaFold Protein Structure Database (https://alphafold.ebi.ac.uk/).
2.4. Immunoblotting
Protein lysates were prepared from cell culture and separated using SDS‐polyacrylamide gels, followed by transferring to Immobilon PVDF membranes (Millipore). Specific immunoglobulins targeting the following molecules were used for detection: Anti‐PTX3 and anti‐β‐actin from Abcam (Waltham, MA, USA); HRP‐conjugated secondary antibodies. Densitometry of immunoblots was carried out via ImageJ.
2.5. Cell culture and migration
PCa cell lines (Du‐145, PC‐3 and 22Rv1) were obtained from the American Type Culture Collection (ATCC; Rockville, MD, USA) and maintained in RPMI 1640 medium with L‐glutamine (Gibco) at 37°C in a humidified atmosphere with 5% CO2. The potential of PC‐3 cells to migrate was evaluated with a modified Boyden chamber experiment as described previously. 32 Briefly, cells with/without manipulation of PTX3 expression were seeded on the 8‐μm‐pore size polycarbonate membrane filter with serum‐free media at a density of 104 cells per well, allowed to migrate for 24 h, and subsequently counted under an Olympus microscope (Olympus, Tokyo, Japan).
2.6. Statistical analysis
Associations of PTX3 genotypic frequencies with the occurrence or clinical parameters of PCa were assessed by logistic regression models. The difference of PTX3 expression in the datasets of the Gene Expression Omnibus (GEO) repository was analysed by Student's t‐test. Data were calculated by using SAS software. The threshold of difference/association was set by a p‐value of <0.05.
3. RESULTS
3.1. Study cohort
In this investigation, 705 male patients were recruited to explore the potential correlation of PTX3 gene polymorphisms with the development of PCa. Analyses of demographic and clinical features demonstrated that their age tended to be high (57.7% over 65 years old), and the majority were diagnosed with low/intermediate‐graded and early‐staged tumours (Table 1). A small proportion of patients developed nodal spread (2%) and distal metastasis (1.6%). Among our cases, seminal vesicle, perineural and lymphovascular invasion occurred in 21.4%, 73.6% and 15.9% of patients, respectively. Based on the D'Amico risk scores, a total of 50.4% of patients were predicted at a high risk for disease recurrence.
TABLE 1.
The distributions of demographical characteristics in 705 patients with prostate cancer.
| Variable | Patients (N = 705) |
|---|---|
| Age at diagnosis (years) | |
| ≤65 | 298 (42.3%) |
| >65 | 407 (57.7%) |
| PSA at diagnosis (ng/mL) | |
| ≤10 | 335 (47.5%) |
| >10 | 370 (52.5%) |
| Pathologic Gleason grade group | |
| 1 + 2 + 3 | 585 (83.0%) |
| 4 + 5 | 120 (17.0%) |
| Clinical T stage | |
| 1 + 2 | 607 (86.1%) |
| 3 + 4 | 98 (13.9%) |
| Clinical N stage | |
| N0 | 691 (98.0%) |
| N1 | 14 (2.0%) |
| Clinical M stage | |
| No | 694 (98.4%) |
| Yes | 11 (1.6%) |
| Pathologic T stage | |
| 2 | 373 (52.9%) |
| 3 + 4 | 332 (47.1%) |
| Pathologic N stage | |
| N0 | 645 (91.5%) |
| N1 | 60 (8.5%) |
| Seminal vesicle invasion | |
| No | 554 (78.6%) |
| Yes | 151 (21.4%) |
| Perineural invasion | |
| No | 186 (26.4%) |
| Yes | 519 (73.6%) |
| Lymphovascular invasion | |
| No | 593 (84.1%) |
| Yes | 112 (15.9%) |
| D'Amico classification | |
| Low risk/intermediate risk | 350 (49.6%) |
| High risk | 355 (50.4%) |
| Biochemical recurrence | |
| No | 481 (68.2%) |
| Yes | 224 (31.8%) |
3.2. Association of PTX3 SNP with the progression of PCa
To assess the potential link of PTX3 gene variants to the progression of PCa, four PTX3 SNPs (rs1840680, rs2305619, rs3816527 and rs2120243) exhibiting no significant deviation (p > 0.05) from Hardy–Weinberg equilibrium in controls were explored in this investigation. Although none of these SNPs reached the threshold for significant associations, marginal effects on PCa risks were observed for specific genotypes of rs1840680, rs2305619, rs3816527 and rs2120243 after the adjustment for age (Table 2). Moreover, we tested the impact of PTX3 polymorphism on clinicopathological parameters of PCa patients (Tables 3 and 4). We found that patients who bear at least one minor allele (C) of rs3816527 (AC and CC) tended to develop advanced forms of diseases (clinical T stage III/IV, OR, 1.593; 95% CI, 1.038–2.444; p = 0.032) (pathologically‐confirmed nodal spread, OR, 1.987; 95% CI, 1.164–3.391; p = 0.011) (metastatic tumour, OR, 3.896; 95% CI, 1.025–14.812; p = 0.032) as compared with those homologous for the major allele (AA) (Table 3). Yet, such association with advanced PCa was not detected in rs1840680, rs2305619 and rs2120243 (Tables 3 and 4). These results highlight a possible connection of rs3816527 variants with the progression of PCa.
TABLE 2.
Adjusted odds ratio (AOR) and 95% confidence interval (CI) of prostate cancer associated with PTX3 genotypic frequencies.
| Variable | Controls (N = 705) (%) | Patients (N = 705) (%) | AOR (95% CI) | p‐value |
|---|---|---|---|---|
| rs2120243 | ||||
| CC | 308 (43.7%) | 297 (42.1%) | 1.000 (reference) | |
| CA | 329 (46.7%) | 328 (46.5%) | 1.065 (0.818–1.385) | 0.641 |
| AA | 68 (9.6%) | 80 (11.4%) | 1.185 (0.777–1.807) | 0.431 |
| CA + AA | 397 (56.3%) | 408 (57.9%) | 1.086 (0.844–1.397) | 0.524 |
| rs3816527 | ||||
| AA | 437 (62.0%) | 415 (58.9%) | 1.000 (reference) | |
| AC | 234 (33.2%) | 258 (36.6%) | 1.272 (0.978–1.655) | 0.073 |
| CC | 34 (4.8%) | 32 (4.5%) | 0.874 (0.479–1.595) | 0.661 |
| AC + CC | 268 (38.0%) | 290 (41.1%) | 1.217 (0.945–1.567) | 0.128 |
| rs2305619 | ||||
| GG | 295 (41.8%) | 274 (38.9%) | 1.000 (reference) | |
| GA | 328 (46.5%) | 347 (49.2%) | 1.291 (0.988–1.685) | 0.061 |
| AA | 82 (11.7%) | 84 (11.9%) | 1.228 (0.815–1.850) | 0.327 |
| GA + AA | 410 (58.2%) | 431 (61.1%) | 1.278 (0.990–1.647) | 0.059 |
| rs1840680 | ||||
| GG | 316 (44.8%) | 295 (41.8%) | 1.000 (reference) | |
| GA | 309 (43.8%) | 330 (46.8%) | 1.298 (0.976–1.731) | 0.063 |
| AA | 80 (11.4%) | 80 (11.4%) | 1.132 (0.748–1.712) | 0.557 |
| GA + AA | 389 (55.2%) | 410 (58.2%) | 1.286 (0.999–1.656) | 0.051 |
Note: AOR with their 95% confidence intervals were estimated by multiple logistic regression models after controlling for age.
Abbreviation: AOR: adjusted odds ratio.
TABLE 3.
Odds ratios (ORs) and 95% confidence intervals (CIs) of the clinical status and PTX3 rs2120243 and rs3816527 genotypic frequencies in 705 patients with prostate cancer.
| Variable | rs2120243 | rs3816527 | ||||||
|---|---|---|---|---|---|---|---|---|
| CC (N = 297) | CA + AA (N = 408) | OR (95% CI) | p‐value | AA (N = 415) | AC + CC (N = 290) | OR (95% CI) | p‐value | |
| PSA at diagnosis (ng/mL) | ||||||||
| ≤10 | 142 (47.8%) | 193 (47.3%) | 1.000 | 0.894 | 206 (49.6%) | 129 (44.5%) | 1.000 | 0.177 |
| >10 | 155 (52.2%) | 215 (52.7%) | 1.021 (0.757–1.377) | 209 (50.4%) | 161 (55.5%) | 1.230 (0.910–1.662) | ||
| Pathologic Gleason grade group | ||||||||
| 1 + 2 + 3 | 249 (83.8%) | 336 (82.4%) | 1.000 | 0.604 | 349 (84.1%) | 236 (81.4%) | 1.000 | 0.345 |
| 4 + 5 | 48 (16.2%) | 72 (17.6%) | 1.112 (0.745–1.659) | 66 (15.9%) | 54 (18.6%) | 1.210 (0.814–1.797) | ||
| Clinical T stage | ||||||||
| 1 + 2 | 257 (86.5%) | 350 (85.8%) | 1.000 | 0.777 | 367 (88.4%) | 240 (82.8%) | 1.000 | 0.032 * |
| 3 + 4 | 40 (13.5%) | 58 (14.2%) | 1.065 (0.690–1.643) | 48 (11.6%) | 50 (17.2%) | 1.593 (1.038–2.444) | ||
| Clinical N stage | ||||||||
| N0 | 292 (98.3%) | 399 (96.8%) | 1.000 | 0.624 | 408 (98.3%) | 283 (97.6%) | 1.000 | 0.496 |
| N1 | 5 (1.7%) | 9 (2.2%) | 1.317 (0.437–3.972) | 7 (1.7%) | 7 (2.4%) | 1.442 (0.500–4.155) | ||
| Clinical M stage | ||||||||
| M0 | 294 (99.0%) | 400 (98.0%) | 1.000 | 0.315 | 412 (99.3%) | 282 (97.2%) | 1.000 | 0.032 * |
| M1 | 3 (1.0%) | 8 (2.0%) | 1.960 (0.516–7.451) | 3 (0.7%) | 8 (2.8%) | 3.896 (1.025–14.812) | ||
| Pathologic T stage | ||||||||
| 2 | 159 (53.5%) | 214 (52.5%) | 1.000 | 0.776 | 224 (54.0%) | 149 (51.4%) | 1.000 | 0.497 |
| 3 + 4 | 138 (46.5%) | 194 (47.5%) | 1.044 (0.774–1.409) | 191 (46.0%) | 141 (48.6%) | 1.110 (0.822–1.499) | ||
| Pathologic N stage | ||||||||
| N0 | 278 (93.6%) | 367 (90.3%) | 1.000 | 0.086 | 389 (93.7%) | 256 (88.3%) | 1.000 | 0.011 * |
| N1 | 19 (6.4%) | 41 (9.7%) | 1.635 (0.928–2.878) | 26 (6.3%) | 34 (11.7%) | 1.987 (1.164–3.391) | ||
| Seminal vesicle invasion | ||||||||
| No | 235 (79.1%) | 319 (78.2%) | 1.000 | 0.764 | 328 (79.0%) | 226 (77.9%) | 1.000 | 0.725 |
| Yes | 62 (20.9%) | 89 (21.8%) | 1.057 (0.734–1.524) | 87 (21.0%) | 64 (22.1%) | 1.068 (0.741–1.537) | ||
| Perineural invasion | ||||||||
| No | 81 (27.3%) | 105 (25.7%) | 1.000 | 0.647 | 112 (27.0%) | 74 (25.5%) | 1.000 | 0.663 |
| Yes | 216 (72.7%) | 303 (74.3%) | 1.082 (0.772–1.518) | 303 (73.0%) | 216 (74.5%) | 1.079 (0.767–1.518) | ||
| Lymphovascular invasion | ||||||||
| No | 257 (86.5%) | 336 (82.4%) | 1.000 | 0.134 | 358 (86.3%) | 235 (81.0%) | 1.000 | 0.062 |
| Yes | 40 (13.5%) | 72 (17.6%) | 1.377 (0.905–2.094) | 57 (13.7%) | 55 (19.0%) | 1.470 (0.980–2.205) | ||
| D'Amico classification | ||||||||
| Low risk/intermediate risk | 151 (50.8%) | 199 (48.8%) | 1.000 | 0.588 | 216 (52.0%) | 134 (46.2%) | 1.000 | 0.127 |
| High risk | 146 (49.2%) | 209 (51.2%) | 1.086 (0.805–1.465) | 199 (48.0%) | 156 (53.8%) | 1.264 (0.936–1.707) | ||
| Biochemical recurrence | ||||||||
| No | 202 (68.0%) | 279 (68.4%) | 1.000 | 0.917 | 285 (68.7%) | 196 (67.6%) | 1.000 | 0.760 |
| Yes | 95 (32.0%) | 129 (31.6%) | 0.983 (0.713–1.355) | 130 (31.3%) | 94 (32.4%) | 1.052 (0.762–1.450) | ||
Note: ORs with their 95% CIs were estimated by logistic regression models.
p < 0.05 as statistically significant.
TABLE 4.
Odds ratios (ORs) and 95% confidence intervals (CIs) of the clinical status and PTX3 rs2305619 and rs1840680 genotypic frequencies in 705 patients with prostate cancer.
| Variable | rs2305619 | rs1840680 | ||||||
|---|---|---|---|---|---|---|---|---|
| GG (N = 274) | GA + AA (N = 431) | OR (95% CI) | p‐value | GG (N = 295) | GA + AA (N = 410) | OR (95% CI) | p‐value | |
| PSA at diagnosis (ng/mL) | ||||||||
| ≤10 | 134 (48.9%) | 201 (46.6%) | 1.000 | 0.556 | 142 (48.1%) | 193 (47.1%) | 1.000 | 0.781 |
| >10 | 140 (51.1%) | 230 (53.4%) | 1.095 (0.809–1.483) | 153 (51.9%) | 217 (52.9%) | 1.044 (0.773–1.408) | ||
| Pathologic Gleason grade group | ||||||||
| 1 + 2 + 3 | 232 (84.7%) | 353 (81.9%) | 1.000 | 0.340 | 248 (84.1%) | 337 (82.2%) | 1.000 | 0.514 |
| 4 + 5 | 42 (15.3%) | 78 (18.1%) | 1.221 (0.810–1.839) | 47 (15.9%) | 73 (17.8%) | 1.143 (0.765–1.708) | ||
| Clinical T stage | ||||||||
| 1 + 2 | 238 (86.9%) | 369 (85.6%) | 1.000 | 0.641 | 255 (86.4%) | 352 (85.9%) | 1.000 | 0.824 |
| 3 + 4 | 36 (13.1%) | 62 (14.4%) | 1.111 (0.714–1.728) | 40 (13.6%) | 58 (14.1%) | 1.050 (0.681–1.621) | ||
| Clinical N stage | ||||||||
| N0 | 270 (98.5%) | 421 (97.7%) | 1.000 | 0.425 | 290 (98.3%) | 401 (97.8%) | 1.000 | 0.639 |
| N1 | 4 (1.5%) | 10 (2.3%) | 1.603 (0.498–5.164) | 5 (1.7%) | 9 (2.2%) | 1.302 (0.432–3.925) | ||
| Clinical M stage | ||||||||
| M0 | 271 (98.9%) | 423 (98.1%) | 1.000 | 0.427 | 292 (99.0%) | 402 (98.0%) | 1.000 | 0.323 |
| M1 | 3 (1.1%) | 8 (1.9%) | 1.708 (0.449–6.496) | 3 (1.0%) | 8 (2.0%) | 1.937 (0.510–7.364) | ||
| Pathologic T stage | ||||||||
| 2 | 148 (54.0%) | 225 (52.2%) | 1.000 | 0.639 | 159 (53.9%) | 214 (52.2%) | 1.000 | 0.655 |
| 3 + 4 | 126 (46.0%) | 206 (47.8%) | 1.075 (0.794–1.457) | 136 (46.1%) | 196 (47.8%) | 1.071 (0.793–1.445) | ||
| Pathologic N stage | ||||||||
| N0 | 256 (93.4%) | 389 (90.3%) | 1.000 | 0.141 | 276 (93.6%) | 369 (90.0%) | 1.000 | 0.095 |
| N1 | 18 (6.6%) | 42 (9.7%) | 1.536 (0.865–2.727) | 19 (6.4%) | 41 (10.0%) | 1.614 (0.917–2.842) | ||
| Seminal vesicle invasion | ||||||||
| No | 220 (80.3%) | 334 (77.5%) | 1.000 | 0.377 | 233 (79.0%) | 321 (78.3%) | 1.000 | 0.826 |
| Yes | 54 (19.7%) | 97 (22.5%) | 1.183 (0.814–1.719) | 62 (21.0%) | 89 (21.7%) | 1.042 (0.723–1.502) | ||
| Perineural invasion | ||||||||
| No | 76 (27.7%) | 110 (25.5%) | 1.000 | 0.515 | 82 (27.8%) | 104 (25.4%) | 1.000 | 0.470 |
| Yes | 198 (72.3%) | 321 (74.5%) | 1.120 (0.796–1.577) | 213 (72.2%) | 306 (74.6%) | 1.133 (0.808–1.589) | ||
| Lymphovascular invasion | ||||||||
| No | 236 (86.1%) | 357 (82.8%) | 1.000 | 0.243 | 256 (86.8%) | 337 (82.2%) | 1.000 | 0.100 |
| Yes | 38 (13.9%) | 74 (17.2%) | 1.287 (0.842–1.968) | 39 (13.2%) | 73 (17.8%) | 1.422 (0.933–2.167) | ||
| D'Amico classification | ||||||||
| Low risk/intermediate risk | 140 (51.1%) | 210 (48.7%) | 1.000 | 0.539 | 151 (51.2%) | 199 (48.5%) | 1.000 | 0.488 |
| High risk | 134 (48.9%) | 221 (51.3%) | 1.110 (0.812–1.489) | 144 (48.8%) | 211 (51.5%) | 1.112 (0.824–1.500) | ||
| Biochemical recurrence | ||||||||
| No | 185 (67.5%) | 296 (68.7%) | 1.000 | 0.747 | 201 (68.1%) | 280 (68.3%) | 1.000 | 0.965 |
| Yes | 89 (32.5%) | 135 (31.3%) | 0.948 (0.685–1.312) | 94 (31.9%) | 130 (31.7%) | 0.993 (0.720–1.369) | ||
Note: ORs with their 95% CIs were estimated by logistic regression models.
3.3. Age‐specific effect of PTX3 rs3816527 on PCa progression
Since a genetic anchor of PTX3 rs3816527 with the development of PCa was observed, we next explored whether there is any joint effect of rs3816527 and age on clinical characteristics of PCa. Intriguingly, our stratification analysis revealed that the association of rs3816527 with advanced forms of PCa (AC + CC: AA, pathologically‐confirmed nodal spread, OR, 3.241; 95% CI, 1.079–9.736; p = 0.028) (AC + CC: AA, metastatic tumour, OR, 9.589; 95% CI, 1.139–80.703; p = 0.012) was only detected in the younger age group (≤65 years old at cancer diagnosis) (Table 5). However, such correlation was not seen in the older age group (>65 years old at cancer diagnosis). These data indicate an age‐specific effect of PTX3 rs3816527 on the progression of PCa.
TABLE 5.
Odds ratios (ORs) and 95% confidence intervals (CIs) of the clinical status and PTX3 rs3816527 genotypic frequencies in 705 patients with prostate cancer with different age at diagnosis.
| Variable | Age at diagnosis ≤65 (N = 298) | Age at diagnosis >65 (N = 407) | ||||||
|---|---|---|---|---|---|---|---|---|
| AA (N = 180) | AC + CC (N = 118) | OR (95% CI) | p‐value | AA (N = 235) | AC + CC (N = 172) | OR (95% CI) | p‐value | |
| PSA at diagnosis (ng/mL) | ||||||||
| ≤10 | 100 (55.6%) | 61 (51.7%) | 1.000 | 0.513 | 106 (45.1%) | 68 (39.5%) | 1.000 | 0.262 |
| >10 | 80 (44.4%) | 57 (48.3%) | 1.168 (0.733–1.861) | 129 (54.9%) | 104 (60.5%) | 1.257 (0.843–1.874) | ||
| Pathologic Gleason grade group | ||||||||
| 1 + 2 + 3 | 164 (91.1%) | 100 (84.7%) | 1.000 | 0.091 | 185 (78.7%) | 136 (79.1%) | 1.000 | 0.933 |
| 4 + 5 | 16 (8.9%) | 18 (15.3%) | 1.845 (0.900–3.782) | 50 (21.3%) | 36 (20.9%) | 0.979 (0.605–1.586) | ||
| Clinical T stage | ||||||||
| 1 + 2 | 169 (93.9%) | 103 (87.3%) | 1.000 | 0.059 | 198 (84.3%) | 137 (79.7%) | 1.000 | 0.229 |
| 3 + 4 | 11 (6.1%) | 15 (12.7%) | 2.237 (0.990–5.058) | 37 (15.7%) | 35 (20.3%) | 1.367 (0.820–2.279) | ||
| Clinical N stage | ||||||||
| N0 | 178 (98.9%) | 115 (97.5%) | 1.000 | 0.347 | 230 (97.9%) | 168 (97.7%) | 1.000 | 0.893 |
| N1 | 2 (1.1%) | 3 (2.5%) | 2.322 (0.382–14.109) | 5 (2.1%) | 4 (2.3%) | 1.095 (0.290–4.140) | ||
| Clinical M stage | ||||||||
| M0 | 179 (99.4%) | 112 (94.9%) | 1.000 | 0.012 * | 233 (99.1%) | 170 (98.8%) | 1.000 | 0.753 |
| M1 | 1 (0.6%) | 6 (5.1%) | 9.589 (1.139–80.703) | 2 (0.9%) | 2 (1.2%) | 1.371 (0.191–9.827) | ||
| Pathologic T stage | ||||||||
| 2 | 102 (56.7%) | 69 (58.5%) | 1.000 | 0.758 | 122 (51.9%) | 80 (46.5%) | 1.000 | 0.281 |
| 3 + 4 | 78 (43.3%) | 49 (41.5%) | 0.929 (0.580–1.486) | 113 (48.1%) | 92 (53.5%) | 1.242 (0.837–1.841) | ||
| Pathologic N stage | ||||||||
| N0 | 175 (97.2%) | 108 (91.5%) | 1.000 | 0.028 * | 214 (91.1%) | 148 (86.0%) | 1.000 | 0.111 |
| N1 | 5 (2.8%) | 10 (8.5%) | 3.241 (1.079–9.736) | 21 (8.9%) | 24 (14.0%) | 1.653 (0.887–3.078) | ||
| Seminal vesicle invasion | ||||||||
| No | 149 (82.8%) | 96 (81.4%) | 1.000 | 0.754 | 179 (76.2%) | 130 (75.6%) | 1.000 | 0.891 |
| Yes | 31 (17.2%) | 22 (18.6%) | 1.101 (0.602–2.014) | 56 (23.8%) | 42 (24.4%) | 1.033 (0.652–1.635) | ||
| Perineural invasion | ||||||||
| No | 49 (27.2%) | 39 (33.1%) | 1.000 | 0.281 | 63 (26.8%) | 35 (20.3%) | 1.000 | 0.132 |
| Yes | 131 (72.8%) | 79 (66.9%) | 0.758 (0.457–1.255) | 172 (73.2%) | 137 (79.7%) | 1.434 (0.896–2.294) | ||
| Lymphovascular invasion | ||||||||
| No | 161 (89.4%) | 96 (81.4%) | 1.000 | 0.047 * | 197 (83.8%) | 139 (80.8%) | 1.000 | 0.428 |
| Yes | 19 (10.6%) | 22 (18.6%) | 1.942 (1.000–3.772) | 38 (16.2%) | 33 (19.2%) | 1.231 (0.736–2.059) | ||
| D'Amico classification | ||||||||
| Low risk/intermediate risk | 111 (61.7%) | 65 (55.1%) | 1.000 | 0.258 | 105 (44.7%) | 69 (40.1%) | 1.000 | 0.358 |
| High risk | 69 (38.3%) | 53 (44.9%) | 1.312 (0.819–2.101) | 130 (55.3%) | 103 (59.9%) | 1.206 (0.809–1.797) | ||
| Biochemical recurrence | ||||||||
| No | 128 (71.1%) | 79 (66.9%) | 1.000 | 0.446 | 157 (66.8%) | 117 (68.0%) | 1.000 | 0.796 |
| Yes | 52 (28.9%) | 39 (33.1%) | 1.215 (0.736–2.006) | 78 (33.2%) | 55 (32.0%) | 0.946 (0.622–1.440) | ||
Note: ORs with their 95% CIs were estimated by logistic regression models.
p < 0.05 as statistically significant values in bold.
3.4. Insight of rs3816527 variant into PTX3 protein structure and oligomerization
To gain additional insight of rs3816527 in PTX3 function, structural information of PTX3 protein was predicted (Figure 1). The amino acid residue (A48D) encoded by rs3816527 allele of PTX3 gene is located between two cysteines, C47 and C49. It has been reported that these two cysteine residues exert a vital role in PTX3 covalent oligomerization by establishing inter‐chain symmetric disulfide bridges (C47‐C47 and C49‐C49). 33 Our structural prediction revealed that the presence of polymorphic rs3816527 allele likely facilitates the formation of intra‐chain asymmetric disulfide bonds (C47‐C49), thus altering the quaternary organization and oligomerization of PTX3 protein.
FIGURE 1.
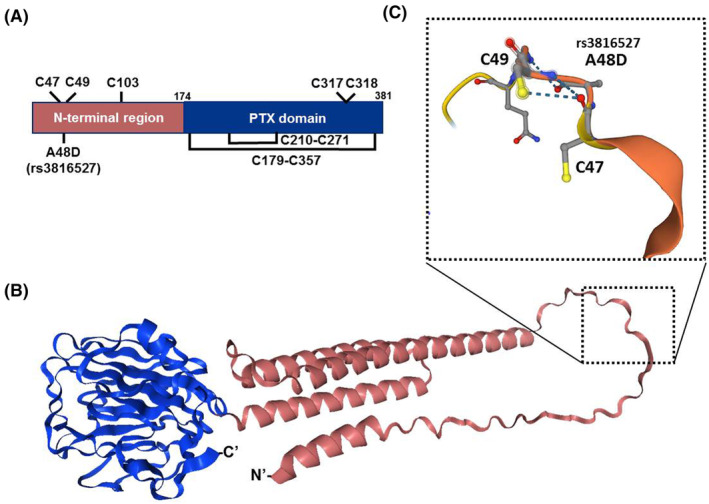
Conformational insights into the human variant (rs3816527) revealed the formation of the quaternary organization through altering orders of PTX3 protein structure. (A) Schematic representing the protein domains of PTX3 monomer (UniProt: P26022), highlighting the locations of cysteine bond networks. The closed loops illustrate the presence of intra‐monomeric disulfide bonds. C47/C49 could participate in intra‐ or inter‐subunit disulfide bonds, and C317/C318 in inter‐tetramer disulfide bonds to form PTX3 oligomerization states. Domain symbols are drawn approximately to scale. The numbering of residues is displayed in colour black. (B) Ribbon diagram (NGL viewer 2.0) for the 3D AlphaFold‐based predicted model of human PTX3 (https://alphafold.ebi.ac.uk/entry/P26022) includes the C‐terminal PTX domain core (Pfam: PF00354; blue) and the N‐terminal tetrameric coiled‐coil domain (red) that is connected by conserved cysteine sulfur bonds. (C) Enlarged view of the selected variant region, displayed in a similar orientation as shown in part (B). The representation used a ball‐and‐stick model and broken lines to mark the hydrogen‐bonding interactions between backbone groups.
3.5. Induction of PTX3 in PCa is required for cell migration and associated with tumour metastasis
We next evaluated PTX3 expression in three androgen‐independent PCa cell lines. Differential expression of PTX3 was observed in cell lines possessing different rs3816527 genotypes, of which PC‐3 cells (homozygous for the minor allele of rs3816527, CC) expressed a substantial level of PTX3 compared to that of Du‐145 (carrying homozygous A allele of rs3816527) and 22Rv1 cells (carrying both A and C allele of rs3816527) (Figure 2A). Silencing of PTX3 gene in PC‐3 cells significantly impaired the potential of cell migration (Figure 2B), suggesting a functional role of PTX3 in PCa cell migration. Moreover, to explore clinical relevance of PTX3 levels in PCa progression, PTX3 expression in several datasets of the Gene Expression Omnibus (GEO) repository was analysed. We found that PTX3 levels of PCa tumour samples were higher than that of normal adjacent prostate tissues in GSE59745 (Figure 3A). In additional three datasets collected for studying PCa metastasis, an elevation of PTX3 expression was consistently detected in metastatic tumours as compared to primary cancer samples (Figure 3B–D). These data collectively support a link of PTX3 induction to cell migration and metastatic response of PCa.
FIGURE 2.
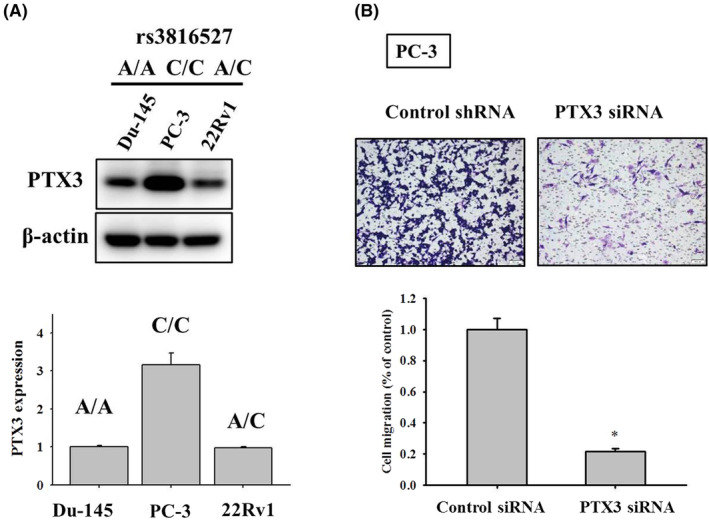
Silencing of PTX3 gene impaired cell migration and clonogenic survival of PCa cells. (A) Basal levels of PTX3 in three PCa cell lines, whose rs3816527 genotypes were determined, were evaluated via immunoblotting. (B) PC‐3 cells transfected with vectors expressing control or PTX3‐specific siRNA were seeded in a modified Boyden chamber for measurement of cell migration. Quantitative data are shown underneath. *p < 0.05 as compared with scramble shRNA controls.
FIGURE 3.
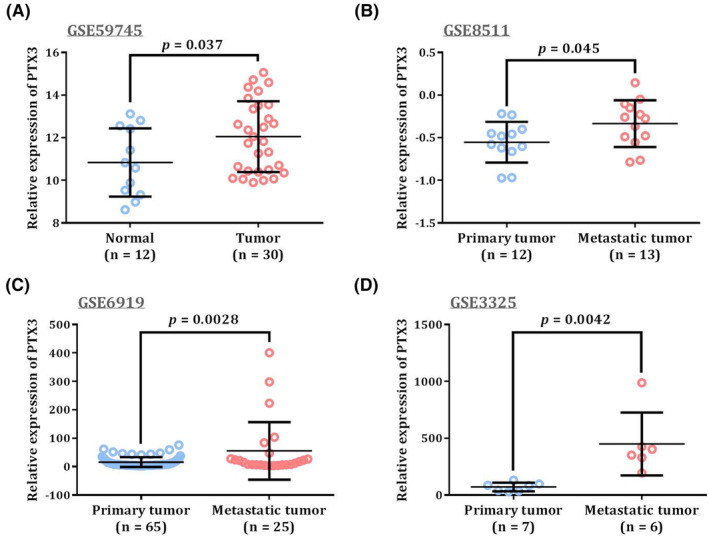
Comparison of PTX3 levels in PCa datasets from the Gene Expression Omnibus (GEO) repository. (A) PTX3 levels between PCa samples and adjacent normal prostate tissues in GSE59745. (B‐D) PTX3 levels between primary and metastatic PCa specimens in GSE8511 (B), GSE6919 (C), and GSE3325 (D). p‐values were calculated between two groups by Student's t‐test.
4. DISCUSSION
It is well recognized that the development and progression of prostate tumorigenesis are under the influence of many genetic components that confer different levels of cancer risk. Here, a correlation between PTX3 rs3816527 variations and an increased propensity for the development of advanced forms of disease was demonstrated in patients with PCa. Surprisingly, such association of rs3816527 with PCa progression was only seen among younger patients, suggesting an impact of age on genetic risks for PCa. Differential expression of PTX3 was observed in PCa cell lines that harbour different rs3816527 genotypes. Our in vitro experiments and survey of publicly available PCa datasets exhibited that elevated expression of PTX3 in PCa was required for cell migration and associated with tumour metastasis. The previous study also revealed that PTX3 promotes breast cancer cell proliferation and metastasis. 34 Collectively, our results revealed a link of PTX3 rs3816527 to the progression of PCa.
Polymorphism (A/C) of rs3816527 in humans gives rise to an amino acid replacement with an alanine residue located at an evolutionarily conserved region of PTX3 protein across the lineage of mammals, all of which, instead, carry an aspartic acid at this position (position 48). 35 PTX3 rs3816527 genotypes have been shown to confer the predisposition to numerous conditions, including microbial infection, 35 , 36 , 37 , 38 hypertension, 39 migraine, 40 and oral malignancy. 25 In an in silico analysis of functional PTX3 SNPs in the defence against infectious pathogens, 41 rs3816527 was predicted as a deleterious non‐synonymous SNP via the SNAP algorithm. 42 This amino acid substitution (D48A) was proposed to damage the electrostatic potential of PTX3 protein structure, thereby affecting interactions with other proteins. 35 In addition, two adjacent positions of PTX3 D48A encode cysteine residues, C47 and C49, which have been shown to establish inter‐subunit symmetric disulfide bridges (C47‐C47 and C49‐C49) in the formation of PTX3 oligomer. 33 However, C47 and C49 of PTX3 can also participate in inter‐subunit asymmetric disulfide bonds (C47‐C49). 43 Our prediction of PTX3 protein structure further supported this notion and revealed a change in the quaternary organization and oligomerization of PTX3 protein due to the disordered nature of this area partly attributed by the presence of polymorphic rs3816527 allele.
In addition to altered protein conformation and ligand binding, expression levels of PTX3 may be also regulated due to polymorphic alleles. It has been reported that the nucleotide substitution (A/C) of rs3816527 severely affected the folding of PTX3 mRNA, indicating a change in mRNA stability. 35 In the same study, lower levels of PTX3 mRNA and protein were detected in promyelocytes carrying homozygous A allele of rs3816527, as compared to those carrying homozygous C allele. Similar genotypic effects on basal levels of PTX3 were also observed among three PCa cell lines examined in our study. Even though the C allele of rs3816527 was also predicted to potentially create a cryptic splicing site for generation of a smaller transcript, alternative splicing is nevertheless unable to be verified. 36 Taken together, our results and findings from others suggest that elevated levels of PTX3 by virtue of altered mRNA secondary structure attributed by rs3816527 genotypes promote cell migration and metastatic potential in PCa.
One intriguing finding of this study is that the correlation of rs3816527 with PCa progression was only detected among younger patients, indicating an impact of age on genetic risks for PCa. It has been noted that for some diseases, genetic risk parameters exhibit stronger explanatory power among younger populations, compared to older ones. 44 Such tendency for genetic risks to decline with increasing age was previously documented in prostate malignancy 45 and other conditions. 46 , 47 , 48 However, genetic risk factors are not equally relevant to human disorders across age contexts, though the reasons for such variation are not clear. By applying a proportional hazards model within an interval‐based censoring methodology to data from the UK Biobank, several aspects of the relationship between age and genetic relative risk have been proposed. 44 First, for some but not all diseases, a non‐constant correlation between age and the influence of genetic risk was statistically verified. In such cases, genetic risks conferred the largest impact at earlier ages, although the trend and magnitude of the drop‐off varied among diseases. Moreover, the drop‐off in genetic association with age cannot be ascribed to hidden variation in unmeasured covariates such as environmental factors. These perspectives support our observation that PCa is one of such diseases affected by age‐varying genetic risk profiles.
This study unveiled an age‐specific effect of PTX3 gene polymorphisms on lymphatic and distal metastasis of PCa. Nevertheless, additional efforts are needed to deal with several limitations of the current work. One is that the mechanism underlying the regulation of PTX3 rs3816527 in PCa progression and spread remains elusive, as serum levels of PTX3 have proved a better performance in identifying PCa patients than the serum PSA curve. 49 More explorations are required to clarify whether PTX3 rs3816527 modulates its own expression at the transcriptional or post‐transcriptional level, and further PTX3 protein crystallization may help to determine whether rs3816527 polymorphisms alter the formation of PTX3 oligomers or perturb its affinity to binding partners. Another concern is that selection bias may arise in age‐stratified analyses. Conducting a longitudinal analysis of PCa risk could be an alternative experimental design to address the impact of age on the association of PTX3 rs3816527 with PCa. In addition, our findings might be merely applicable to unique ethnic populations and require extra replication cohorts to verify the association.
In conclusion, our analysis showed a relationship between PTX3 rs3816527 and the risk for the development of advanced PCa. This genetic susceptibility was only detected among younger cases but not for older ones, indicating an age‐dependent effect of PTX3 polymorphisms on the progression of PCa. Furthermore, increased expression of PTX3 in PCa was found to be indispensable for cancer cell migration and correlated with tumour metastasis. These data link PTX3 gene polymorphisms to the metastatic potential of PCa.
AUTHOR CONTRIBUTIONS
Wei‐Chun Weng: Conceptualization (equal); data curation (equal); writing – original draft (equal); writing – review and editing (equal). Yi‐Hsien Hsieh: Conceptualization (equal); methodology (equal). Chia‐Yen Lin: Data curation (equal); resources (equal). Yu‐Fan Liu: Data curation (equal); software (equal). Shih‐Chi Su: Data curation (equal); methodology (equal); writing – original draft (equal); writing – original draft (equal). Shian‐Shiang Wang: Conceptualization (equal); data curation (equal); resources (equal); writing – review and editing (equal). Shun‐Fa Yang: Conceptualization (equal); data curation (equal); writing – original draft (equal); writing – review and editing (equal).
CONFLICT OF INTEREST STATEMENT
The authors declare no conflicts of interest related to this study.
Weng W‐C, Hsieh Y‐H, Lin C‐Y, et al. Functional variants of the pentraxin 3 gene are associated with the metastasis and progression of prostate cancer. J Cell Mol Med. 2024;28:e70041. doi: 10.1111/jcmm.70041
Contributor Information
Shian‐Shiang Wang, Email: sswdoc@vghtc.gov.tw.
Shun‐Fa Yang, Email: ysf@csmu.edu.tw.
DATA AVAILABILITY STATEMENT
The data used to support the findings of this study are available from the corresponding author upon reasonable request.
REFERENCES
- 1. Bergengren O, Pekala KR, Matsoukas K, et al. 2022 update on prostate cancer epidemiology and risk factors‐a systematic review. Eur Urol. 2023;84(2):191‐206. [DOI] [PMC free article] [PubMed] [Google Scholar]
- 2. Patel AR, Klein EA. Risk factors for prostate cancer. Nat Clin Pract Urol. 2009;6(2):87‐95. [DOI] [PubMed] [Google Scholar]
- 3. Gann PH. Risk factors for prostate cancer. Rev Urol. 2002;4(Suppl 5):S3‐S10. [PMC free article] [PubMed] [Google Scholar]
- 4. Quinn M, Babb P. Patterns and trends in prostate cancer incidence, survival, prevalence and mortality. Part II: individual countries. BJU Int. 2002;90(2):174‐184. [DOI] [PubMed] [Google Scholar]
- 5. Rebbeck TR, Devesa SS, Chang BL, et al. Global patterns of prostate cancer incidence, aggressiveness, and mortality in men of african descent. Prostate Cancer. 2013;2013:560857. [DOI] [PMC free article] [PubMed] [Google Scholar]
- 6. Woolf CM. An investigation of the familial aspects of carcinoma of the prostate. Cancer. 1960;13:739‐744. [DOI] [PubMed] [Google Scholar]
- 7. Leongamornlert D, Saunders E, Dadaev T, et al. Frequent germline deleterious mutations in DNA repair genes in familial prostate cancer cases are associated with advanced disease. Br J Cancer. 2014;110(6):1663‐1672. [DOI] [PMC free article] [PubMed] [Google Scholar]
- 8. Ni Raghallaigh H, Eeles R. Genetic predisposition to prostate cancer: an update. Fam Cancer. 2022;21(1):101‐114. [DOI] [PMC free article] [PubMed] [Google Scholar]
- 9. Daigo K, Inforzato A, Barajon I, et al. Pentraxins in the activation and regulation of innate immunity. Immunol Rev. 2016;274(1):202‐217. [DOI] [PMC free article] [PubMed] [Google Scholar]
- 10. Ma YJ, Garred P. Pentraxins in complement activation and regulation. Front Immunol. 2018;9:3046. [DOI] [PMC free article] [PubMed] [Google Scholar]
- 11. Yang SF, Wu TF, Tsai HT, Lin LY, Wang PH. New markers in pelvic inflammatory disease. Clin Chim Acta. 2014;431:118‐124. [DOI] [PubMed] [Google Scholar]
- 12. Zhang H, Wang R, Wang Z, et al. Molecular insight into pentraxin‐3: update advances in innate immunity, inflammation, tissue remodeling, diseases, and drug role. Biomed Pharmacother. 2022;156:113783. [DOI] [PubMed] [Google Scholar]
- 13. Kao SJ, Yang HW, Tsao SM, et al. Plasma long pentraxin 3 (PTX3) concentration is a novel marker of disease activity in patients with community‐acquired pneumonia. Clin Chem Lab Med. 2013;51(4):907‐913. [DOI] [PubMed] [Google Scholar]
- 14. Doni A, Stravalaci M, Inforzato A, et al. The long pentraxin PTX3 as a link between innate immunity, tissue remodeling, and cancer. Front Immunol. 2019;10:712. [DOI] [PMC free article] [PubMed] [Google Scholar]
- 15. Li D, Hao Z, Nan Y, Chen Y. Role of long pentraxin PTX3 in cancer. Clin Exp Med. 2023;23(8):4401‐4411. [DOI] [PubMed] [Google Scholar]
- 16. Wang JX, He YL, Zhu ST, Yang S, Zhang ST. Aberrant methylation of the 3q25 tumor suppressor gene PTX3 in human esophageal squamous cell carcinoma. World J Gastroenterol. 2011;17(37):4225‐4230. [DOI] [PMC free article] [PubMed] [Google Scholar]
- 17. Rubino M, Kunderfranco P, Basso G, et al. Epigenetic regulation of the extrinsic oncosuppressor PTX3 gene in inflammation and cancer. Onco Targets Ther. 2017;6(7):e1333215. [DOI] [PMC free article] [PubMed] [Google Scholar]
- 18. Bonavita E, Gentile S, Rubino M, et al. PTX3 is an extrinsic oncosuppressor regulating complement‐dependent inflammation in cancer. Cell. 2015;160(4):700‐714. [DOI] [PubMed] [Google Scholar]
- 19. Song T, Wang C, Guo C, Liu Q, Zheng X. Pentraxin 3 overexpression accelerated tumor metastasis and indicated poor prognosis in hepatocellular carcinoma via driving epithelial‐mesenchymal transition. J Cancer. 2018;9(15):2650‐2658. [DOI] [PMC free article] [PubMed] [Google Scholar]
- 20. Choi B, Lee EJ, Park YS, et al. Pentraxin‐3 silencing suppresses gastric cancer‐related inflammation by inhibiting chemotactic migration of macrophages. Anticancer Res. 2015;35(5):2663‐2668. [PubMed] [Google Scholar]
- 21. Ying TH, Lee CH, Chiou HL, et al. Knockdown of pentraxin 3 suppresses tumorigenicity and metastasis of human cervical cancer cells. Sci Rep. 2016;6:29385. [DOI] [PMC free article] [PubMed] [Google Scholar]
- 22. He Q, Li H, Rui Y, et al. Pentraxin 3 gene polymorphisms and pulmonary aspergillosis in chronic obstructive pulmonary disease patients. Clin Infect Dis. 2018;66(2):261‐267. [DOI] [PubMed] [Google Scholar]
- 23. Feitosa TA, de Souza Sa MV, Pereira VC, et al. Association of polymorphisms in long pentraxin 3 and its plasma levels with COVID‐19 severity. Clin Exp Med. 2023;23(4):1225‐1233. [DOI] [PMC free article] [PubMed] [Google Scholar]
- 24. Carmo RF, Aroucha D, Vasconcelos LR, et al. Genetic variation in PTX3 and plasma levels associated with hepatocellular carcinoma in patients with HCV. J Viral Hepat. 2016;23(2):116‐122. [DOI] [PubMed] [Google Scholar]
- 25. Yeh CM, Lin CW, Chuang CY, et al. Functional genetic variant of long pentraxin 3 gene is associated with clinical aspects of Oral cancer in male patients. Front Oncol. 2019;9:581. [DOI] [PMC free article] [PubMed] [Google Scholar]
- 26. Sun YH, Chou YH, Wang CH, et al. Impact of pentraxin 3 genetic variants on uterine cervical cancer clinicopathologic characteristics. Int J Med Sci. 2021;18(11):2339‐2346. [DOI] [PMC free article] [PubMed] [Google Scholar]
- 27. Eeles RA, Kote‐Jarai Z, Giles GG, et al. Multiple newly identified loci associated with prostate cancer susceptibility. Nat Genet. 2008;40(3):316‐321. [DOI] [PubMed] [Google Scholar]
- 28. Kote‐Jarai Z, Easton DF, Stanford JL, et al. Multiple novel prostate cancer predisposition loci confirmed by an international study: the PRACTICAL consortium. Cancer Epidemiol Biomarkers Prev. 2008;17(8):2052‐2061. [DOI] [PMC free article] [PubMed] [Google Scholar]
- 29. Zheng SL, Sun J, Wiklund F, et al. Cumulative association of five genetic variants with prostate cancer. N Engl J Med. 2008;358(9):910‐919. [DOI] [PubMed] [Google Scholar]
- 30. Schumacher FR, Al Olama AA, Berndt SI, et al. Association analyses of more than 140,000 men identify 63 new prostate cancer susceptibility loci. Nat Genet. 2018;50(7):928‐936. [DOI] [PMC free article] [PubMed] [Google Scholar]
- 31. Jumper J, Evans R, Pritzel A, et al. Highly accurate protein structure prediction with AlphaFold. Nature. 2021;596(7873):583‐589. [DOI] [PMC free article] [PubMed] [Google Scholar]
- 32. Lu KH, Su SC, Lin CW, et al. Melatonin attenuates osteosarcoma cell invasion by suppression of C‐C motif chemokine ligand 24 through inhibition of the c‐Jun N‐terminal kinase pathway. J Pineal Res. 2018;65(3):e12507. [DOI] [PubMed] [Google Scholar]
- 33. Inforzato A, Rivieccio V, Morreale AP, et al. Structural characterization of PTX3 disulfide bond network and its multimeric status in cumulus matrix organization. J Biol Chem. 2008;283(15):10147‐10161. [DOI] [PubMed] [Google Scholar]
- 34. Wu J, Yang R, Ge H, Zhu Y, Liu S. PTX3 promotes breast cancer cell proliferation and metastasis by regulating PKCζbreast cancer, pentraxin 3, protein kinase Cζ, proliferation, metastasis. Exp Ther Med. 2024;27(3):124. [DOI] [PMC free article] [PubMed] [Google Scholar]
- 35. Cunha C, Aversa F, Lacerda JF, et al. Genetic PTX3 deficiency and aspergillosis in stem‐cell transplantation. N Engl J Med. 2014;370(5):421‐432. [DOI] [PubMed] [Google Scholar]
- 36. Herrero‐Sanchez MC, Angomas EB, de Ramon C, et al. Polymorphisms in receptors involved in opsonic and nonopsonic phagocytosis, and correlation with risk of infection in Oncohematology patients. Infect Immun. 2018;86(12):e00709. [DOI] [PMC free article] [PubMed] [Google Scholar]
- 37. Campos CF, Leite L, Pereira P, et al. PTX3 polymorphisms influence cytomegalovirus reactivation after stem‐cell transplantation. Front Immunol. 2019;10:88. [DOI] [PMC free article] [PubMed] [Google Scholar]
- 38. Tang T, Dai Y, Zeng Q, et al. Pentraxin‐3 polymorphisms and pulmonary fungal disease in non‐neutropenic patients. Ann Transl Med. 2020;8(18):1142. [DOI] [PMC free article] [PubMed] [Google Scholar]
- 39. Badr EA, Hamoda GE, Tayel SI, Elshayeb EI. Association of genetic variants of pentraxin 3 rs3816527 with hypertension in chronic kidney disease patients. Mol Cell Biochem. 2017;425(1–2):203‐212. [DOI] [PubMed] [Google Scholar]
- 40. Zandifar A, Iraji N, Taheriun M, Tajaddini M, Javanmard SH. Association of the long pentraxin PTX3 gene polymorphism (rs3816527) with migraine in an Iranian population. J Neurol Sci. 2015;349(1–2):185‐189. [DOI] [PubMed] [Google Scholar]
- 41. Thakur R, Shankar J. In silico analysis revealed high‐risk single nucleotide polymorphisms in human Pentraxin‐3 gene and their impact on innate immune response against microbial pathogens. Front Microbiol. 2016;7:192. [DOI] [PMC free article] [PubMed] [Google Scholar]
- 42. Bromberg Y, Yachdav G, Rost B. SNAP predicts effect of mutations on protein function. Bioinformatics. 2008;24(20):2397‐2398. [DOI] [PMC free article] [PubMed] [Google Scholar]
- 43. Noone DP, Dijkstra DJ, van der Klugt TT, et al. PTX3 structure determination using a hybrid cryoelectron microscopy and AlphaFold approach offers insights into ligand binding and complement activation. Proc Natl Acad Sci USA. 2022;119(33):e2208144119. [DOI] [PMC free article] [PubMed] [Google Scholar]
- 44. Jiang X, Holmes C, McVean G. The impact of age on genetic risk for common diseases. PLoS Genet. 2021;17(8):e1009723. [DOI] [PMC free article] [PubMed] [Google Scholar]
- 45. Conti DV, Darst BF, Moss LC, et al. Trans‐ancestry genome‐wide association meta‐analysis of prostate cancer identifies new susceptibility loci and informs genetic risk prediction. Nat Genet. 2021;53(1):65‐75. [DOI] [PMC free article] [PubMed] [Google Scholar]
- 46. Mavaddat N, Michailidou K, Dennis J, et al. Polygenic risk scores for prediction of breast cancer and breast cancer subtypes. Am J Hum Genet. 2019;104(1):21‐34. [DOI] [PMC free article] [PubMed] [Google Scholar]
- 47. Isgut M, Sun J, Quyyumi AA, Gibson G. Highly elevated polygenic risk scores are better predictors of myocardial infarction risk early in life than later. Genome Med. 2021;13(1):13. [DOI] [PMC free article] [PubMed] [Google Scholar]
- 48. Simino J, Shi G, Bis JC, et al. Gene‐age interactions in blood pressure regulation: a large‐scale investigation with the CHARGE, global BPgen, and ICBP consortia. Am J Hum Genet. 2014;95(1):24‐38. [DOI] [PMC free article] [PubMed] [Google Scholar]
- 49. Stallone G, Cormio L, Netti GS, et al. Pentraxin 3: a novel biomarker for predicting progression from prostatic inflammation to prostate cancer. Cancer Res. 2014;74(16):4230‐4238. [DOI] [PubMed] [Google Scholar]
Associated Data
This section collects any data citations, data availability statements, or supplementary materials included in this article.
Data Availability Statement
The data used to support the findings of this study are available from the corresponding author upon reasonable request.