Abstract
The secondary structure of lipase 1 from Candida rugosa, a model system for large monomeric enzymes, has been studied by FTIR (Fourier-transform infrared) spectroscopy in water and 2H2O. The secondary structure content, determined by the analysis of the amide I band absorption through second derivative and curve fitting procedures, is in agreement with that estimated by X-ray data and predicts, in addition, the existence of two classes of α-helices. We have also investigated the enzyme stability and aggregation at high temperature by following the protein unfolding. The thermal stability determined by FTIR is in excellent agreement with the temperature dependence of the lipase activity. Furthermore, new insights on the glycosylation of the recombinant protein produced in Pichia pastoris and on its heterogeneity related to different fermentation batches were obtained by the analysis of the IR absorption in the 1200−900 cm−1 carbohydrate region. A drastic reduction of the intensity of this band was found after enzymic deglycosylation of the protein. To confirm that the FTIR absorption in the 1200–900 cm−1 region depends on the carbohydrate content and glycoform distribution, we performed an MS analysis of the protein sugar moieties. Glycosidic structures of the high mannose type were found, with mannoses ranging from 8 to 25 residues.
Keywords: Candida rugosa lipase, conformational stability, heterologous protein glycosylation, infrared spectroscopy, MS, secondary structure
Abbreviations: CRL1, Candida rugosa lipase 1; FSD, Fourier-self-deconvolution; FTIR, Fourier-transform infrared; MALDI-MS, matrix-assisted laser-desorption ionization MS; NAG, N-acetylglucosamine; PNGase F, peptide N-glycosidase F
INTRODUCTION
The post-genomic era is witnessing the high-throughput production of recombinant proteins from both prokaryotic and eukaryotic organisms. In this scenario, the availability of simple techniques providing insight into their structural, conformational and functional properties would be of great help.
FTIR (Fourier-transform infrared) spectroscopy is emerging as a powerful technique for the determination of the secondary structure of proteins in solution, with no restriction on their molecular mass. As widely reviewed in the literature [1–4], quantitative information on the secondary-structure elements of the protein can be obtained by the analysis of the amide I absorption in the 1700 –1600 cm−1 region. This band originates from the C=O stretching vibration of the peptide group, whose frequency depends on the hydrogen-bonding and coupling along the protein chain, and is therefore sensitive to the protein conformation. Prediction of the protein secondary structure can be obtained by the decomposition of the amide I band into its components through curve fitting procedures [2,5,6].
Here, we present an FTIR study of the enzyme CRL1 (Candida rugosa lipase 1) with the purpose of assessing the usefulness of this technique for the analysis of conformation and post-translational modifications of this enzyme, taken as a model for large monomeric enzymes of interest in both basic and applied research [7].
CRL1 is a globular protein of 57 kDa, produced as a recombinant product from Pichia pastoris [8]. Its crystal structure has been determined at 2 Å (1 Å=0.1 nm) resolution [9,10]. Information about the structure of CRL1 in solution is not available to date and cannot be obtained by NMR due to the large size of the protein. However, it is well known that lipase activity is strongly conformation-dependent and extremely sensitive to experimental conditions, such as detergents, pressure and solvents. The most significant conformational change, which is crucial for the enzymic activity, is the movement of a surface loop – the lid – on enzyme activation by interaction with the substrate. Noinville et al. [11] have recently investigated this phenomenon in the Humicola lanuginosa lipase through FTIR-attenuated total reflection spectroscopy [11]. Indeed, conformational changes and structural stability have been successfully studied by FTIR spectroscopy for a large number of proteins, including lipases [11–16].
In the present study, we report the determination by FTIR spectroscopy of the CRL1 secondary structure in water solution and in 2H2O. Its quantitative composition in water was compared with X-ray data. We have also investigated the enzyme stability and aggregation at high temperature by monitoring protein unfolding in the temperature range 20–100 °C.
Furthermore, we explored the potential of FTIR spectroscopy for the study of the recombinant protein glycosylation through the analysis of the carbohydrate band in the region 1200–900 cm−1. The new results presented in this study strongly indicate that FTIR spectroscopy can offer a reliable tool for the characterization of this post-translational modification, which is a major issue in recombinant protein production.
EXPERIMENTAL
Production, purification and deglycosylation of recombinant lipase 1
Recombinant CRL1 was expressed and secreted by P. pastoris as described in [8]. Cultures were grown in a minimal medium to decrease the secretion of contaminant proteins. Growth was for 7 days in shaking flasks (shaking rate, 150 rev./min) at 30 °C, in a minimal medium containing 1.3% (w/v) yeast nitrogen base, 2% (w/v) glucose and 0.1 M phosphate buffer (pH 6). Lipase was recovered from the culture supernatant by centrifugation at 20000 g and concentrated by tangential-flow filtration against deionized water with a Minitan System (Millipore, MA, U.S.A.). CRL1 was then purified by chromatography on phenyl-Sepharose HP (Amersham Biosciences, Uppsala, Sweden) in an FPLC-GP250 PLUS apparatus (Amersham Biosciences). Elution was obtained at a flow rate of 1.5 ml/min, by a 100 –0% linear gradient of 1 M (NH4)2SO4 in 10 mM Tris/HCl (pH 7.4). After dialysis versus deionized water, the protein solution for FTIR measurements in water was concentrated to 10 –20 mg/ml by using Amicon 30 kDa cut-off filter devices (Centricon Plus-20; Millipore, Bedford, MA, U.S.A.). Protein concentration was determined by the method of Bradford [17] taking BSA as a standard, using the Bio-Rad kit (Bio-Rad) [17].
For FTIR measurements in 2H2O, the same sample was freezedried and re-dissolved in 2H2O.
Approximately 70 μg of CRL1 purified by hydrophobic-exchange chromatography was deglycosylated in two subsequent steps by the addition of a total amount of 100 units of PNGase F (peptide N-glycosidase F; Sigma). CRL1 was denatured by heating (4 min at 99 °C) before the addition of 50 units of PNGase and the reaction was performed for 48 h at 37 °C in water (final volume, 55 μl). After the addition of 50 units of enzyme, the reaction mixture was further incubated at 37 °C for 24 h. For the FTIR study, released sugars were removed by centrifugation on Amicon 30 kDa cut-off filter devices (Centricon Plus-20).
FTIR measurements
FTIR absorption spectra from 4000 to 700 cm−1 were collected in transmission using an FTS-40A spectrometer (Bio-Rad, Digilab Division, Cambridge, MA, U.S.A.) equipped with a DTGS (deuterated triglycine sulphate) detector and air dryer purging system, at 1 and 2 cm−1 resolution, a scan speed of 5 kHz, 256 scans co-addition and triangular apodization. Protein solution (15 μl), at a concentration of 10 –20 mg/ml, was placed in a temperature-controlled transmission cell (Wilmad, Buena, NJ, U.S.A.), with BaF2 windows and Teflon spacers of 15 μm for water and 30 μm for 2H2O. For thermal unfolding from 20 to 100 °C, the sample was heated at a rate of 0.2 °C/min, each spectrum being collected every 2 °C.
FTIR data analysis
The protein FTIR spectra were obtained after subtraction of the solvent absorption, strictly collected under the same conditions, by adjusting the subtraction factor until a flat baseline was obtained in the 2000 –1700 cm−1 region [4,18,19]. Furthermore, subtraction of residual vapour absorption was also performed when necessary.
Second derivative spectra were obtained following the Savitsky–Golay method (3rd grade polynomial, five smoothing points), after a binomial 11 points smoothing of the spectrum.
Curve fitting of the amide I band from 1700 to 1600 cm−1, in water, was performed by GRAMS/32 (Galactic Industries Corporation, Salem, NH, U.S.A.) as a linear combination of Gaussian components. In the fitting, the number of components and initial values of their peak positions were taken from the second derivative spectrum. For the choice of the initial values of the Gaussian intensities, we followed the approach of Arrondo et al. [2,6], performing first an FSD (Fourier-self-deconvolution) of the amide I band [2,5] by Win-IR Pro software (Bio-Rad, Digilab Division). By using an enhancement factor K=2.9 and half-bandwidth HW=14 cm−1, we obtained an FSD spectrum displaying the same number of components and peak positions as the second derivative spectrum (results not shown). The FSD peak intensities, adjusted to fit the amide I absorption profile, were then taken as initial values for the Gaussian intensities [2,6]. As initial values for the Gaussian bandwidths, we chose a constant value from the FSD spectrum. Taking the above values as initial parameters, we performed curve fitting of the amide I band by leaving the parameters free to adjust iteratively, with the only restriction on the peak wavenumbers being to vary within a range of ±2 cm−1.
GC-MS and MALDI-MS (matrix-assisted laser-desorption ionization MS) analyses
For the GC-MS carbohydrate analysis, purified CRL1 was dissolved in 500 μl of 1 M methanolic HCl and heated at 80 °C for 16 h. The sample was then dried and re-N-acetylated at room temperature for 15 min with 50 μl of acetic anhydride in 500 μl of methanol containing 10 μl of pyridine. Monosaccharide trimethylsilylation was performed in 100 μl of N,O-bis(trimethylsilyltrifluoroacetamide) at 70 °C for 15 min. The sample was then dried, dissolved in 50 μl of hexane and used for GC-MS analysis.
The GC-MS analysis was performed on an Agilent Technologies MSD 5973N instrument (Palo Alto, CA, U.S.A.) using a fused silica capillary column (30 m, 0.5 mm internal diameter, 0.25 μm) from Hewlett–Packard. The injection temperature was 250 °C and the oven temperature was increased linearly from 90 to 250 °C at a rate of 8 °C/min. In the resulting chromatogram, peaks corresponding to mannose and NAG (N-acetylglucosamine) were assigned by both retention time and their fragmentation spectra.
For the analysis of protein glycoforms, CRL1 (200 μg) was digested with trypsin in 50 mM ammonium bicarbonate (pH 8.5) for 4 h at 37 °C, using an enzyme-to-substrate ratio of 1:25. The sample was then freeze-dried and deglycosylated by an overnight treatment with PNGase F (0.25 units) in 50 mM ammonium bicarbonate (pH 8.5) at 37 °C. The released N-linked oligosaccharides were purified by Sep-pak chromatography, freeze-dried and N-acetylated with acetic anhydride in pyridine (5:1, v/v) at 80 °C for 2 h. The sample was dried, re-dissolved in 0.1% trifluoroacetic acid and used for MALDI-MS analysis.
MALDI-MS analysis of oligosaccharides was performed on a Voyager DE PRO instrument (Applied Biosystems, Foster City, CA, U.S.A.). Typically, 1 μl of analyte solution was mixed with 1 μl of 2,5-dihydroxybenzoic acid (20 mg/ml) in acetonitrile/0.1% trifluoroacetic acid (70:30, v/v). Mass values are reported as average masses.
RESULTS AND DISCUSSION
FTIR absorption spectrum of CRL1 in solution
CRL1 is known to be a mixture of isoenzymes related to each other by high similarity in their amino acid sequences [20]. Therefore some heterogeneity may be expected in the isoenzyme conformation, in the relative amount of each isoform, as well as in the degree of protein glycosylation. For these reasons, to obtain a reliable evaluation of the secondary structure and other properties such as glycosylation and thermal stability, the present study was performed on the pure recombinant isoform 1 (CRL1) obtained from a synthetic coding sequence [8]. This protein was originally expressed in P. pastoris under the control of a methanol-inducible promoter. However, expression driven by the constitutive glyceraldehyde 3-phosphate dehydrogenase promoter (commercially available in plasmid pGAP from Invitrogen) was found to result in a lower secretion of endogenous Pichia proteins and therefore in a lower level of contaminant proteins. Highly purified, active recombinant lipase was obtained from culture supernatants by hydrophobic chromatography, with a final yield of approx. 50 mg of pure CRL1 from 1 litre of culture.
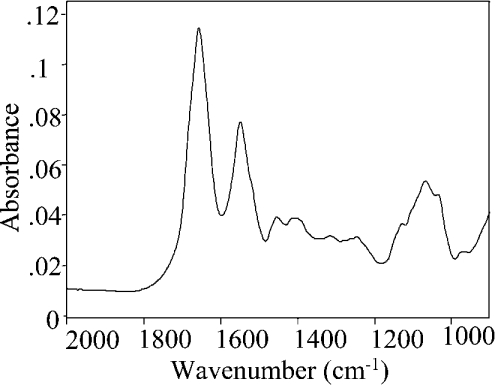
CRL1 conforms to the α/β hydrolases fold with a complex secondary structure [9,10,21]. The FTIR absorption spectrum in water is reported in Figure 1, after subtraction of solvent and vapour as described in the previous section. The major protein absorption bands due to the peptide group vibrations occur in the 1900 –1200 cm−1 spectral region: the amide I band (1700–1600 cm−1) mainly due to the C=O stretching vibrations, amide II (1580–1510 cm−1) due to the N–H bending with a contribution of the C–N stretching vibrations and, with weaker intensity, amide III (1400–1200 cm−1) due to the N–H bending, C–Cα and C–N stretching vibrations. Furthermore, Figure 1 shows in the 1200 –900 cm−1 region an important absorption of the protein-associated sugar chains, which will be analysed in a separate section.
Figure 1. FTIR absorption spectrum of CRL1.
FTIR spectrum of 1.7 mM CRL1 at 20 °C, after water subtraction, at 2 cm−1 spectral resolution.
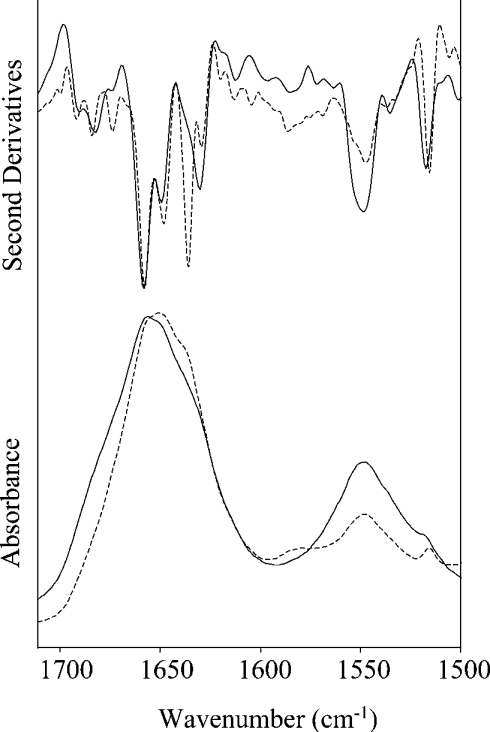
Here, we examine the amide I absorption band, since this band is most sensitive to the secondary structure of the protein [2–6]. Figure 2 shows the absorption spectrum of the protein in water in the 1700 –1500 cm−1 region obtained at 2 cm−1 resolution, and its second derivative spectrum, where minima allow identification of the absorption band components. Indeed, because of their large bandwidth and small spectral separations, they cannot be directly resolved in the absorption spectrum. These components are due to the secondary-structure elements of the protein, since the C=O stretching vibration is differently affected in the different backbone conformations by hydrogen bonds and dipole interactions.
Figure 2. Amide I and II bands of CRL1.
FTIR absorption spectra and their second derivatives at 20 °C in water (———; 2 cm−1 resolution) and in 2H2O (---; 1 cm−1 resolution).
In Figure 2, we also present the protein absorption in 2H2O to confirm the results obtained in water. Owing to the much lower absorption of the 2H2O solvent in the region 1700–1500 cm−1, a better signal-to-noise ratio was obtained and a higher resolution spectrum (1 cm−1) is presented. A shift towards the lower wave-numbers was observed for the amide I band in 2H2O, together with a decrease in intensity for the amide II band, both indicating that hydrogen–deuterium exchange occurred in the protein [14,22]. The second derivative amide I spectrum is similar to that of the protein in water. Indeed, the secondary-structure components, highly resolved in 2H2O, occurred at peak positions very close to those found in water (see Table 1), indicating that the secondary-structure peptide hydrogens are not involved in the exchange. Their relative intensities are also similar, except for the peak at 1635.8 cm−1.
Table 1. Secondary structure of CRL1 in solution at 20 °C from amide I band analysis.
| Component band position wavenumber (cm−1) from second derivative spectrum* | Best-fit Gaussian components of amide I in water | ||||
|---|---|---|---|---|---|
| 2H2O | Water | Band position wavenumber (cm−1) | Relative area (%) | Assignment of components† | Secondary-structure relative content estimated from X-ray (%)‡ |
| 1691.7 | 1690.9 | 1691.8±0.7 | 3.1±0.7 | β-Sheet/turns | |
| 1683.9 | 1682.5 | 1682.2±0.3 | 9.9±1.7 | Turns | |
| 1673.5 | 1672.7 | 1670.3±0.4 | 17.9±0.4 | Turns | |
| 1657.6 | 1657.9 | 1658.1±0.4 | 23.8±1.9 | α-Helix | |
| 1648.1 | 1649.4 | 1647.6±0.6 | 17.1±1.6 | α-Helix/unordered | 33.33 |
| 1635.8 | 1637.2 | 1638.3±0.7 | 12.3±2.1 | β-Sheet | |
| 1629.2 | 1630.0 | 1629.4±0.5 | 11.1±1.3 | β-Sheet | 12.36 |
| 1619.5 | 1619.0 | 1620.0±0.5 | 4.8±1.1 | Aggregated strands/side chains | |
The amide I components of CRL1 were then assigned to the different secondary-structure elements according to studies on model compounds and on proteins of known secondary structure [5,23].
Two major bands at 1657.9 and 1649.4 cm−1 can be assigned to the α-helix structures of the protein (see Table 1). The β-sheet component, observed in water at 1630.0 cm−1 with a shoulder around 1637 cm−1, appears well resolved into two components in the 2H2O, with a higher intensity for the 1635.8 cm−1 peak, as already reported in the literature for other proteins [14]. Furthermore, the bands around 1682 and 1673 cm−1 can be assigned to turns, whereas that at 1691 cm−1 can be assigned to β-sheet and turns. The 1619.0 cm−1 component can instead be attributed to side chains and aggregates [2,4,22,24].
A similar FTIR amide I assignment has been proposed for the homologous acetylcholinesterase [22].
CRL1 secondary structure as predicted by curve fitting of amide I
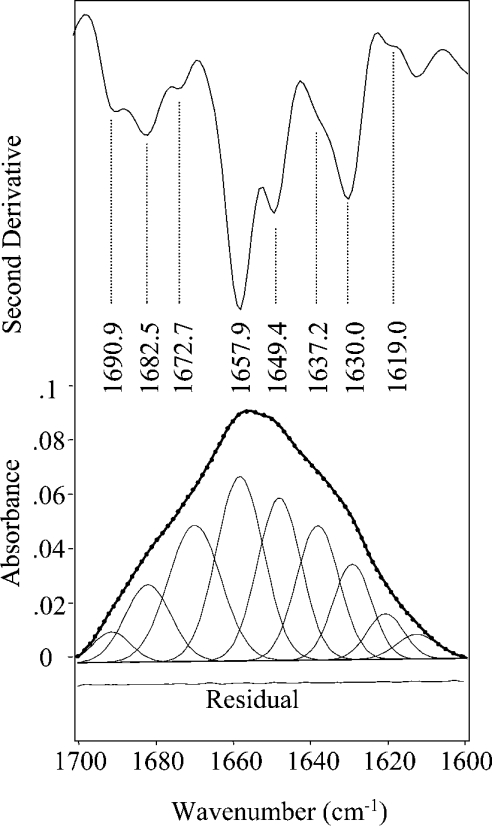
To obtain quantitative information about the protein secondary structures in water, a curve fitting analysis of the amide I absorption band was performed as a linear combination of the components identified in the second-derivative spectrum. These components were approximated by Gaussian functions whose peak positions, widths and heights were adjusted iteratively in the curve-fitting procedure. Since the choice of the initial values is crucial for the result of a fitting with a large number of parameters, the Gaussian initial parameters (peaks, band widths and intensities) were determined following the procedure suggested by Arrondo et al. [6]. In the minimization procedure, the parameters of the Gaussian components were left free to adjust iteratively, with the only restriction on the peak wavenumbers being to vary within a range of ±2 cm−1. The outcome of the fitting is presented in Figure 3, where the Gaussian components of the best fit are also reported. Their band position and areas are given in Table 1. The band area of each component, expressed as a percentage of the total amide I area, can be then taken as a measure of the secondary structure assigned to it, assuming that the peptide bond molar absorptivities were the same for the different secondary structures of the protein [3,5,6]. Actually, when the number of adjustable parameters is large, a fitting does not necessarily lead to a unique solution. For this reason, the reliability of the fitting procedure was evaluated by the analysis of spectral data obtained for 11 independent samples of CRL1. The S.D. of the measured data and of the best-fit parameters are reported in Table 1. Excellent agreement is found for the band positions of the best-fit Gaussian components with those determined from the second derivative spectra, taking also into account that these parameters were left free to adjust in a wavenumber range of ±2 cm−1. All these results support, therefore, the reliability of the fitting and the predicted secondary structure of the protein.
Figure 3. Decomposition of amide I band into Gaussian components.
Second derivative spectrum of CRL1 in water and amide I curve fitting into Gaussian components, as described in the text. ———, measured absorption spectra; -●-●-●-, curve-fitted spectrum (reduced χ2=0.000002, correlation R2=0.99996).
Native conformation and thermal unfolding of CRL1
The native conformation of CRL1 in water solution is summarized in Table 1, with the α-helical structures (1657.9 and 1649.4 cm−1) accounting for approx. 40% of the total structures, β-sheets (1630.0 and 1637.2 cm−1) for 23% and turns (1672.7 and 1682.5 cm−1) for 28%. Despite the higher α-helix and β-sheet content predicted by FTIR (see Table 1), this structure is in good agreement with that obtained by X-ray studies [9]. As already discussed in the literature [25], this discrepancy can be due to the absorption of unordered structures, which overlaps those of the α-helix and the β-sheet. Actually, the specific contribution of unordered structures, due to their large bandwidth, cannot be singled out in the amide I derivative spectrum and cannot therefore be taken into account by the FTIR data analysis.
Moreover, it should be noted that, when the secondary structure of CRL1 determined by FTIR spectroscopy is compared with that obtained from X-ray studies, the percentage of structures evaluated from X-ray data might be affected by uncertainties in the definition of the boundaries of secondary-structure elements [5]. In addition, the different environments in the crystal and solution state could also be responsible for structural differences, particularly in a flexible high-molecular-mass protein such as CRL1 [26,27].
Taking into account these considerations, the agreement between the protein secondary structure as obtained by FTIR and by X-rays can be considered highly satisfactory.
It is noteworthy that FTIR spectroscopy allows the identification of two distinct α-helical structures in the protein, with absorption at 1657.9 and 1649.4 cm−1 (Figures 2 and 3). Also, two β-sheet components are resolved by FTIR spectroscopy. The FTIR evidence for two α-helices in CRL1, as well as for two β-sheets, was also reported for the homologous protein acetylcholinesterase [22] and for several other proteins [27–30].
The presence of two α-helix components reflects a difference in the force constant of the carbonyl vibration. The higher band position at 1657.9 cm−1 corresponds to a stronger carbonyl stretching and weaker hydrogen bonding, leading to more flexible helices [30]. However, this difference in the helix flexibility did not result in any significant hydrogen–deuterium exchange (Figure 2).
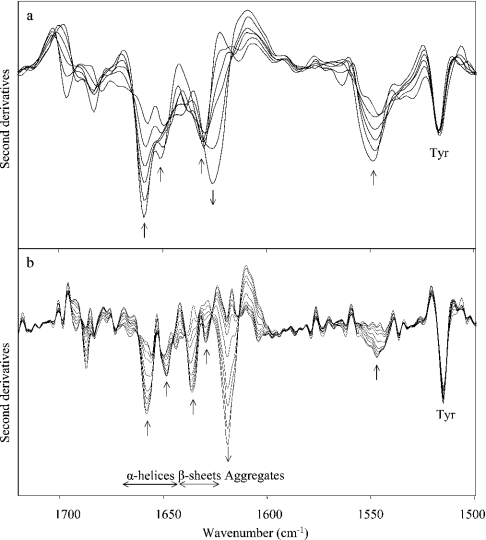
Having determined the secondary structure of native CRL1, its thermal unfolding was investigated in water and 2H2O by heating the sample at a linear rate of 0.2 °C/min. The temperature dependence of the amide I second derivative spectrum (Figure 4a) showed that the native structure of CRL1 in water is preserved up to 50 °C. At higher temperatures, a loss of both α-helix and β-sheet structures is observed. Interestingly, the results obtained by using 2H2O enabled us to monitor the unfolding of each secondary-structure element better than in water, since they appeared well separated in 2H2O (Figure 4b).
Figure 4. Thermal unfolding of CRL1.
Second derivative spectra of CRL1 as a function of temperature in the amide I and II regions at 20–100 °C in (a) water and (b) 2H2O. Spectral resolution as in Figure 2. Arrows point to the direction of increasing temperature.
The temperature dependence of the amide II band, at 1548.7 cm−1 in water (Figure 4a), follows that of the secondary structure components of the amide I band.
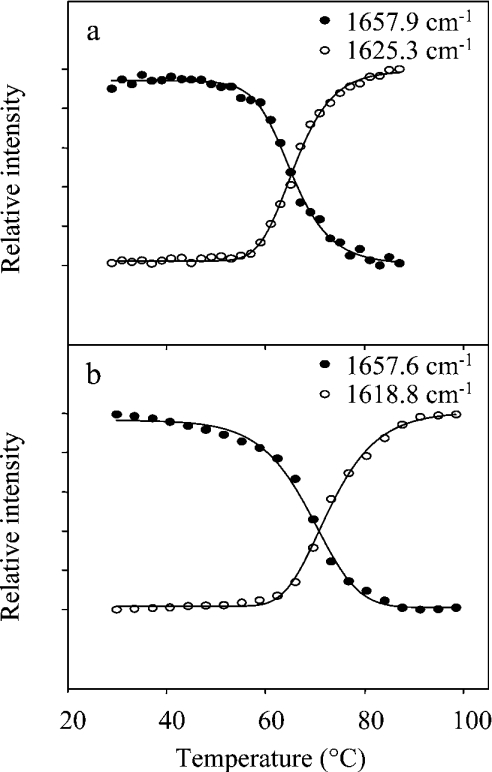
At approx. 64 °C in water and also at 70 °C in 2H2O, the α-helix and β-sheet components decreased simultaneously to 50% of their values, as shown in Figures 5(a) and 5(b). The increase in the midpoint temperature transition in 2H2O is a common feature of other proteins [31].
Figure 5. Temperature dependence of α-helical and aggregated structures of CRL1.
Temperature dependence of α-helix (●) and aggregate (○) components, taken from second derivative spectra of Figure 4 in (a) water and (b) 2H2O. The midpoint transition occurs at approx. 64 °C in water and at 70 °C in 2H2O.
Furthermore, the loss of secondary structure was accompanied by the simultaneous appearance of new bands, at 1625 and 1696 cm−1 in water, due to protein-aggregated structures induced by the thermal treatment [3,24]. In 2H2O, these bands were found at 1619 and 1687 cm−1, a result that clearly shows that hydrogen–deuterium exchange takes place in the aggregates.
Thermal denaturation experiments validated, therefore, the use of FTIR spectroscopy to monitor CRL1 unfolding and aggregation, since the stability of the secondary structure relates well with the temperature dependence of enzymic activity [8]. From this perspective, we believe that FTIR spectroscopy might provide a valuable analytical tool for detecting conformational changes relevant for protein function induced, for example, by site-directed mutagenesis or by processing steps in biocatalysis, such as immobilization or freeze-drying [12,32,33].
Protein glycosylation
CRL1 carries three consensus sequences for N-glycosylation at Asn291, Asn314 and Asn351. Crystallographic analysis of native, purified CRL1 showed sugars linked to the lone 314 and 351 positions [10]. Accordingly, replacement of Asn314 and Asn351 by mutagenesis strongly decreased the enzymic activity, suggesting a functional role for sugar chains in maintaining the enzyme-active conformation [34]. It is known that recombinant proteins expressed in P. pastoris carry oligosaccharide chains composed of two NAG units and a variable number of mannose residues, depending on the fermentation conditions [35]. The carbohydrate content of recombinant CRL1 expressed in P. pastoris was evaluated to be 5% of its weight [8], but the composition of the sugar moiety was not investigated further.
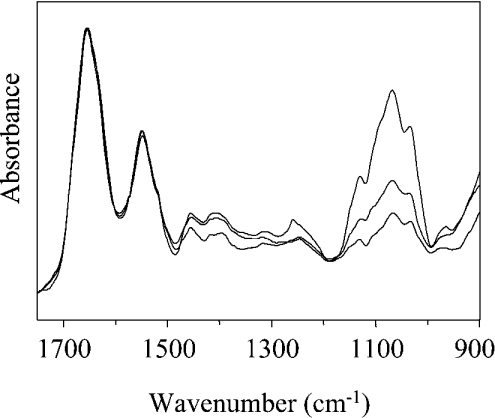
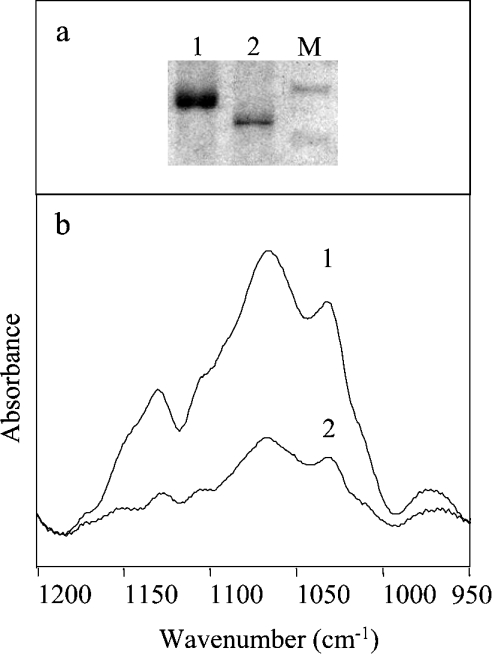
One of the goals of the present study was to explore the potential of FTIR spectroscopy for the analysis of protein glycosylation. The absorption spectra of protein samples obtained from different fermentations and purification batches are reported in Figure 6 for the region 1750 –900 cm−1, after normalization at the amide I peak. Remarkable differences can be observed in the intensity of the carbohydrate band in the region 1200 –900 cm−1. These differences are expected to reflect the heterogeneity in protein glycosylation, which might occur in different fermentation batches. First, the effect of the enzymic deglycosylation on the intensity of the IR carbohydrate band was investigated. A sample of recombinant CRL1 was subjected to treatment with deglycosydase PNGase F until full deglycosylation was observed in SDS/PAGE (Figure 7a). Comparison of the absorption spectra of the protein before and after enzymic treatment (Figure 7b) showed a drastic reduction in the band intensity after the enzyme treatment, confirming that the 1200–900 cm−1 band is due to the absorption of protein carbohydrates. Interestingly, a residual carbohydrate band was observed in the FTIR spectrum of the PNGase F-treated protein (Figure 7b), suggesting the presence of a small amount of residual sugars. This result, which cannot be obtained by SDS/PAGE, relies on the high sensitivity of FTIR to carbohydrates [36].
Figure 6. Glycosylation of CRL1.
FTIR absorption spectra from 1750 to 900 cm−1 of three samples (1.7 mM) obtained from independent protein productions. Differences in the intensity of the carbohydrate 1200–900 cm−1 band are observed after normalization of the spectra on the amide I peak.
Figure 7. Deglycosylation of CRL1.
(a) SDS/PAGE of the CRL1 sample examined in (b), before lane (1) and after lane (2) PNGase F digestion. Molecular-mass standards (M) refer to 62 and 47.5 kDa. (b) FTIR absorption spectra in the carbohydrate region of CRL1 (1) and of CRL1 treated by deglycosydase (2), after normalization for protein content at the 1517 cm−1 tyrosine peak.
To confirm that the FTIR spectral differences observed in the 1200 –900 cm−1 region are due to a different carbohydrate content and glycoform distribution, we performed a detailed structural characterization of the glycosidic moiety of the recombinant protein essentially using MS methodologies [37–39]. As a first step, the carbohydrate content of CRL1 was determined by GC-MS (results not shown). The chromatogram showed the occurrence of peaks corresponding to mannose and NAG components, identified through their retention time and individual fragmentation spectra, thus excluding the presence of other carbohydrates in the samples.
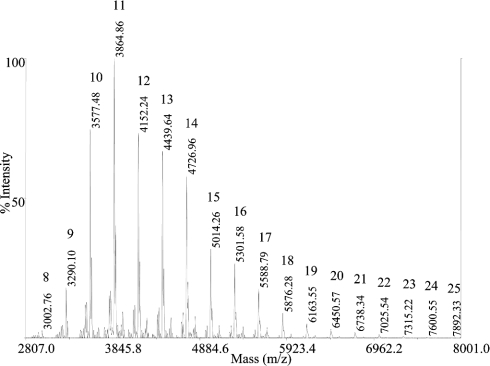
The heterogeneity in the protein glycosylation was studied by MALDI-MS analysis of the mixture glycoforms released from CRL1. The mass spectral analysis of the oligosaccharides is reported in Figure 8, where glycoforms can be identified by their unique mass values [37,39]. Only glycosidic structures of the high mannose type were observed, with mannoses ranging from 8 to 25 moieties. The most abundant species contain a total of 11 mannose residues. The glycoform distribution of CRL1 from different productions displayed a similar pattern, with minor but significant differences in the population of high mannose chains.
Figure 8. Glycoform analysis of CRL1.
MALDI-MS analysis of the oligosaccharides released from the protein (same sample of spectrum 1 in Figure 7b). Glycans were N-acetylated and directly analysed. Individual glycoforms are identified by their mass value, corresponding to two NAG units and a variable number of mannose residues. For each glycoform, the number of mannoses is reported. All mass signals correspond to the sodium adducts.
Differences in the intensity of the 1200–900 cm−1 band could therefore be due to different glycoform distributions of the protein samples in Figure 6. It is interesting to observe that the secondary structure of these samples, determined by the amide I band analysis described in a previous section, was found to be constant and not affected by the different glycoform distributions, namely by the mannose content of the protein. Enzymic activities of these samples were also similar. These results indicate that the heterogeneity in the mannose content does not affect the protein structure and function, which is expected to be critically dependent on the core of NAG glycosylation [9,10].
In conclusion, analysis of IR absorption in the 1200 –900 cm−1 region reported in the present study enabled us to monitor a different mannose content in proteins produced in different fermentation batches. Macro- and microheterogeneity in glycosylation is a major issue in recombinant protein production, since it can affect activity, biological function and antigenicity of the final product. It is well known that the composition of the sugar moiety at the glycosylation sites is dependent not only on the host used for heterologous expression but also on the culture conditions.
Acknowledgments
We gratefully acknowledge P. Pucci for his help with the MS analysis. This work was partially supported by grants from Fondo di Ateneo per la Ricerca (Università Milano-Bicocca; ex MURST 60%) to S. M. D. and M. L.
References
- 1.Surewicz W. K., Mantsch H. H., Chapman D. Determination of protein secondary structure by Fourier transform infrared spectroscopy: a critical assessment. Biochemistry. 1993;32:389–394. doi: 10.1021/bi00053a001. [DOI] [PubMed] [Google Scholar]
- 2.Arrondo J. L. R., Goni F. M. Structure and dynamics of membrane proteins as studied by infrared spectroscopy. Prog. Biophys. Mol. Biol. 1999;72:367–405. doi: 10.1016/s0079-6107(99)00007-3. [DOI] [PubMed] [Google Scholar]
- 3.Haris P. I., Severcan F. FTIR spectroscopic characterization of protein structure in aqueous and non-aqueous media. J. Mol. Catal. B Enzym. 1999;7:207–221. [Google Scholar]
- 4.Haris P. I., Chapman D. Analysis of polypeptide and protein structures using Fourier transform infrared spectroscopy. In: Jones C., Mulloy B., Thomas A. H., editors. Methods in Molecular Biology, vol. 22: Microscopy, Optical Spectroscopy, and Macroscopic Techniques. Totowa, NJ: Humana Press; 1994. pp. 183–202. [DOI] [PubMed] [Google Scholar]
- 5.Susi H., Byler D. M. Resolution-enhanced Fourier transform infrared spectroscopy of enzymes. Methods Enzymol. 1986;130:291–311. doi: 10.1016/0076-6879(86)30015-6. [DOI] [PubMed] [Google Scholar]
- 6.Arrondo J. L. R., Muga A., Castresana J., Goni F. M. Quantitative studies of the structures of proteins in solution by Fourier-transform infrared spectroscopy. Prog. Biophys. Mol. Biol. 1993;59:23–56. doi: 10.1016/0079-6107(93)90006-6. [DOI] [PubMed] [Google Scholar]
- 7.Schmid R. D., Verger R. Lipases: interfacial enzymes with attractive applications. Angew. Chem. Int. Ed. 1998;37:1608–1633. doi: 10.1002/(SICI)1521-3773(19980703)37:12<1608::AID-ANIE1608>3.0.CO;2-V. [DOI] [PubMed] [Google Scholar]
- 8.Brocca S., Schmidt-Dannert C., Lotti M., Alberghina L., Schmid R. D. Design, total synthesis and functional overexpression of the Candida rugosa gene coding for a major industrial lipase. Protein Sci. 1998;7:1415–1422. doi: 10.1002/pro.5560070618. [DOI] [PMC free article] [PubMed] [Google Scholar]
- 9.Grochulski P., Li Y., Schrag J. D., Bouthillier F., Smith P., Harrison D., Rubin B., Cygler M. Insights into interfacial activation from an open structure of Candida rugosa lipase. J. Biol. Chem. 1993;268:12843–12847. [PubMed] [Google Scholar]
- 10.Grochulski P., Li Y., Schrag J. D., Cygler M. Two conformational states of Candida rugosa lipase. Protein Sci. 1994;3:82–91. doi: 10.1002/pro.5560030111. [DOI] [PMC free article] [PubMed] [Google Scholar]
- 11.Noinville S., Revault M., Baron M.-H., Tiss A., Yapoudjian S., Ivanova M., Verger R. Conformational changes and orientation of Humicola lanuginosa lipase on solid hydrophobic surface: an in situ interface Fourier transform infrared-attenuated total reflection study. Biophys. J. 2002;82:2709–2719. doi: 10.1016/S0006-3495(02)75612-9. [DOI] [PMC free article] [PubMed] [Google Scholar]
- 12.Vecchio G., Zambianchi F., Zacchetti P., Secundo F., Carrea G. Fourier-transform infrared spectroscopy study of dehydrated lipases from Candida antarctica B and Pseudomonas cepacia. Biotechnol. Bioeng. 1999;64:545–551. doi: 10.1002/(sici)1097-0290(19990905)64:5<545::aid-bit4>3.0.co;2-y. [DOI] [PubMed] [Google Scholar]
- 13.D'Auria S., Herman P., Lakowicz J. R., Tanfani F., Bertoli E., Manco G., Rossi M. The esterase from the thermophilic eubacterium Bacillus acidocaldarius: structural-functional relationship and comparison with the esterase from the hyperthermophilic archaeon Archaeoglobus fulgidus. Proteins. 2000;40:473–481. doi: 10.1002/1097-0134(20000815)40:3<473::aid-prot140>3.0.co;2-8. [DOI] [PMC free article] [PubMed] [Google Scholar]
- 14.Severcan F., Haris P. I. Fourier transform infrared spectroscopy suggests unfolding of loop structures precedes complete unfolding of pig citrate synthase. Biopolymers. 2003;69:440–447. doi: 10.1002/bip.10392. [DOI] [PubMed] [Google Scholar]
- 15.Goossens K., Haelewyn J., Meersman F., De Ley M., Heremans K. Pressure- and temperature-induce unfolding and aggregation of recombinant human interferon-γ: a Fourier transform infrared spectroscopy study. Biochem. J. 2003;370:529–535. doi: 10.1042/BJ20020717. [DOI] [PMC free article] [PubMed] [Google Scholar]
- 16.Scheirlinckx F., Raussens V., Ruysschaert J.-M., Goormaghtigh E. Conformational changes in the gastric H+, K+-ATPase monitored by difference FTIR spectroscopy and hydrogen deuterium exchange. Biochem. J. 2004;382:121–129. doi: 10.1042/BJ20040277. [DOI] [PMC free article] [PubMed] [Google Scholar]
- 17.Bradford M. M. A rapid and sensitive method for the quantitation of microgram quantities of protein utilizing the principle of protein-dye binding. Anal. Biochem. 1976;72:248–254. doi: 10.1006/abio.1976.9999. [DOI] [PubMed] [Google Scholar]
- 18.Venyaminov S. Y., Prendergast F. G. Water (H2O and 2H2O) molar absorptivity in the 1000–4000 cm−1 range and quantitative infrared spectroscopy of aqueous solutions. Anal. Biochem. 1997;248:234–245. doi: 10.1006/abio.1997.2136. [DOI] [PubMed] [Google Scholar]
- 19.Rahmelow K., Hubner W. Infrared spectroscopy in aqueous solution: difficulties and accuracy of water subtraction. Appl. Spectrosc. 1997;51:160–170. [Google Scholar]
- 20.Lotti M., Grandori R., Fusetti F., Longhi S., Brocca S., Tramontano A., Alberghina L. Cloning and analysis of Candida cylindracea lipase sequences. Gene. 1993;124:45–55. doi: 10.1016/0378-1119(93)90760-z. [DOI] [PubMed] [Google Scholar]
- 21.Ollis D., Cheah E., Cygler M., Dijkstra B., Frolow F., Franken S. M., Harel M., Remington S. J., Silman I., Schrag J. D., et al. The alpha-beta hydrolase fold. Protein Eng. 1992;5:197–211. doi: 10.1093/protein/5.3.197. [DOI] [PubMed] [Google Scholar]
- 22.Görne-Tschelnokow U., Naumann D., Weise C., Hucho F. Secondary structure and temperature behaviour of acetylcholinesterase studies by Fourier transform infrared spectroscopy. Eur. J. Biochem. 1993;213:1235–1242. doi: 10.1111/j.1432-1033.1993.tb17874.x. [DOI] [PubMed] [Google Scholar]
- 23.Tamm L. K., Tatulian S. A. Infrared spectroscopy of proteins and peptides in lipid bilayers. Q. Rev. Biophys. 1997;304:365–429. doi: 10.1017/s0033583597003375. [DOI] [PubMed] [Google Scholar]
- 24.Seshadri S., Khurana R., Fink A. L. Fourier transform infrared spectroscopy in analysis of protein deposits. Methods Enzymol. 1999;309:559–576. doi: 10.1016/s0076-6879(99)09038-2. [DOI] [PubMed] [Google Scholar]
- 25.Echabe I., Dornberger U., Prado A., Goni F., Arrondo J. L. R. Topology of sarcoplasmic reticulum Ca2+-ATPase: an infrared study of thermal denaturation and limited proteolysis. Protein Sci. 1998;7:1172–1179. doi: 10.1002/pro.5560070511. [DOI] [PMC free article] [PubMed] [Google Scholar]
- 26.Hadden J. M., Chapman D., Lee D. C. A comparison of infrared spectra of proteins in solution and crystalline forms. Biochim. Biophys. Acta. 1995;1248:115–122. doi: 10.1016/0167-4838(95)00010-r. [DOI] [PubMed] [Google Scholar]
- 27.Goormaghtigh E., Cabiaux V., Ruysschaert J. M. Secondary structure and dosage of soluble and membrane proteins by attenuated total reflection Fourier transform infrared spectroscopy on hydrated films. Eur. J. Biochem. 1990;193:409–420. doi: 10.1111/j.1432-1033.1990.tb19354.x. [DOI] [PubMed] [Google Scholar]
- 28.Dave N., Troullier A., Mus-Veteau I., Dunach M., Leblanc G., Padros E. Secondary structure components and properties of the melibiose permease from Escherichia coli: a Fourier transform infrared spectroscopy analysis. Biophys. J. 2000;79:747–755. doi: 10.1016/S0006-3495(00)76332-6. [DOI] [PMC free article] [PubMed] [Google Scholar]
- 29.Tatulian S. A., Biltonen R. L., Tamm L. K. Structural changes in a secretory phospholipase A2 induced by membrane binding: a clue to interfacial activation? J. Mol. Biol. 1997;268:809–815. doi: 10.1006/jmbi.1997.1014. [DOI] [PubMed] [Google Scholar]
- 30.Tatulian S. A. Toward understanding interfacial activation of secretory phospholipase A2 (PLA2): membrane surface properties and membrane-induced structural changes in the enzyme contribute synergistically to PLA2 activation. Biophys. J. 2001;80:789–800. doi: 10.1016/S0006-3495(01)76058-4. [DOI] [PMC free article] [PubMed] [Google Scholar]
- 31.Dong A., Kendrick B., Kreilgard L., Matsuura J., Manning M. C., Carpenter J. F. Spectroscopic study of secondary structure and thermal denaturation of recombinant human factor XIII in aqueous solution. Arch. Biochem. Biophys. 1997;347:213–220. doi: 10.1006/abbi.1997.0349. [DOI] [PubMed] [Google Scholar]
- 32.Boncheva M., Vogel H. Formation of stable polypeptide monolayers at interfaces: controlling molecular conformation and orientation. Biophys. J. 1997;73:1056–1072. doi: 10.1016/S0006-3495(97)78138-4. [DOI] [PMC free article] [PubMed] [Google Scholar]
- 33.Griebenow K., Klibanov A. M. Lyophilization-induced reversible changes in the secondary structure of proteins. Proc. Natl. Acad. Sci. U.S.A. 1995;92:10969–10976. doi: 10.1073/pnas.92.24.10969. [DOI] [PMC free article] [PubMed] [Google Scholar]
- 34.Brocca S., Persson M., Wehtje E., Adlercreutz P., Alberghina L., Lotti M. Mutants provide evidence of the importance of glycosydic chains in the activation of lipase 1 from Candida rugosa. Protein Sci. 2000;9:985–990. doi: 10.1110/ps.9.5.985. [DOI] [PMC free article] [PubMed] [Google Scholar]
- 35.Tschopp J. F., Sverlow G., Kosson R., Craig W., Grinna L. High-level secretion of glycosylated invertase in the methylotrophic yeast Pichia pastoris. Bio/Technology. 1987;5:1305–1308. [Google Scholar]
- 36.Kacurakova M., Wilson R. H. Developments in mid-infrared FT-IR spectroscopy of selected carbohydrates. Carbohydr. Polymers. 2001;44:291–303. [Google Scholar]
- 37.Harvey D. J. Identification of protein-bound carbohydrates by mass spectrometry. Proteomics. 2001;1:311–328. doi: 10.1002/1615-9861(200102)1:2<311::AID-PROT311>3.0.CO;2-J. [DOI] [PubMed] [Google Scholar]
- 38.Amoresano A., Andolfo A., Corsaro M. M., Zocchi I., Petrescu I., Gerday C., Marino G. Structural characterization of a xylanase from psychrophilic yeast by mass spectrometry. Glycobiology. 2000;10:451–458. doi: 10.1093/glycob/10.5.451. [DOI] [PubMed] [Google Scholar]
- 39.Fini C., Amoresano A., Andolfo A., D'auria S., Floridi A., Paolini S., Pucci P. Mass spectrometry study of ecto-5′-nucleotidase from bull seminal plasma. Eur. J. Biochem. 2000;267:4978–4987. doi: 10.1046/j.1432-1327.2000.01545.x. [DOI] [PubMed] [Google Scholar]


