

Abstract
Reaction conditions for the reducing-end-specific derivatization of cellulose substrates with the fluorogenic compound, anthranilic acid, have been established. Hydrolysis of fluorescence-labelled celluloses by cellobiohydrolase Cel7A from Trichoderma reesei was consistent with the active-site titration kinetics (burst kinetics), which allowed the quantification of the processivity of the enzyme. The processivity values of 88±10, 42±10 and 34±2.0 cellobiose units were found for Cel7A acting on labelled bacterial cellulose, bacterial microcrystalline cellulose and endoglucanase-pretreated bacterial cellulose respectively. The anthranilic acid derivatization also provides an alternative means for estimating the average degree of polymerization of cellulose and, furthermore, allows the quantitative monitoring of the production of reducing end groups on solid cellulose on hydrolysis by cellulases. Hydrolysis of bacterial cellulose by cellulases from T. reesei revealed that, by contrast with endoglucanase Cel5A, neither cellobiohydrolases Cel7A nor Cel6A produced detectable amounts of new reducing end groups on residual cellulose.
Keywords: burst kinetics, cellobiohydrolase, cellulase, degree of polymerization, fluorescent polymeric model substrate, processivity
Abbreviations: AA, anthranilic acid; BC, bacterial cellulose; AA-BC, AA-derivatized BC; BMCC, bacterial microcrystalline cellulose; AA-BMCC, AA-derivatized BMCC; CB, cellobiose; AA–CB, AA–CB conjugate; AA-EG-BC, AA-derivatized endoglucanase-pretreated BC; DP, degree of polymerization; EG-BC, endoglucanase-pretreated BC; pNPC, p-nitrophenyl β-D-cellobioside
INTRODUCTION
As the major component of plant cell walls, cellulose is the most abundant biopolymer on the Earth and a virtually inexhaustible source of renewable bioenergy. Micro-organisms effective in cellulose degradation produce a set of cellulolytic enzymes that act synergistically. These enzymes can be classified into three types on the basis of their mode of action, namely exo-cellulases or cellobiohydrolases, endo-cellulases or endoglucanases and β-glucosidases (see [1] for a recent review). As a major component of the cellulolytic systems, cellobiohydrolases have been proposed to play a central role in the degradation of crystalline cellulose in nature. On the basis of their long tunnel-shaped active-site structure, it has been suggested that these enzymes hydrolyse cellulose processively, i.e. after a CB (cellobiose) residue is cleaved from the cellulose chain, the enzyme will not dissociate from the substrate, but continues to hydrolyse the same chain through many cycles [2,3].
The major component of the Trichoderma reesei cellulolytic system, cellobiohydrolase Cel7A (EC 3.2.1.91, formerly CBH I), has been considered to be a highly processive strict exoglucanase [3,4], although some controversial results can be found in the literature [5]. The ability to perform endo-type catalysis was demonstrated for a homologous enzyme Cel7A (formerly CBH I) from Humicola insolens using a bifunctionalized fluorogenic tetrasaccharide as a model substrate [6]. It is not known whether this type of endo-action has a significant role in the crystalline cellulose degradation. By contrast with Cel7A, which has been shown to initiate the degradation of the cellulose chain from the reducing end [7–9], the other cellobiohydrolase of T. reesei, Cel6A, prefers the non-reducing end [7,9]. Consistent with its more open and flexible active-site region [10,11], Cel6A has been considered to possess a more pronounced endo-activity and has been thus classified as an endo-processive cellobiohydrolase [4,12].
The insolubility and heterogeneous structure of natural cellulose have complicated the kinetic studies with cellulases, forcing investigators to use low-molecular-mass chromo- or fluorogenic model substrates [13], which unfortunately do not adequately characterize the complexity of cellulose degradation in Nature, where enzymes have been developed to handle the phase-boundary catalysis. For instance, the processive action, which is considered as a key parameter of cellobiohydrolases, cannot be assessed on low-molecular-mass substrates. Also, in contrast with the case of low-molecular-mass substrates, the extent and type of product inhibition of cellulases acting on solid cellulose have remained ambiguous [14].
Fluorescence labelling of carbohydrates through reductive amination has become a widespread practice in carbohydrate and glycoconjugate chemistry, especially in conjunction with various chromatographic and electrophoretic methods [15]. Different fluorophores have been used for this purpose, including o-aminobenzoic acid [AA (anthranilic acid)] [16]. The labelling of glycans with AA or the corresponding amide is efficient and independent of the glycan structure in the case of mono-, di- and oligo-saccharides [16]. End-specific labelling of cellulose has previously been performed by reduction of the terminal aldehyde groups on cellulose with tritium-enriched sodium borohydride [9]. According to our recent results, the 3H label in such substrates is relatively unstable under alkaline conditions often used in rapid termination of cellulase reaction and results in a significant non-enzymic or non-specific release of the label [14].
This report describes the synthesis and some properties of fluorescence end-labelled celluloses as polymeric model substrates for cellulases, using an extension of a well-established derivatization procedure for glycans [17,18]. The processive action of reducing-end-specific T. reesei cellobiohydrolase Cel7A on derivatized cellulose model substrates allowed us to perform an active-site titration, which in turn can be used to quantify the processivity of the enzyme.
EXPERIMENTAL
Materials
AA, sodium cyanoborohydride, pNPC (p-nitrophenyl β-D-cellobioside), CB and glucose oxidase were obtained from Sigma, CM-cellulose (medium viscosity), 2,2′-azinobis-(3-ethylbenzothiazoline-6-sulphonic acid) and almond β-glucosidase were obtained from Fluka Chemie (Buchs, Switzerland). Acetonitrile was from Rathburn Chemicals (Walkerburn, Peeblesshire, Scotland, U.K.). All other reagents were of the highest grade available and were used without any further purification.
Enzyme purification
Cellobiohydrolases Cel7A, Cel6A and endoglucanase Cel5A were purified from the culture filtrate of T. reesei QM 9414 as described in [19,20]. For Cel6A and Cel5A, an additional purification on a Superose®-12 (Amersham Biosciences) column was performed as a final step. The column (total volume, 104 ml) was equilibrated with 0.5 M ammonium sulphate in 0.1 M sodium acetate buffer (pH 5.0). Protein sample (0.7 ml) was applied to the column and eluted isocratically with 200 ml of equilibration solution, followed by the 0.1 M sodium acetate buffer (pH 5.0) without ammonium sulphate at a flow rate of 1 ml/min. Cel5A was eluted with the equilibration solution, whereas Cel6A was eluted with the equilibration buffer without ammonium sulphate. The purity of the enzymes was confirmed by SDS/PAGE (12% gel).
Concentration of the purified enzymes was determined from absorbance measurements at 280 nm using molar absorption coefficients of 78800, 92000 and 78000 cm−1·M−1 for Cel7A, Cel6A and Cel5A respectively [5].
Preparation of cellulose substrates
BC (bacterial cellulose) and BMCC (bacterial microcrystalline cellulose) were prepared from commercially available Acetobacter xylinum cellulose (‘CHAOKOH® coconut gel in syrup’ from Thep Padung Porn Coconut Co., Bangkok, Thailand) as described previously [21,22]. Amorphous cellulose (N,N-dimethylacetamide/LiCl regenerated BMCC) was prepared as described in [14].
EG-BC (endoglucanase-pretreated BC) was prepared as follows: 1 g of BC in 500 ml of 0.05 M sodium acetate buffer (pH 5.0) was incubated with 25 nM T. reesei endoglucanase Cel5A at room temperature (25 °C) with continuous stirring for 2 h. The reaction was terminated by adjusting the pH to 11.0 with 1.0 M NaOH. The cellulose was then thoroughly washed with water and freeze-dried.
Cellulose concentration was determined by the anthrone/sulphuric acid method for total sugar using CB as the standard and absorbance measurements at 585 nm [23]. All cellulose samples were completely hydrolysed by the mixture of crude cellulases of T. reesei before the anthrone/sulphuric acid assay.
Synthesis of AA–CB (AA–CB conjugate)
AA–CB was prepared using a modification of previously published procedures [17,18]. To 1.1 mmol (0.38 g) of CB in 22 ml of water, 22 mmol (1.38 g) of sodium cyanoborohydride (NaCNBH3) and 4.4 mmol (0.60 g) of AA were added. The reaction mixture was stirred at 70 °C for 3 h. After cooling to room temperature, the product was precipitated by the addition of acetonitrile to a final concentration of 90% (v/v). The gelatinous precipitate was washed (5–7 times) with 98% acetonitrile through the centrifugation (5 min, 8000 g) and resuspension steps and the solvent was finally removed in vacuo. Synthesis of the corresponding glucose conjugate was in all respects identical with that of AA–CB.
Owing to the insolubility of CB in acetonitrile (only 0.6% of CB was lost after washing six times with acetonitrile), the efficiency of the AA labelling can be estimated by measuring the amount of unchanged CB in the crude product with the Somogyi–Nelson method for reducing sugars [24,25]. The amount of unchanged CB in the product was lower than 2% (w/v).
The purity of AA-derivatized sugars was assessed by TLC. TLC was run on silica gel aluminium plates (Silufol®) in methanol/ethyl acetate/acetic acid (2:2:1, by vol.) and the spots were visualized in UV light (354 nm). Crude AA–CB preparation showed a single spot with RF=0.6, the corresponding value for the glucose derivative was 0.8. However, on standing in solution, an additional spot with RF=0 emerged. Since the fluorescence parameters of AA–CB preparations did not change with aging, the exact nature of this product was not investigated and the crude AA–CB preparations were used without further purification.
The fluorescence of AA–CB and AA–glucose was monitored on a Hitachi F-4500 fluorescence spectrophotometer at 25 °C in 0.05 M sodium acetate buffer (pH 5.0) using excitation and emission wavelengths of 330 and 425 nm respectively. The spectra and fluorescence intensities of AA-derivatized glucose and CB were practically the same, and the fluorescence signal of AA–CB was independent of pH values in the range of 5.0–12.5. The sensitivity of the assay allowed the detection of fluorescence-conjugated sugars down to approx. 20 nM concentration.
Derivatization of cellulose with AA
To the different cellulose samples (BC, EG-BC, BMCC, amorphous cellulose and CM-cellulose) in water, NaCNBH3 and AA were added to final concentrations of 1.0 and 0.2 M respectively. Unless otherwise stated, the concentration of cellulose in the reaction mixture was 10 mg/ml. The reaction was run at 70 °C for 5 h in the case of CM-cellulose or overnight for the other cellulose samples with intensive stirring. The derivatized cellulose was collected by filtration on a Munktell filter paper or, in case of water-soluble CM-cellulose, by precipitation with ethanol to a final concentration of 90% (v/v). The derivatized celluloses were extensively washed with 1:1 (v/v) ethanol/water, followed by 0.05 M sodium acetate buffer (pH 5.0). The derivatized CM-cellulose was washed with 96% (v/v) ethanol by repeated steps of centrifugation and resuspension, and evaporated free of ethanol on a heating block at 40 °C. The derivatized celluloses were stored in 0.05 M sodium acetate buffer (pH 5.0) at 4 °C.
The amount of incorporated label was determined fluorimetrically using AA–CB as a standard. All cellulose samples were completely hydrolysed by the mixture of crude cellulases of T. reesei before fluorescence measurements.
The stability of the label on cellulose was measured on AA-EG-BC (AA-derivatized endoglucanase-pretreated BC) directly after the sample clean-up. Four samples of AA-EG-BC (0.6–2.5 mg/ml) were incubated in 0.05 M sodium acetate buffer (pH 5.0). At selected time points, aliquots of 1 ml were withdrawn, the cellulose was pelleted by centrifugation and the supernatant was analysed for the released fluorescence.
Estimation of the average DP (degree of polymerization) of celluloses
The average DP of celluloses was estimated using the Somogyi–Nelson assay for reducing sugars [24,25] and derivatization with AA. For Somogyi–Nelson analysis, the boiling time was extended from 20 min to 2 h [5]. Unless stated otherwise, the concentration of cellulose in the reaction mixture was as high as technically feasible (usually between 5 and 10 mg/ml). The number of reducing end groups on cellulose was found from absorbance measurements at 510 nm with CB as the standard.
If the AA labelling was used to quantify the number of reducing end groups on cellulose, derivatization with AA was performed as described in the previous subsection. DP of celluloses was calculated by dividing the number of total glucose in cellulose to that of the reducing end groups.
Enzymic hydrolysis of derivatized celluloses
The derivatized celluloses [AA-BMCC (AA-derivatized BMCC), AA-BC (AA-derivatized BC) and AA-EG-BC] were incubated with T. reesei cellobiohydrolase Cel7A (100–500 nM) in 0.05 M sodium acetate buffer (pH 5.0) at 25 °C. The reaction was initiated by adding the enzyme to a vigorously stirred cellulose suspension. At selected time points, aliquots of 1 ml were withdrawn and added to 50 μl of 1.0 M methylamine solution, giving a final pH of 11.5. After maintaining at room temperature for 2–3 h, the residual cellulose was pelleted by centrifugation (5 min, 8000 g) and the fluorescence in the supernatant was quantified using AA–CB as a standard. When the soluble-sugar-producing activity of the enzyme on the derivatized cellulose was assessed in parallel with the released fluorescence, the pH of a part of the above supernatant was adjusted using 1.5 M acetic acid to 5.0 and the amount of released CB was measured using the β-glucosidase/glucose oxidase/peroxidase assay with 2,2′-azinobis-(3-ethylbenzothiazoline-6-sulphonic acid) as the final electron donor and CB as a standard as described previously [14]. The possible inhibition of β-glucosidase by AA–CB was also tested. No impact of AA–CB on the assay signal was observed when the assay for CB was performed in the presence of 1.0 μM AA–CB. It is also interesting to note that β-glucosidase was not able to hydrolyse the holosidic bond in AA–CB or release AA from AA–CB as revealed by the TLC analysis (results not shown).
Hydrolysis of pNPC (0.5 mM) by 2.5 μM Cel7A in 0.05 M sodium acetate buffer (pH 5.0) at 25 °C was followed spectrophotometrically at 414 nM after alkali termination (pH 12) of the enzyme reaction using a molar absorption coefficient of 16590 cm−1·M−1 for p-nitrophenol.
Estimation of the endo-activity of T. reesei Cel7A, Cel6A and Cel5A
BC (2.0 mg/ml) in 0.05 M sodium acetate buffer (pH 5.0) was incubated with 250 nM T. reesei Cel7A, Cel6A or Cel5A at 25 °C. At selected time points, aliquots of 0.5 ml were withdrawn and added to 26 μl of 0.5 M NaOH, giving a final pH of 11.6. The cellulose residue was washed twice with 1 ml of 0.1 M NaOH and three times with 1 ml of deionized water through the centrifugation and resuspension steps. The washed cellulose was derivatized with AA as described above, and the amount of reducing end groups on residual cellulose was estimated based on the amount of incorporated label. In the control experiment (zero time points), the reaction medium was adjusted to a pH value of 11.6 before the addition of the enzymes. Subsequent treatment of the control was in all respects identical with the other time points.
RESULTS AND DISCUSSION
Preparation of fluorescence-labelled celluloses
Reaction between the terminal aldehyde groups in cellulose and AA proceeds through an intermediary imine, ‘Schiff base’, which is subsequently reduced to a more stable secondary amine (Scheme 1). At the pH prevailing in the derivatization medium (pH 6–7), the reduction of imines by NaCNBH3 has been shown to proceed much faster than the corresponding reaction with aldehydes [26].
Scheme 1. Derivatization of cellulose with AA.

Reaction between the terminal aldehyde groups in cellulose and AA proceeds through the Schiff base intermediate (not shown) which is subsequently reduced to a more stable secondary amine, an AA derivative of cellulose aminoalditol (AA-cellulose).
For derivatization, the cellulose suspensions were treated with 0.2 M AA in the presence of 1.0 M NaCNBH3 in an aqueous environment with pH 6. Owing to the insolubility of cellulose, the reagents were removed by simply washing the cellulose, either by filtration or by repeated steps of centrifugation, solvent replacement and resuspension.
The time course for the incorporation of the label was assessed on three celluloses (BC, BMCC and CM-cellulose). With BC and CM-cellulose, the derivatization reaction was completed within 5–6 h (Figure 1). However, for BMCC, the first rapid incorporation phase of the label was followed by a second and much slower one, which was not completed within the measurement period of 24 h (Figure 1).
Figure 1. Kinetics of the incorporation of fluorescence label in derivatization of celluloses with AA.

BMCC (◇), CM-cellulose (□) and BC (△) were incubated with AA (0.2 M) in the presence of NaCNBH3 (1.0 M) at 70 °C in an aqueous environment. The amount of incorporated label is expressed as μmol/g of cellulose.
The stability of the label in AA-cellulose was assessed on AA-EG-BC in 0.05 M sodium acetate buffer (pH 5.0) at 25 °C. The non-enzymic release of fluorescence exhibited a biphasic character, approx. 1% of the label being released within 3 h, followed by a much slower release (results not shown). The rapid release of approx. 1% of the label might be attributed to the hydrolysis of the remaining non-reduced Schiff base intermediate to give an AA and free reducing end group on cellulose. The release of the label in the second slow phase was found to be in accordance with the first-order kinetics since the fraction of the released fluorescence after a fixed time was independent of the AA-EG-BC concentration (results not shown). Totally 3% of the incorporated fluorescence was released into solution after incubating AA-EG-BC at pH 5.0 for 7 days. A rough estimate of the half-life for the slower phase was 200 days. The non-specific release of fluorescence was enhanced under alkaline conditions (used in the rapid termination of the enzymic reaction), approx. 1.2% of the total label being released after incubating the AA-BMCC for 27 h at pH 12.5 and 25 °C, compared with 0.1% of fluorescence released at pH 5.0 under otherwise identical conditions.
AA labelling as a sensitive tool to measure the DP of cellulose
Owing to the 1:1 stoichiometry of AA incorporation, fluorescence labelling can be employed for the quantification of reducing end groups and hence for the calculation of the average DP of cellulose. To validate the method, comparisons were made with the Somogyi–Nelson reducing sugar assay, which has previously been used for that purpose. The number of reducing end groups measured with the AA labelling was constant for the whole range of cellulose concentrations, whereas the values obtained with the Somogyi–Nelson method were almost twice as high at lower cellulose concentrations, but approached the values obtained with the AA labelling at higher cellulose concentrations (Figure 2). A similar concentration dependence was also found with BMCC and BC (P. Väljamäe, unpublished work). Table 1 lists the DP values for different celluloses measured with the Somogyi–Nelson method and AA derivatization.
Figure 2. Quantification of the reducing end groups on cellulose with the Somogyi–Nelson method and AA labelling.

The amount of reducing end groups on amorphous BMCC was estimated with the Somogyi–Nelson method (□) or by labelling with AA (△) and are expressed as μmol of end groups/g of cellulose.
Table 1. Processivity of Cel7A on cellulose substrates with different average DPs.
n.d., not determined.
| AA labelling method | Somogyi–Nelson method | ||||
|---|---|---|---|---|---|
| Substrate | Reducing end groups (μmol/g) | DP (glucose units) | Reducing end groups (μmol/g) | DP (glucose units) | Processivity of Cel7A (glucose units)* |
| BMCC | 39±0.3 | 150±2 | 48±1† | 130±3 | 84±20 |
| Amorphous BMCC | 37±2 | 163±9 | 46±1‡ | 131±3 | n.d. |
| CM-cellulose | 21±5 | 300±72 | 20±2 | 300±30 | n.d. |
| EG-BC | 10±1 | 600±60 | n.d. | n.d. | 68±4 |
| BC | 3.5±0.5 | 1700±25 | n.d. | n.d. | 176±20 |
* Measured on AA-labelled substrates according to eqn (5).
† Measured at a cellulose concentration of 5 mg/ml.
‡ Measured at a cellulose concentration of 8 mg/ml.
In addition to being more reliable, the AA labelling method is also more sensitive. The sensitivity should enable the measurement of cellulose DP values up to 20000 glucose units. According to our estimates, the currently used chemical methods, such as the Somogyi–Nelson or dinitrosalicylic acid method, are limited to DP values of up to 400 glucose units. A similar strategy, but in this case using 2-aminopyridine as the fluorescent tag, has been used in the determination of the DP of amylose [27].
Estimation of the endo-activity of T. reesei Cel7A, Cel6A and Cel5A on BC
Here, the BC was hydrolysed with T. reesei cellobiohydrolases Cel7A, Cel6A or endoglucanase Cel5A (all 250 nM) at 25 °C in 0.05 M sodium acetate buffer (pH 5.0) for 2–30 min. After a thorough washing of the residual cellulose, the amount of reducing end groups was determined by derivatization with AA. The action of endoglucanase Cel5A caused a 3-fold increase in the number of reducing end groups on residual cellulose relative to the non-pretreated substrate (Figure 3). Although the endo-activity of cellobiohydrolases on low-molecular-mass substrates as well as on polymeric model substrates has been demonstrated, and there are no absolute structural constraints ruling out an endo-type catalysis [10,11], we did not observe the production of detectable amounts of new chain ends on BC upon the action of Cel7A or Cel6A (Figure 3).
Figure 3. Production of reducing end groups on cellulose by different cellulases.

BC (2.0 mg/ml) in 0.05 M sodium acetate buffer (pH 5.0) was incubated at 25 °C with 250 nM of one of the following T. reesei enzymes: Cel7A (□), Cel6A (×) or Cel5A (■). The amount of reducing end groups on residual cellulose was quantified by labelling with AA. The number of reducing end groups is expressed as μmol/g cellulose. All the time points were measured in triplicate.
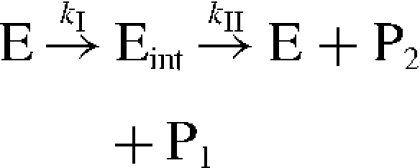
Active-site titration: theory
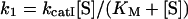
Active-site titration is a combination of pre-steady-state kinetics and steady-state kinetics and was originally developed for the determination of the absolute concentration of active sites in enzyme preparations. Active-site titration is not directly applicable with all of the enzymes and all substrates (for the active-site titration method, see [28]). At least a two-step (two products) reaction mechanism must be obeyed, whereas the first product (P1) must be detectable separately from the second product (P2). Furthermore, the enzyme–intermediate complex (Eint) has to accumulate, meaning that the two steps must be well separated in time with the second step being the rate-limiting one:
where kI is a combined first-order rate constant for the first step and kII is the first-order rate constant for the decomposition of Eint to give a free enzyme (E) and P2. kI often follows the saturation kinetics with the substrate concentration ([S]), according to:
 |
(1) |
where kcatI and KM refer to the turnover number and Michaelis constant for the first step respectively. Analytical solution for the formation of P1 in time (t) according to Scheme 2 results in an equation comprising the sum of exponential and linear functions:
 |
(2) |
where E0 stands for the total enzyme concentration and C is a combination of previously defined constants:
 |
(3) |
Scheme 2.
If the first step is considerably faster than the second one, then the enzyme–intermediate complex rapidly accumulates, characterized by the ‘burst’ of P1 release followed by the slow steady-state turnover of Eint to release the free enzyme and P2. The linear part of eqn (2) extrapolates back to the ‘burst’ of P1 (π) given by
 |
(4) |
If kI≫kII, the burst is approximately equal to E0. Since kI increases with substrate concentration but kII does not, the π should better approximate E0 at higher substrate concentrations. As evident from eqns (1) and (eqn 4), the square root of π levels off with substrate concentration according to a hyperbola, meaning that saturation kinetics similar to eqn (1) is obeyed for the square root of π.
Active-site titration of Cel7A
Figure 4 shows that the release of fluorescent end label upon the hydrolysis of AA-celluloses by Cel7A (250 nM) follows burst kinetics consistent with eqn (2). TLC analysis of the products after 2 h of hydrolysis of AA-celluloses by 250 nM Cel7A resulted in a single spot with RF=0.6 corresponding to AA–CB. TLC analysis of the reaction mixture where 14 mM AA–CB was incubated with 2 μM Cel7A for 24 h at 25 °C in 0.05 M sodium acetate buffer (pH 5.0) showed that the enzyme was not able to hydrolyse either the holosidic or the -C-N- bond in AA–CB. As revealed from the overlap of the calibration curves of AA–CB obtained with and without the presence of Cel7A (200 nM), the fluorescence signal of AA–CB was not affected by the presence of the enzyme (results not shown).
Figure 4. Time course of the hydrolysis of AA-celluloses by Cel7A.

AA-EG-BC (2.0 mg/ml; ◇), AA-BMCC (1.0 mg/ml; △) and AA-BC (2.0 mg/ml; □) were incubated with 250 nM Cel7A in 0.05 M sodium acetate buffer (pH 5.0) at 25 °C. Solid lines are plotted according to eqn (2). The inset shows the release of p-nitrophenol (pNP) on the hydrolysis of pNPC (0.5 mM) by 2.5 μM Cel7A in 0.05 M sodium acetate buffer (pH 5.0) at 25 °C.
Figure 4 (inset) shows the hydrolysis of 0.5 mM pNPC by 2.5 μM Cel7A. Although the substrate concentration is high enough to saturate the enzyme [29], we cannot see the burst kinetics observed with cellulose model substrates (Figure 4).
Furthermore, we tested how the burst of fluorescence release (π) correlates with the AA-cellulose concentration. For this, AA-EG-BC (0.05–2.0 mg/ml) was hydrolysed by Cel7A at two different enzyme concentrations (100 and 250 nM). Since the time course of the fluorescence release was quite consistent with eqn (2) in further experiments, the data points in the exponential stage were omitted and only those in the linear stage of the time curve (2–10 min) were measured, and the value of π was found by linear regression analysis. Since π1/2 should level off with substrate concentration according to a hyperbola (see eqns 1 and 4), the (1/π1/2) versus (1/[S]) plot should be linear and the limiting value of burst (πlim) can be found from the intercept to the (1/π1/2) axis. As seen from Figure 5, the hydrolysis of AA-EG-BC is in accordance with the theory. Linear regression analysis of the data presented in Figure 5 gave πlim values of 101±4 and 248±18 nM for the experiments, with total Cel7A concentration of 100 and 250 nM respectively. The π values close to πlim and E0 were also found from the experiments at single but high AA-EG-BC concentration. The hydrolysis of AA-EG-BC (2.0 mg/ml) by 100, 250 and 500 nM Cel7A gave π values of 87±4, 240±37 and 480±100 nM respectively (results not shown). Although there are several possible reasons why active-site titration could fail for Cel7A, we obtained a good approximation of πlim to E0 in our experiments. Occasional endo-activity or action from the nonreducing end as well as possible cellulose-binding-domain-mediated non-productive binding of Cel7A are the factors that should result in πlim values lower than E0. If we assume, e.g., that half of the enzyme molecules would start hydrolysis from the non-reducing end on cellulose with the same processivity as starting from the reducing end or would be bound non-productively on the cellulose surface, then πlim should equal 1/2E0. The same would happen if only half of the reducing end groups carried the label. Good approximation of πlim to E0 in our experiments thus supports the suggestions that Cel7A is a strict reducing-end-acting exoglucanase, with no or insignificant endo-activity when acting on cellulosic substrates. Furthermore, there cannot be significant non-productive binding of Cel7A under our experimental conditions. The productive binding in the long active-site tunnel is apparently much stronger than non-productive binding through a cellulose-binding domain, so that at the low enzyme-to-substrate ratios used by us, the prevalent binding mode is productive.
Figure 5. Dependence of the burst of fluorescence release (π) in active-site titration of Cel7A on substrate concentration.

AA-EG-BC (0.1–2.0 mg/ml) was incubated in 0.05 M sodium acetate buffer (pH 5.0) at 25 °C with 100 nM (□) and 250 nM (◇) Cel7A. The maximum values of burst (πmax) were found from the intercept to the (1/π1/2) axis.
Processivity of Cel7A
As a retaining cellulase, the catalytic cycle of T. reesei Cel7A involves a covalent glycosyl–enzyme intermediate, a promising mechanism for burst kinetics [30]. Successful active-site titration experiments on CB derivatives containing good aglyconic leaving groups have been reported with an exo-cellulase from Cellulomonas fimi [31]. However, corresponding attempts with T. reesei Cel7A have failed so far, as reported by others [29] and also as found in the present study using pNPC as a substrate (Figure 4, inset). On the other hand, the hydrolysis of polymeric model substrates by Cel7A reported here was consistent with the burst kinetics. Good approximation of πlim to E0 suggests that the two steps in Scheme 2 are well separated in time (see eqn 4). However, the glycosyl-enzyme intermediate is the same for the hydrolysis of both low-molecular-mass substrates (like pNPC) and polymeric model substrates (see Scheme 3). The reason apparently lies in the processive action of the enzyme. A processive cellobiohydrolase, having released the fluorescent label as the first product from the chain end, will not dissociate from the cellulose chain until the full processive cycle has been completed. Thus the second step in Scheme 2 is retarded at least by the factor of processivity, making it slow enough in comparison with step 1 to reveal the burst kinetics. This cannot be the case with low-molecular-mass substrates, where processivity cannot be involved (Scheme 3). Taken together, it gives a rationale for quantification of the processivity of cellulases, a topic that has been thoroughly discussed on the structural basis [11,32] but not supported by solid experiments so far.
Scheme 3. Schematic representation of the hydrolysis of a low-molecular-mass substrate (pNPC, left panel) and a polymeric model substrate (AA-cellulose, right panel) by T. reesei Cel7A.

E, free enzyme (‘+’ and ‘−’ represent product and substrate binding subsites in the enzyme respectively); Eint, covalent enzyme–intermediate complex; ES, productive enzyme–substrate complex; ES′, non-productive ES; NR, non-reducing end; P1, first product (p-nitrophenol for pNPC and AA–CB for AA-cellulose); P2, second product (CB). Steps I and II are represented by the complex first-order rate constants kI and kII respectively (see also Scheme 2). Note that, for the polymeric model substrate, the second step is slowed down at least by the factor of processivity of the enzyme.
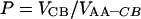
For the value of processivity (P), one has to measure the ratio of the velocity of the second product formation (VCB) to that of the first product formation (VAA–CB) in the steady state:
 |
(5) |
Figure 6 shows the steady-state velocities of the fluorescence (VAA–CB) and CB (VCB) release on hydrolysis of AA-EG-BC by 100 nM Cel7A as a function of the substrate concentration. Steady-state velocities for the release of the fluorescence and CB were calculated on the basis of the 4–8 time points measured in the linear stage of the time curve (between 2 and 10 min of hydrolysis). Both ‘curves’ in Figure 6 are in accordance with the saturation kinetics (Michaelis–Menten kinetics). The KM and kcat values were found by non-linear regression analysis of the data in Figure 6 according to the hyperbola. The KM(AA–CB) and kcat(AA–CB) values for the first product (fluorescence) formation in steady state were 0.17±0.012 mg/ml and 2.9×10⁻³±0.1×10⁻³ s−1 respectively. Corresponding values for the second product (CB) were KM(CB)=0.12±0.02 mg/ml and kcat(CB)=9.5× 10⁻²±2.5×10⁻³ s−1. On the basis of the ratio of turnover numbers for CB and fluorescence release, the processivity for Cel7A on AA-EG-BC of 33±2 CB units can be found. On using the same algorithm, a processivity of 35±2 CB units was obtained for the experiments with 250 nM Cel7A. Figure 7 shows the values of processivity found for a given substrate concentration according to eqn (5). Although measurements at higher substrate concentrations tend to give lower processivity values, considering the error limits, it is difficult to say whether or not the processivity depends on the enzyme-to-substrate ratio (Figure 7). On the basis of the experiments at one substrate concentration (2.0 mg/ml, fairly saturating), the processivity value for Cel7A on AA-BMCC and AA-BC was found to be 42±10 and 88±10 CB units respectively. It must be noted that the derivatization of EG-BC with AA decreased both the affinity of Cel7A as well as the turnover number by approx. 2-fold. The KM and kcat for CB formation in the steady state of the hydrolysis of EG-BC by 250 nM Cel7A were 0.07±0.01 mg/ml and 0.27±0.011 s−1 respectively. It is not known whether the derivatization also affects the processivity.
Figure 6. Steady-state analysis of AA-EG-BC hydrolysis by Cel7A.

AA-EG-BC (0.05–2.0 mg/ml) was incubated with 100 nM Cel7A in 0.05 M sodium acetate buffer (pH 5.0) at 25 °C. Steady-state velocities are calculated on the basis of the 4–8 time points measured between 2 and 10 min of hydrolysis. Steady-state release rate of fluorescence (AA–CB) (left axis, ◇) and CB (right axis, □).
Figure 7. Processivity of Cel7A on AA-EG-BC.

AA-EG-BC (0.1–2.0 mg/ml) was incubated with 100 nM (□) or 250 nM (◇) Cel7A in 0.05 M sodium acetate buffer (pH 5.0) at 25 °C. Steady-state velocities were calculated on the basis of the 4–8 time points measured between 2 and 10 min of hydrolysis. Processivity was calculated from the steady-state velocities according to eqn (5).
The estimated processivity of approx. 90 CB units on AA-BC supports the assumptions about the high processivity of Cel7A. Processivity values of 42±10 and 34±2 CB units found on AA-BMCC and AA-EG-BC respectively are probably limited by the DP of the substrate. The average DP of AA-BMCC is approx. 150 glucose units or 75 CB units (Table 1) and is apparently smaller on the cellulose surface [21], in the real action place of Cel7A. The same is true for the AA-EG-BC, where the endoglucanase pretreatment decreases the DP of cellulose chains mainly on the surface layer of the cellulose crystal [22]. The processivity values found here are higher than those reported earlier. Using the ratio of produced CB to that of the sum of glucose and cellotriose as a measure of processivity, Medve et al. [33] found the processivity for T. reesei Cel7A to be approx. 5–10 CB units on Avicel as a substrate. Using the same algorithm, a rough estimate of processivity of 23 CB units was recently reported for T. reesei Cel7A acting on BMCC [34]. Whether this discrepancy is due to the different properties of the substrates or different algorithms used to quantify processivity remains to be elucidated.
Acknowledgments
We thank L. Hildén from Swedish Agricultural University and Dr U. Mäeorg from Tartu University for their generous assistance, and Dr Jerry Ståhlberg from Swedish Agricultural University and Silja Kuusk from Tartu University for a critical reading of this paper. This work was supported by grants from Estonian Science Foundation (grant no. 5848), Wood Ultrastructure Research Center, The Swedish Royal Academy of Sciences and Sven and Dagmar Saléns Foundation.
References
- 1.Lynd L. R., Weimer P. J., van Zyl W. H., Pretorius I. S. Microbial cellulose utilization: fundamentals and biotechnology. Microbiol. Mol. Biol. Rev. 2002;66:506–577. doi: 10.1128/MMBR.66.3.506-577.2002. [DOI] [PMC free article] [PubMed] [Google Scholar]
- 2.Divne C., Ståhlberg J., Reinikainen T., Ruohonen L., Pettersson G., Knowles J. C. K., Teeri T. T., Jones T. A. The three-dimensional structure of the catalytic core of cellobiohydrolase I from Trichoderma reesei. Science. 1994;265:524–528. doi: 10.1126/science.8036495. [DOI] [PubMed] [Google Scholar]
- 3.Teeri T. T. Crystalline cellulose degradation: new insights into the function of cellobiohydrolases. Tibtech. 1997;15:160–167. [Google Scholar]
- 4.Boisset C., Fraschini C., Schülein M., Henrissat B., Chanzy H. Imaging the enzymatic digestion of bacterial cellulose ribbons reveals the endo character of the cellobiohydrolase Cel6A from Humicola insolens and its mode of synergy with cellobiohydrolase Cel7A. Appl. Environ. Microbiol. 2000;66:1444–1452. doi: 10.1128/aem.66.4.1444-1452.2000. [DOI] [PMC free article] [PubMed] [Google Scholar]
- 5.Ståhlberg J., Johansson G., Pettersson G. Trichoderma reesei has no true exo-cellulase: all intact and truncated cellulases produce new-reducing end groups on cellulose. Biochem. Biophys. Acta. 1993;1157:107–113. doi: 10.1016/0304-4165(93)90085-m. [DOI] [PubMed] [Google Scholar]
- 6.Armand S., Drouillard S., Schülein M., Henrissat B., Driguez H. A. Bifunctionalized fluorogenic tetrasaccharide as a substrate to study cellulases. J. Biol. Chem. 1997;272:2709–2713. doi: 10.1074/jbc.272.5.2709. [DOI] [PubMed] [Google Scholar]
- 7.Barr B. K., Hsieh Y. L., Ganem B., Wilson D. B. Identification of two functionally different classes of exocellulases. Biochemistry. 1996;35:586–592. doi: 10.1021/bi9520388. [DOI] [PubMed] [Google Scholar]
- 8.Imai T., Boisset C., Samejima M., Igarashi K., Sugiyama J. Unidirectional processive action of cellobiohydrolase Cel7A on Valonia cellulose microcrystals. FEBS Lett. 1998;432:113–116. doi: 10.1016/s0014-5793(98)00845-x. [DOI] [PubMed] [Google Scholar]
- 9.Nutt A., Sild V., Pettersson G., Johansson G. Progress curves: a means for functional classification of cellulases. Eur. J. Biochem. 1998;258:200–206. doi: 10.1046/j.1432-1327.1998.2580200.x. [DOI] [PubMed] [Google Scholar]
- 10.Zou J., Kleywegt G. J., Ståhlberg J., Driguez H., Nerinckx W., Claeyssens M., Koivula A., Teeri T. T., Jones T. A. Crystallographic evidence for substrate ring distortion and protein conformational changes during catalysis in cellobiohydrolase Cel6A from Trichoderma reesei. Structure. 1999;7:1035–1045. doi: 10.1016/s0969-2126(99)80171-3. [DOI] [PubMed] [Google Scholar]
- 11.Varrot A., Frandsen P. T., von Ossowski I., Boyer V., Cottaz S., Driguez H., Schülein M., Davies G. J. Structural basis for ligand binding and processivity in cellobiohydrolase Cel6A from Humicola insolens. Structure. 2003;11:855–864. doi: 10.1016/s0969-2126(03)00124-2. [DOI] [PubMed] [Google Scholar]
- 12.Henrissat B. Enzymatic cellulose degradation. Cellulose Commun. 1998;5:84–90. [Google Scholar]
- 13.van Tilbeurgh H., Loontiens F. G., De Bruyne C., Claeyssens M. Fluorogenic and chromogenic glycosides as substrates and ligands of carbohydrases. Methods Enzymol. 1988;160:45–59. [Google Scholar]
- 14.Gruno M., Väljamäe P., Pettersson G., Johansson G. Inhibition of the Trichoderma reesei cellulases by cellobiose is strongly dependent on the nature of the substrate. Biotechnol. Bioeng. 2004;86:503–511. doi: 10.1002/bit.10838. [DOI] [PubMed] [Google Scholar]
- 15.Bardelmeyer H. A., Lingeman H., De Ruiter C., Underberg W. J. M. Derivatization in capillary electrophoresis. J. Chromatogr. A. 1998;807:3–26. doi: 10.1016/s0021-9673(98)00230-1. [DOI] [PubMed] [Google Scholar]
- 16.Bigge J. C., Patel T. P., Bruce J. A., Goulding P. N., Charles S. M., Parekh R. B. Nonselective and efficient fluorescent labeling of glycans using 2-amino- benzamide and anthranilic acid. Anal. Biochem. 1995;230:229–238. doi: 10.1006/abio.1995.1468. [DOI] [PubMed] [Google Scholar]
- 17.Sato K., Sato K., Okubo A., Yamazaki S. Optimization of derivatization with 2-aminobenzoic acid for determination of monosaccharide composition by capillary electrophoresis. Anal. Biochem. 1998;262:195–197. doi: 10.1006/abio.1998.2798. [DOI] [PubMed] [Google Scholar]
- 18.Huang Z., Prickett T., Potts M., Helm R. F. The use of 2-aminobenzoic acid tag for oligosaccharide gel electrophoresis. Carbohydr. Res. 2000;328:77–83. doi: 10.1016/s0008-6215(00)00045-8. [DOI] [PubMed] [Google Scholar]
- 19.Bhikhabhai R., Johansson G., Pettersson G. Isolation of cellulolytic enzymes from Trichoderma reesei QM 9414. J. Appl. Biochem. 1984;6:336–345. [PubMed] [Google Scholar]
- 20.Saloheimo M., Lehtovaara P., Penttilä M., Teeri T. T., Ståhlberg J., Johansson G., Pettersson G., Claeyssens M., Tomme P., Knowles J. C. K. EG III, a new endoglucanase from Trichoderma reesei: the characterization of both gene and enzyme. Gene. 1988;63:11–21. doi: 10.1016/0378-1119(88)90541-0. [DOI] [PubMed] [Google Scholar]
- 21.Väljamäe P., Sild V., Nutt A., Pettersson G., Johansson G. Acid hydrolysis of bacterial cellulose reveals different modes of synergistic action between cellobiohydrolase I and endoglucanase I. Eur. J. Biochem. 1999;266:327–334. doi: 10.1046/j.1432-1327.1999.00853.x. [DOI] [PubMed] [Google Scholar]
- 22.Väljamäe P., Pettersson G., Johansson G. Mechanism of substrate inhibition in cellulose synergistic degradation. Eur. J. Biochem. 2001;268:4520–4526. doi: 10.1046/j.1432-1327.2001.02377.x. [DOI] [PubMed] [Google Scholar]
- 23.Hörmann H., Gollwitzer R. Bestimmung von hexosen in trypofan-haltigen eiweisskörpern. Ann. Chem. 1962;655:178–188. [Google Scholar]
- 24.Nelson N. J. A photometric adaptation of the Somogyi method for the determination of glucose. J. Biol. Chem. 1944;153:375–380. [Google Scholar]
- 25.Somogyi M. Notes on sugar determination. J. Biol. Chem. 1952;195:19–23. [PubMed] [Google Scholar]
- 26.Lane C. F. Sodium cyanoborohydride – a highly selective reducing agent for organic functional groups. Synthesis. 1975;3:135–146. [Google Scholar]
- 27.Hanashiro I., Takeda Y. Examination of number-average degree of polymerisation and molar-based distribution of amylose by fluorescent labeling with 2-aminopyridine. Carbohydr. Res. 1998;306:421–426. doi: 10.1016/s0008-6215(97)10075-1. [DOI] [PubMed] [Google Scholar]
- 28.Fersht A. 2nd edn. New York: W. H. Freeman; 1999. Structure and Mechanism in Protein Science. [Google Scholar]
- 29.Becker D., Braet C., Brumer H., Claeyssens M., Divne C., Fagerström B. R., Harris M., Jones T. A., Kleywegt G. J., Koivula A., et al. Engineering of a glycosidase family 7 cellobiohydrolase to more alkaline pH optimum: the pH behaviour of Trichoderma reesei Cel7A and its E223S/A224H/L225V/T226A/D262G mutant. Biochem. J. 2001;356:19–30. doi: 10.1042/0264-6021:3560019. [DOI] [PMC free article] [PubMed] [Google Scholar]
- 30.Claeyssens M., Tomme P., Brewer C. F., Hehre E. J. Stereochemical course of hydrolysis and hydration reactions catalyzed by cellobiohydrolases I and II from Trichoderma reesei. FEBS Lett. 1990;263:89–92. doi: 10.1016/0014-5793(90)80712-r. [DOI] [PubMed] [Google Scholar]
- 31.Tull D., Withers S. G. Mechanism of cellulases and xylanases: a detailed kinetic study of the exo-β-1,4-glycanase from Cellulomonas fimi. Biochemistry. 1994;33:6363–6370. doi: 10.1021/bi00186a041. [DOI] [PubMed] [Google Scholar]
- 32.Breyer A. W., Matthews W. B. A structural basis of processivity. Protein Sci. 2001;10:1699–1711. doi: 10.1110/ps.10301. [DOI] [PMC free article] [PubMed] [Google Scholar]
- 33.Medve J., Karlsson J., Lee D., Tjerneld F. Hydrolysis of microcrystalline cellulose by cellobiohydrolase I and endoglucanase II from Trichoderma reesei: adsorption, sugar production pattern, and synergism of the enzymes. Biotechnol. Bioeng. 1998;59:621–634. [PubMed] [Google Scholar]
- 34.von Ossowski I., Ståhlberg J., Koivula A., Piens K., Becker D., Boer H., Harle R., Harris M., Divne C., Mahdi S., et al. Engineering the exo-loop of Trichoderma reesei cellobiohydrolase, Cel7A. A comparison with Phanerochaete chrysosporium Cel7D. J. Mol. Biol. 2003;333:817–829. doi: 10.1016/s0022-2836(03)00881-7. [DOI] [PubMed] [Google Scholar]