Abstract
Many catalases have the shared property of containing bound NADPH and being susceptible to inactivation by their own substrate, H2O2. The presence of additional (unbound) NADPH effectively prevents bovine liver and human erythrocytic catalase from becoming compound II, the reversibly inactivated state of catalase, and NADP+ is known to be generated in the process. The function of the bound NADPH, which is tightly bound in bovine liver catalase, has been unknown. The present study with bovine liver catalase and [14C]NADPH and [14C]NADH revealed that unbound NADPH or NADH are substrates for an internal reductase and transhydrogenase reaction respectively; the unbound NADPH or NADH cause tightly bound NADP+ to become NADPH without becoming tightly bound themselves. This and other results provide insight into the function of tightly bound NADPH.
Keywords: catalase, glucose-6-phosphate dehydrogenase, hydrogen peroxide, NADH, NADPH, oxidative stress
Abbreviations: G6P, glucose-6-phosphate; NADP, either NADP+ or NADPH; (NADPH)b and (NADP+)b, tightly bound NADPH and NADP+ respectively; NAD(P)H, either NADH or NADPH
INTRODUCTION
Kirkman et al. found that the catalase of human erythrocytes is a major NADPH-binding protein within those cells [1] and that bovine liver and canine catalases also contain (NADPH)b (tightly bound NADPH) [2]. These catalases, which are tetramers with one haem in each subunit [3], were found to contain one (NADPH)b per subunit as well [2]. X-ray crystallographic studies of the three-dimensional structure of bovine liver catalase to a resolution of 2.5 Å were initially interpreted as showing no bound NADPH [4], but re-interpretation revealed that each subunit contained (NADPH)b in an unusual configuration [5]. The terms for the various states of catalase are represented in the sequence it catalyses, beginning with ferricatalase, the resting state of the enzyme:
 |
Catalase also assumes an inactive state, called compound II, during exposure to its own substrate, H2O2. Compound II is a product of compound I [6]. The fraction of catalase becoming compound II reaches a steady-state level during exposure to H2O2 that is generated at a constant rate [7]. When exposure to H2O2 stops, catalase returns to the ferricatalase state [7]. The finding of (NADPH)b was followed by the finding that added NADPH largely prevents or reverses the formation of compound II by bovine liver or human catalase in the presence of H2O2 [8,9]. The protective action of NADPH occurs at concentrations as low as 2 μM [9]. A subsequent study revealed that the action of NADPH is more one of prevention than of reversal [10]. Hillar and co-workers [11,12] proposed that catalase can exist in a state intermediate between compounds I and II. That proposal explained how NADPH, a two-electron-reducing substance, could carry out the one-electron conversion of compound II to ferricatalase. In addition, that proposal would account for how the rate of oxidation of NADPH, in the presence of H2O2, exceeds the rate of formation of compound II in the absence of NADPH. The different states of catalase result from differences in and near the haem groups, which are in the centre of the molecule. The tunnel to the haem group is large enough to accommodate H2O2, but much too small for NADPH. Moreover, (NADPH)b is near the surface of catalase [5]. Several groups of authors have proposed that the action of (NADPH)b or NADPH is via electron tunnelling [13–16]. Despite this understanding of the relationship between catalase and NADPH, the function of (NADPH)b is unknown and is the subject of the present study.
EXPERIMENTAL
The molecular mass of bovine liver catalase was considered to be that of the subunit (catalase haem), which is one fourth that of the normal or tetrameric form of the enzyme. The latter was considered to be 240000. Krebs–Ringer/Tes solution comprised (final millimolar concentrations): NaCl, 119; KCl, 4.7; CaCl2, 2.5;KH2PO4, 1.2; MgSO4, 1.2; (sodium) Tes, pH 7.4, 22.6. Bovine liver catalase was from Roche Molecular Biochemicals (Mannheim, Germany). The crystalline enzyme was dissolved in Krebs-Ringer/Tes solution to a final catalase concentration of approx. 32 μM. The dissolved catalase was allowed to remain at room temperature for 30 min, and was then concentrated approx. 10-fold by centrifugation on an ultrafiltration device with an exclusion of 30000 Da (Ultra-4 Centrifugal Filter, UFC8 030, Amicon). The concentrate was brought back to the original volume with 50 mM Na2HPO4/KH2PO4 buffer (Na/K phosphate buffer), pH 6.4. After 30 min at room temperature, the catalase was concentrated again and washed on the UFC8 030 centrifugal filter with 50 mM Na/K phosphate buffer, pH 6.4. All other enzymes were both dissolved and washed with Na/K phosphate buffer. The activity of catalase was determined from the first-order rate constant of the rate of disappearance of H2O2 at 25 °C, measured at an absorbance at 240 nm with a Beckman DU-7 recording spectrophotometer [17]. The initial H2O2 concentration was 10 mM. By this assay, the bovine liver catalase had an activity of 25.5 s−1 per micromolar tetrameric concentration (6.38 s−1 per micromolar haem concentration). The rate of formation of H2O2 by glucose oxidase in the presence of 5 mM glucose was determined with the assay for H2O2 described by Green and Hill [18]. The formation of compound II was followed at 435 nm, the isosbestic point between ferricatalase and compound I, where the difference in molar absorption coefficient between ferricatalase and compound II was considered to be 32 mM−1·cm−1 [6]. Glucose oxidase from Aspergillus niger and yeast G6P (glucose-6-phosphate) dehydrogenase and 6-phosphogluconate dehydrogenase were purchased from Roche Molecular Biochemicals. The solution of each enzyme was assayed for protein concentration and activity. Protein concentrations were determined using the Coomassie Plus Protein Assay Reagent Kit (Pierce Chemical Co., Rockford, IL, U.S.A.) with BSA as a standard. The emission spectrum of unbound and catalase-bound NADPH was measured with a PerkinElmer LS 50B recording spectrofluorometer, at room temperature, with the excitation wavelength set at 340 nm and with a digital recording of fluorescence at each 0.5 nm of emission wavelength. Curve smoothing was achieved by taking, at each 0.5 nm emission reading, the average of that reading, plus the nine readings on each side. G-25 Sephadex (fine) was from Pharmacia.
Preparation of [14C]NADP+, [14C]NADPH and [14C]NADH
[14C]NAD+ was obtained from Amersham. Recombinant human NAD kinase was a gift from Professor Mathias Ziegler (Freie Universität Berlin, Institut für Biochemie, Berlin, Germany). Several attempts to convert NAD+ to NADP+, using different batches of commercially available chicken liver NAD kinase (Sigma), were repeatedly unsuccessful. [14C]NAD+ (150 μg; 50 μCi, where 1 Ci=37 GBq), dissolved in 2.0 ml of 2% ethanol, was dried with a stream of air at 25 °C, and was then dissolved in 500 μl of water and mixed with a solution comprising 100 μl of 0.5 M Tris/HCl, pH 7.5, 20 μl of 0.5 M MgCl2, 240 μl of 10 mM ATP, pH 7.4, 40 μl of 7.1 mM NAD+ and 100 μl (60 μg) of recombinant human NAD kinase (specific activity 6.7 μmol·min−1·mg−1) [19]. Enzymic determination of NAD+ and NADP+ (described by Lowry and Passonneau [20]) at the end of 90 min of incubation at 37 °C revealed that more than 97% of the NAD+ had been converted into NADP. After the addition of 1.0 ml of ethanol, the mixture was exposed to a stream of air at 25 °C until dry, then dissolved again in 1.0 ml of water. This preparation was centrifuged at 1000 g for 15 min, and the supernatant fluid was again evaporated until it was dry, then dissolved in 1.0 ml of water. [14C]NADPH and [14C]NADH were generated by enzymes, as described previously [2].
Determination of dissociation constant and the number of binding sites for weak binding of NADPH
The volume of the reaction mixtures was 0.5 ml and comprised 8 μM catalase suspended in 50 mM Na/K phosphate buffer, pH 6.5, and different concentrations of [14C]NADPH (1, 2, 4, 8 and 16 μM), which was kept constantly in the reduced form by the presence of 10 μg·ml−1 yeast G6P dehydrogenase and 1.0 mM G6P. After 2 h of incubation at 37 °C, each reaction mixture was ultrafiltered at 1500 g for 15 min to obtain 0.2 ml of concentrated catalase. If the volumes of the concentrated catalase were less than 0.2 ml, they were adjusted with the corresponding ultrafiltrate. Concentrated catalase samples were then transferred into fresh tubes. The UFC8 030 devices were then washed with 0.1 ml of phosphate buffer to recover residual catalase. After stirring and vortexing, the 0.1 ml solutions were added to the 0.2-ml tubes containing the concentrated catalase, then mixed. Concentrated catalase samples were tested for protein concentration (over 90% recovery) and aliquots of the concentrated catalase and ultrafiltrates were then transferred into scintillation vials for counting. The difference between the concentrated catalase and the ultrafiltrates, adjusted for catalase concentration, represented the [14C]NADPH binding by catalase exposed to different NADPH concentrations.
Mathematical analysis
Dissociation constant for weak binding of NADPH
The concentration of total binding sites for weak binding of NADPH on catalase was represented by Po and the dissociation constant by k. A plot was then made of the equation y=ax+b, in which y=1/(NADPH)b, x=1/NADPH, a=k/Po and b=1/Po. The weighted, least-squares fits were found for Po and k [21]. Po was then divided by the concentration of catalase to obtain Nc, the number of binding sites per molecule of catalase.
Percentage displacement of (NADPH)b by [14C]NADPH
The following derivations assumed the validity of the displacement hypothesis, in which the (NADPH)b of catalase becomes oxidized in preventing the formation of compound II, and then one molecule of labelled NADPH displaces each resulting molecule of (NADP+)b. The constants were: Nu, number of nmol of unbound (added) [14C]NADPH per ml; Nb, number of nmol of bound NADPH per ml (this was considered to be the haem concentration, or 4 times the concentration of tetrameric catalase); Sa, specific activity of added [14C]NADPH in c.p.m. per nmol of NADPH; Sm, the mean specific activity, which is the specific activity of NADPH throughout the incubation mixture when the unbound [14C]NADPH has equilibrated with the bound [14C]-NADPH. This was predicted by:
 |
(1) |
The following variables were: sb, specific activity of the bound NADPH in nmol per nmol of catalase; su, specific activity of the unbound NADPH in c.p.m. per nmol; n, the cumulative number of nmol of tightly bound NADPH oxidized and displaced, per ml, and was considered to be the same as the number of nmol of 6-phosphogluconate generated per ml. The change in specific activity at the sites of tightly bound NADPH was given by:
 |
(2) |
but su is a function of sb, as indicated by the requirement that the total c.p.m. in the incubation mixture must remain constant. That is, SaNu=sbNb+suNu or
 |
(3) |
Substitution of eqn (3) into (2), rearrangement and integration, resulted in:
 |
(4) |
in which C is the constant of integration.
With the boundary condition that sb must equal 0 when n is 0, eqn 4 becomes, in which r=(Nb+Nu)/NbNu:
 |
(5) |
‘Percentage equilibration’ (sb, %) was defined as the specific activity of the bound [14C]NADPH as a percentage of the specific activity of the bound and unbound [14C]NADPH when the two are fully equilibrated. Consequently:
 |
(6) |
Measurement of the amount of (NADPH)b displaced by [14C]NADPH during prevention of the formation of compound II
At the following final concentrations, catalase (8 μM) was exposed, at 37 °C, to [14C]NADPH (2 μM) that was kept constantly in a reduced state by the presence of yeast G6P dehydrogenase (3.3 μg·ml−1) and G6P (1.0 mM). Each reaction mixture contained glucose oxidase (1.6 μg·ml−1 or 8.6 nM). H2O2 was generated in the designated mixtures at a rate of 180 nmol·ml−1·h−1 by the addition of glucose (5 mM). At specified intervals, aliquots were withdrawn for measurement of 6-phosphogluconate concentration and catalase-bound [14C]NADPH. Na/K phosphate buffer (1.8 ml; 50 mM; pH 6.5) was added to 0.2 ml of each aliquot in a UFC8 030 ultrafiltration device. These 2.0-ml samples were mixed, then concentrated to the starting volume (0.2 ml), then mixed again. In separate scintillation vials, 50 μl of the concentrated catalase and 50 μl of the ultrafiltrates were placed. No quenching by catalase was observed. The amount of [14C]NADPH bound to catalase was estimated, after a single 10-fold ultrafiltration/wash, from the difference in c.p.m. between aliquots, and ultrafiltrates of the aliquots. The specific activity of the (NADPH)b was denoted by sb as nmol of [14C]NADPH per nmol of catalase. The remaining 0.2 ml of each aliquot was placed in boiling water for 2 min to stop the reaction, centrifuged at 1000 g for 5 min, and the supernatant solutions were used for a fluorometric determination of 6-phosphogluconate [20] with a Farrand A4 fluorometer.
RESULTS
Evidence for NADPH:(NADP+)b reductase activity in the absence of H2O2
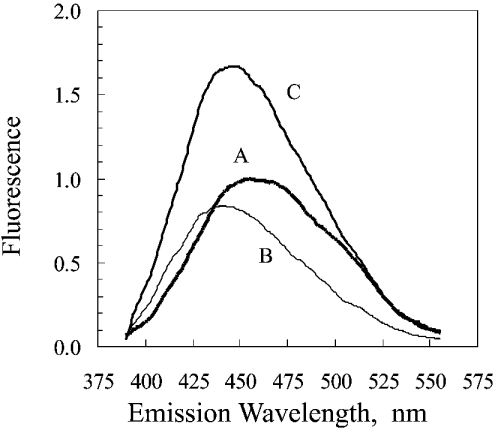
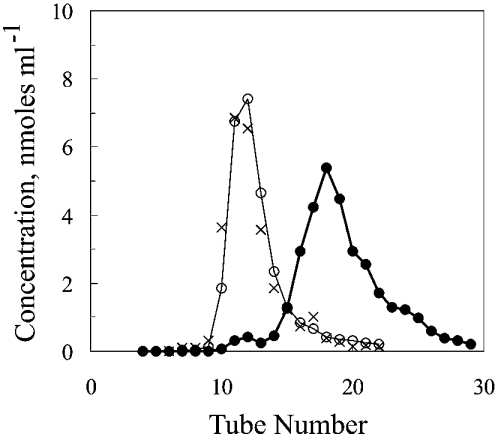
The fluorescence spectrum of Figure 1 revealed that exposure of bovine liver catalase to NADPH, then removal of excess NADPH by Sephadex chromatography, caused an increase in content of NADPH. The fluorescence of the NADPH tightly bound to catalase was greater than that of free NADPH at the same concentration, as has been reported for another NADPH-binding enzyme [22]. Because the available spectrofluorometer was restricted for use only with non-radioactive material, an identical experiment was performed using [14C]NADPH with chromatography on a G-25 Sephadex column but without analysis in a spectrofluorometer. The result was a distribution in which almost no [14C]NADPH appeared in the tubes containing catalase (Figure 2).
Figure 1. Fluorescence spectra of NADPH and catalase-bound NADPH.
The majority of the present study was based on the approach used by Hillar et al. [12]. The excitation wavelength was 340 nm. The spectra are of the following in 0.05 M phosphate buffer, pH 6.5, after subtraction of the spectrum of the phosphate buffer: A, 1.0 μM NADPH; B, 1.0 μM bovine liver catalase; C, 1.0 μM catalase that had been exposed to NADPH. Exposure to NADPH was carried out by incubating, for 30 min at 25 °C, 1.2 ml of a solution consisting of 40 μM catalase, 42 μM NADPH and 0.05 M phosphate buffer, pH 6.5, then removal of the unbound NADPH by chromatography on a 1.5 cm×14 cm column of G-25 Sephadex. The fluorescence intensity was standardized so as to give a value of 1.0 for the maximum reading of the 1.0 μM NADPH.
Figure 2. Separation of loosely bound [14C]NADPH from catalase by chromatography on a column of G-25.
The distributions are those obtained in the experiment of Figure 1. ×, catalase after exposure to unlabelled NADPH; ○, catalase after exposure to [14C]NADPH; ●, [14C]NADPH. The ratio of nmol of [14C]NADPH bound per nmol of catalase was 0.07 in the solution pooled from tubes containing most of the catalase (tubes 11–14).
Evidence against displacement during exposure to H2O2
Testing for [14C]NADPH displacement of (NADPH)b during exposure to H2O2 required a method more rapid than the column chromatographic approach used in the experiments shown in Figures 1 and 2. An ultrafiltration method (see the Experimental section) proved to be faster, but had the limitation of incomplete removal of loosely bound NADPH. Using ultrafiltration washing, we determined whether or not this loose binding represented a specific binding site. With catalase at a concentration of 8 μM and [14C]NADPH added to 5 different concentrations (see the Experimental section), the dissociation constant was found to be 2.68±0.38 μM. The maximum number of binding sites, however, was only 0.29±0.02 nmol per nmol of catalase, disproving the proposal that the weak binding of NADPH came from a specific site. The effect of the weak non-specific binding of NADPH was offset by the ultrafiltration–washing of the procedure and by subtracting the [14C]NADPH binding in the absence of H2O2 from the [14C]NADPH binding in the presence of H2O2 (Table 1). An equation was derived (see the Experimental section) for predicting the amount of [14C]NADPH that should be bound to the catalase for a given amount of 6-phosphogluconate formed (NADPH oxidized). The equation assumes the validity of the displacement hypothesis, in which the (NADPH)b of catalase becomes oxidized in preventing the formation of compound II, and then one molecule of labelled NADPH displaces each resulting molecule of (NADP+)b. The percentage of displacement is the specific activity of (NADPH)b, expressed as a percentage of Sm, the specific activity after complete equilibration, when the unbound and tightly bound NADPH would have the same specific activity. The observed displacement percentage (sb%) was much less than would be expected from the equation if the displacement hypothesis were valid (Table 1). A similar, large discrepancy between observed and expected sb% was found at a catalase concentration of 16 μM (results not shown).
Table 1. A test of the hypothesis that unbound NADPH displaces tightly bound NADP+ during the prevention of the formation of compound II.
For further details, see the Experimental section. Catalase was exposed, at 37 °C, to [14C]NADPH that was kept constantly in a reduced state by the presence of yeast G6P dehydrogenase and G6P. Each reaction mixture contained glucose oxidase (1.6 μg·ml−1). H2O2 was generated in the indicated mixtures by the addition of glucose. At the indicated intervals, aliquots were withdrawn for measurement of 6-phosphogluconate concentration and catalase-bound [14C]NADPH. The amount of NADPH oxidized (n) was considered to be the amount of 6-phosphogluconate generated. The reactions were stopped by placing in a boiling water bath; incubation times therefore were slightly greater than indicated. Difference=(with H2O2−without H2O2) for each case.
| sb (nmol of [14C]NADPH/mol of catalase) | n (6-phosphogluconate) (nmol·ml−1) | Displacement (%) | ||||||
|---|---|---|---|---|---|---|---|---|
| Incubation time (min) | +H2O2 | −H2O2 | Difference | +H2O2 | −H2O2 | Difference | Expected† | Observed‡ |
| 0 | 0.018 | 0.017 | 0.001 | 8.1 | 1.1 | 7.0 | 98.7 | 0.6 |
| 30 | 0.050 | 0.048 | 0.002 | 19.4 | 2.1 | 17.3 | 100.0 | 1.0 |
| 60 | 0.048 | 0.046 | 0.002 | 26.4 | 1.8 | 24.6 | 100.0 | 1.2 |
| 120 | 0.049 | 0.046 | 0.004 | 58.9* | 3.0 | 55.9 | 100.0 | 2.0 |
* Less than 0.05 nmol·ml−1 of 6-phosphogluconate was generated in 120 min when G6P dehydrogenase was omitted from this incubation mixture.
† From eqn 6 (see the Experimental section) and the values for difference for n. r=0.625 nmol−1 and Sm=30370 c.p.m. nmol−1.
‡ From eqn 6 and the values for difference for sb.
Comparison of rates
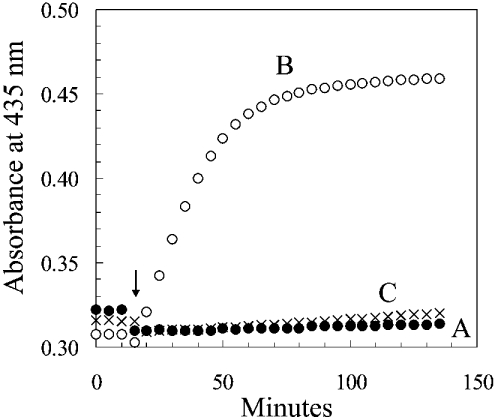
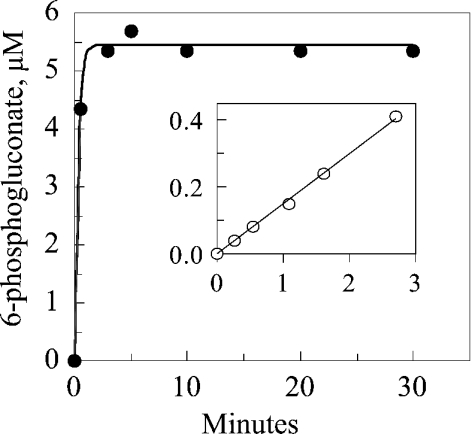
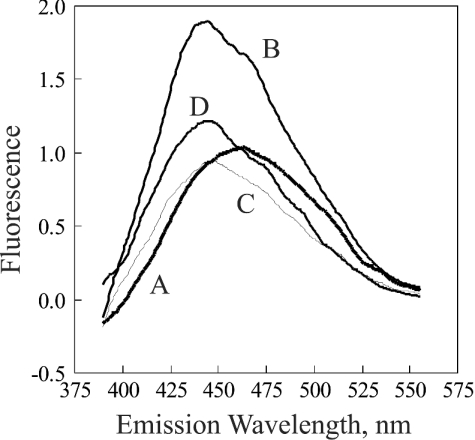
Bovine liver catalase was incubated under the conditions described in Table 1, in which the catalase is exposed to H2O2 that was generated at a constant rate by glucose and glucose oxidase. Figure 3 depicts the absorbance of the reaction mixtures at 435 nm. As calculated from the increase in millimolar specific absorbance of compound II at 435 nm of 32 [10], approx. two-thirds of the catalase became compound II in the presence of H2O2 (reaction B), but almost no compound II was formed when NADPH was present (reaction C). This finding agrees with the previous evidence that NADPH is capable of protecting catalase against a serious degree of inactivation under conditions of catalase and NADPH concentrations, and rates of H2O2 generation, that have been considered to be physiologically realistic [9]. The added NADP of reaction C was maintained in a reduced state by the presence of G6P dehydrogenase and G6P. As a consequence, one molecule of 6-phosphogluconate was generated for each molecule of NADPH that had been oxidized to NADP+. The rate of formation of 6-phosphogluconate, therefore, represented the rate of oxidation of NADPH (Table 1). The initial slope of reaction B indicated that compound II was formed, in the absence of NADPH, at an initial rate of 0.12 nmol·ml−1·min−1. In contrast, the slope of the results in Table 1 indicates that NADPH was oxidized at a rate of 0.41 nmol·ml−1·min−1 in the course of preventing the formation of compound II in a solution in which the catalase concentration was 8 μM (Table 2). The experiment shown in Figure 4 was an attempt to see if the rate of the NADPH:(NADP+)b reductase reaction could be sufficient to match the rate at which (NADPH)b might be oxidized. The rate of the reaction was so rapid as to be difficult to measure by the method used. The least-squares fit to the results indicated that the rate constant was over 3 nmol·ml−1 per micromolar concentration of (NADP+)b, and that the initial (NADP+)b concentration in the 24 μM catalase was 5.5 μM. Nearly one-fourth of the binding sites, therefore, contained NADP+, and the initial rate was approx. 16 μmol·ml−1·min−1 (3×5.5) (Table 2). In contrast, the rate of oxidation of (NADPH)b was very slow in the absence of added NADPH and in the presence of H2O2 (Figure 5). (NADPH)b was oxidized slowly when the catalase concentration was 1 μM (Figure 3) and even slower when the catalase concentration was 7.6 μM, even though the ratio of the rate of H2O2 generation to catalase concentration was the same at the two concentrations (Figure 3). If the (NADPH)b of Figure 5 had been oxidized as rapidly as was free NADPH in the experiments of Table 1 and Figure 3, all of the (NADPH)b would have been oxidized to (NADP+)b in a few minutes; yet only a third to a half was oxidized in 1 h. A comparison of these various rates is given in Table 2.
Figure 3. Prevention of the formation of compound II by NADPH at low concentrations.
The experimental conditions were similar to those of Table 1. With the additions at 15 min, the three reaction mixtures had a volume of 3.0 ml and comprised, at the final concentrations: in all three, 0.05 M phosphate buffer, pH 6.5, and catalase, 8.0 μM; in B and C, 1.6 μg·ml−1 glucose oxidase; in A and C, 2 μM [14C]NADPH and the NADPH-regenerating system (1.0 mM G6P and 3.3 μg·ml−1 yeast G6P dehydrogenase). After 15 min at 37 °C (arrow), 0.15 ml of water was added to reaction mixture A, and the generation of H2O2 was started at a rate of 180 nmol·ml−1·h−1 in reaction mixtures B and C by the addition of 0.15 ml of 100 mM glucose.
Table 2. Summary of different reaction rates.
| Reaction | Catalase (μM) | NADPH (μM) | H2O2 rate (nmol·ml−1·min−1) | Reaction rate (nmol·ml−1·min−1) | Origin of data |
|---|---|---|---|---|---|
| NADPH:(NADP+)b reductase | 24 | 2 | 0.0 | >16* | Figure 4 |
| Oxidation of NADPH | 8 | 2 | 3.0 | 0.41 | Table 1 |
| Formation of compound II | 8 | 0 | 3.0 | 0.12 | Figure 3 |
| Oxidation of (NADPH)b | 7.4 | 0 | 1.0 | 0.03 | Figure 5 |
* The reaction rate is the estimated rate at an initial (NADP+)b concentration of 5.5 μM.
Figure 4. Kinetics of the reduction of (NADP+)b by NADPH, as measured by the formation of 6-phosphogluconate.
The reaction mixture was incubated at 37 °C and contained, in the following final concentrations: 24 μM bovine liver catalase; 2 μM NADPH; 300 μM G6P; 1.7 μg·ml−1 yeast G6P dehydrogenase (added at 0 time); 50 mM phosphate buffer, pH 6.5. Aliquots were taken at the times indicated for determination of 6-phosphogluconate concentrations (see the Experimental section). With this reaction mixture, each μmol of generated 6-phosphogluconate represents a μmol of (NADP+)b converted into (NADPH)b. Inset: calibration line for 6-phosphogluconate; y-axis, fluorescence; x-axis, 6-phosphogluconate, μM.
Figure 5. Fluorescence spectra of catalase exposed to H2O2.
The excitation wavelength was 340 nm. The catalase was mixed with NADPH in the ratio of 1.0 nmol of NADPH per nmol of catalase. Excess NADPH was removed by a single ultrafiltration–wash (see the Experimental section). The spectra are of the following in 0.05 M phosphate buffer, pH 6.5, after subtraction of the spectrum of the phosphate buffer: A, 1.0 μM NADPH; B, 1.0 μM bovine liver catalase without exposure to H2O2; C, 0.95 μM catalase after 1 h of exposure to H2O2 generated by glucose and glucose oxidase; D, 0.95 μM catalase after 1 h of exposure (at a catalase concentration of 7.6 μM) to H2O2. For both C and D, the rate of generation of H2O2 was 60 nmol·h−1 per nmol of catalase at 37 °C.
Evidence for transhydrogenation from NADH
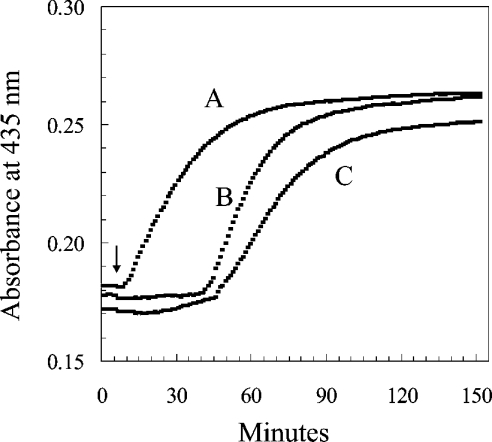
The experiments of Figures 1 and 2 were performed with NADH rather than with NADPH. Separation of the catalase/dinucleotide mixture on the G-25 column (as in Figure 2) was performed twice with NADH and once with [14C]NADH. Exposure of catalase to NADH approximately doubled the intensity of the catalase fluorescence (ratios of 2.3 and 2.4), and only 0.02 nmol of [14C]NADH was bound per nmol of catalase (results not shown). Figure 6 is a comparison of the effectiveness of NADPH versus NADH in preventing the formation of compound II. Both NADPH and NADH retarded the formation of compound II for 30 –35 min. The retardation by NADH lasted longer than that of NADPH, but was accompanied by the appearance of a small amount of compound II as the NADH neared depletion (reaction C). This was interpreted as meaning that NADH was used nearly as well as NADPH in preventing compound II formation, although slightly less rapidly than NADPH at low NAD(P)H concentrations.
Figure 6. Comparison of the efficiency of NADH versus NADPH in preventing the formation of compound II.
Additions were carried out at 5 min, the 3 reaction mixtures had a volume of 3.0 ml and contained, in the following final concentrations: in all three, 0.05 M phosphate buffer, pH 6.5, 1.6 μg·ml−1 glucose oxidase, 4.0 μM catalase. Reaction mixture A contained neither NADPH nor NADH. Reaction mixture B contained NADPH, and reaction mixture C contained NADH, both at final concentrations of 10 μM. After 5 min at 37 °C (arrow), the generation of H2O2 was started at a rate of 180 nmol·ml−1·h−1 in all 3 reaction mixtures by the addition of 0.05 ml of 100 mM glucose. For clarity, absorbance readings of reaction C were decreased by 0.01.
DISCUSSION
In comparison with our previously published work [2,9], the present study revealed important differences in the properties of two commercially available enzymes, NAD kinase and bovine liver catalase, even when they were obtained from the same company as before. The NAD kinase was so contaminated with ATPase as to be unusable, necessitating the use of an NAD kinase that is not commercially available (see the Experimental section). The difference in properties of the bovine liver catalase, however, facilitated the present study. Previously, the (NADP)b was entirely (NADPH)b, whereas some of the (NADP)b of the presently used catalase was NADP+. Presumably, the differences in these two enzymes resulted from changes in recent decades in the way these two commercially available enzymes are prepared.
The presently demonstrated effectiveness of NADH in reducing (NADP+)b and preventing compound II formation seems to be at variance with the importance of NADPH in preventing oxidative stress in human erythrocytes. Much of the evidence for that importance comes from studies of genetic deficiencies of G6P dehydrogenase, the most common of the potentially lethal human enzyme deficiencies [23]. Such cells have an impaired ability to generate NADPH, necessary for the removal of H2O2 by not only catalase, but also the glutathione reductase–peroxidase sequence. The human erythrocyte, however, has most of its NADP in the form of NADPH, whereas its NAD is nearly all in the form of NAD+ [24]. Of interest is whether NADH protects catalase in other cells.
NADPH is known to be effective, and to be oxidized, in preventing the inactivation of catalase exposed to H2O2, but the function of (NADPH)b has been unclear. The following features suggest that (NADPH)b may participate in preventing the formation of compound II: the co-evolution of (NADPH)b with the tendency of catalase to become compound II [3], and the presently demonstrated ability of unbound NADPH to reduce (NADP+)b to (NADPH)b. Without such reduction, or some type of replacement, (NADPH)b would be an inadequate reservoir of NADPH for preventing compound II formation: the amount of (NADPH)b is small relative to the rate at which NADPH is needed (Figure 3 and Table 1) to prevent compound II formation when catalase is exposed to H2O2. When bovine liver and human catalase are stripped of (NADP)b, they are capable of taking up NAD(P) with an order of affinity of NADPH>NADH≫NADP+>NAD+ [2]. One possible mechanism utilizing (NADPH)b, therefore, is that (NADPH)b becomes oxidized in the process of preventing compound II formation, and the resulting (NADP+)b is displaced by NADPH (the displacement hypothesis). This mechanism was disproved by the present study. Another possibility is that (NADPH)b becomes oxidized in the process of preventing compound II formation, and, as discovered in the present study, the resulting (NADP+)b is reduced back to (NADPH)b by free or transiently bound NADPH. Favouring this mechanism is the finding in the present study of the relatively rapid rate of the NADPH:(NADP+)b reductase reaction. Against this mechanism is the present finding that the rate of oxidation of (NADPH)b without added NADPH is much less than the rate at which added NADPH is oxidized (Table 2). Either of two possibilities might explain how this mechanism is valid despite the impediment. The first possibility is that, in the presence of H2O2, when catalase is in its state intermediate between compound I and compound II, a partial electron shift occurs within or about (NADPH)b such that the (NADPH)b is unable to pass its reducing equivalents to the haem group until a molecule of unbound NADPH becomes positioned nearby. It is to be recalled that (NADPH)b is on the surface [5]. As a result, the reducing equivalents of (NADPH)b might be utilized in the presence of free or transiently bound NADPH, and the resulting (NADP+)b is reduced by the free or transiently bound NADPH. A second possibility is that the (NADPH)b of bovine liver catalase is a remnant of a system in which (NADPH)b was once a necessary intermediate in the prevention of compound II formation by NADPH, but the system has evolved in bovine liver catalase into one in which NADPH bypasses (NADPH)b and provides its reducing equivalents directly for compound II prevention. Studies of the NADPH-binding catalases of other species should allow a distinction to be made between these two possibilities.
Acknowledgments
We thank Professor Mathias Ziegler and Dr Nadine Pollak for generously providing the human recombinant NAD kinase, and Dr Claudia Bolognesi for providing access to, and expertise on, the spectrofluorometer. This research was partly supported by grants from MS ICS 070.1/RF00.182 and by MIUR (FIRB) to G. F. G.
References
- 1.Kirkman H. N., Gaetani G. F., Clemons E. H. NADP-binding proteins causing reduced availability and sigmoid release of NADP+ in human erythrocytes. J. Biol. Chem. 1986;261:4039–4045. [PubMed] [Google Scholar]
- 2.Kirkman H. N., Gaetani G. F. Catalase: a tetrameric enzyme with four tightly bound molecules of NADPH. Proc. Natl. Acad. Sci. U.S.A. 1984;81:4343–4347. doi: 10.1073/pnas.81.14.4343. [DOI] [PMC free article] [PubMed] [Google Scholar]
- 3.Nicholls P., Fita I., Loewen P. C. Enzymology and structure of catalases. Adv. Inorg. Chem. 2001;51:51–106. [Google Scholar]
- 4.Murthy M. R. N., Reid T. J., Sicignano A., Tanaka N., Rossmann M. G. Structure of beef liver catalase. J. Mol. Biol. 1981;152:465–499. doi: 10.1016/0022-2836(81)90254-0. [DOI] [PubMed] [Google Scholar]
- 5.Fita I., Rossmann M. G. The NADPH binding site on beef liver catalase. Proc. Natl. Acad. Sci. U.S.A. 1985;82:1604–1608. doi: 10.1073/pnas.82.6.1604. [DOI] [PMC free article] [PubMed] [Google Scholar]
- 6.Nicholls P., Schonbaum G. R. The Enzymes. In: Boyer P. D., Lardy H., Myrback K., editors. New York: Academic Press; 1963. pp. 147–225. [Google Scholar]
- 7.Chance B. The reactions of catalase in the presence of the notatin system. Biochem. J. 1950;46:387–402. doi: 10.1042/bj0460387. [DOI] [PMC free article] [PubMed] [Google Scholar]
- 8.Jouve H. M., Pelmont J., Gaillard J. Interaction between pyridine adenine nucleotides and bovine liver catalase: a chromatographic and spectral study. Arch. Biochem. Biophys. 1986;248:71–79. doi: 10.1016/0003-9861(86)90402-9. [DOI] [PubMed] [Google Scholar]
- 9.Kirkman H. N., Galiano S., Gaetani G. F. The function of catalase-bound NADPH. J. Biol. Chem. 1987;262:660–666. [PubMed] [Google Scholar]
- 10.Kirkman H. N., Rolfo M., Ferraris A. M., Gaetani G. F. Mechanisms of protection of catalase by NADPH. Kinetics and stoichiometry. J. Biol. Chem. 1999;274:13908–13914. doi: 10.1074/jbc.274.20.13908. [DOI] [PubMed] [Google Scholar]
- 11.Hillar A., Nicholls P. A mechanism for NADPH inhibition of catalase compound II formation. FEBS Lett. 1992;314:179–182. doi: 10.1016/0014-5793(92)80969-n. [DOI] [PubMed] [Google Scholar]
- 12.Hillar A., Nicholls P., Switala J., Loewen P. C. NADPH binding and control of catalase compound II formation: comparison of bovine, yeast, and Escherichia coli enzymes. Biochem. J. 1994;300:531–539. doi: 10.1042/bj3000531. [DOI] [PMC free article] [PubMed] [Google Scholar]
- 13.Almarsson Ö., Sinha A., Gopinath E., Bruice T. C. Mechanism of one-electron oxidation of NAD(P)H and function of NADPH bound to catalase. J. Am. Chem. Soc. 1993;115:7093–7102. [Google Scholar]
- 14.Olson L. P., Bruice T. C. Electron tunneling and ab initio calculations related to the one-electron oxidation of NAD(P)H bound to catalase. Biochemistry. 1995;34:7335–7347. doi: 10.1021/bi00022a006. [DOI] [PubMed] [Google Scholar]
- 15.Bicout D. J., Field M. J., Gouet P., Jouve H. M. Simulations of electron transfer in the NADPH-bound catalase from Proteus mirabilis PR. Biochim. Biophys. Acta. 1995;1252:172–176. doi: 10.1016/0167-4838(95)00123-c. [DOI] [PubMed] [Google Scholar]
- 16.Gouet P., Jouve H. M., Dideberg O. Crystal structure of Proteus mirabilis PR catalase with and without bound NADPH. J. Mol. Biol. 1995;249:933–954. doi: 10.1006/jmbi.1995.0350. [DOI] [PubMed] [Google Scholar]
- 17.Aebi H. Catalase in vitro. Methods Enzymol. 1984;105:121–126. doi: 10.1016/s0076-6879(84)05016-3. [DOI] [PubMed] [Google Scholar]
- 18.Green M. J., Hill H. A. O. Chemistry of dioxygen. Methods Enzymol. 1984;105:3–22. doi: 10.1016/s0076-6879(84)05004-7. [DOI] [PubMed] [Google Scholar]
- 19.Lerner F., Niere M., Ludwig A., Ziegler M. Structural and functional characterization of human NAD kinase. Biochem. Biophys. Res. Commun. 2001;288:69–74. doi: 10.1006/bbrc.2001.5735. [DOI] [PubMed] [Google Scholar]
- 20.Lowry O. H., Passonneau J. V. Academic Press: New York; 1972. A Flexible System of Enzymatic Analysis; pp. 17pp. 205–207. [Google Scholar]
- 21.Cleland W. W. Statistical analysis of kinetic data. Adv. Enzymol. 1967;29:1–32. doi: 10.1002/9780470122747.ch1. [DOI] [PubMed] [Google Scholar]
- 22.Kirkman H. N. Glucose 6-phosphate dehydrogenase from human erythrocytes. I. Further purification and characterization. J. Biol. Chem. 1962;237:2364–2370. [PubMed] [Google Scholar]
- 23.Luzzatto L., Notaro R. Protecting against bad air. Science. 2001;293:442–443. doi: 10.1126/science.1063292. [DOI] [PubMed] [Google Scholar]
- 24.Canepa L., Ferraris A. M., Miglino M., Gaetani G. F. Bound and unbound pyridine dinucleotides in normal and glucose-6-phosphate dehydrogenase-deficient erythrocytes. Biochim. Biophys. Acta. 1991;1074:101–104. doi: 10.1016/0304-4165(91)90046-j. [DOI] [PubMed] [Google Scholar]


