Abstract
The mammalian gene for SREBP-1 (sterol-regulatory-element-binding protein 1) contains two promoters that control the production of two proteins, SREBP-1a and -1c, and each contains a unique N-terminal transcriptional activation domain, but they are otherwise identical. The relative level of each mRNA varies from tissue to tissue and they respond differently to regulatory stimuli. SREBP-1c is more abundantly expressed in liver, where its level is also regulated by insulin and liver X receptor activators, and it is also autoregulated by SREBPs. In contrast, SREBP-1a mRNA levels are relatively low and constant in different tissues and few studies have specifically analysed its pattern of expression and regulation. In the present study, we show that the promoter for SREBP-1a is contained in a very small promoter-proximal region containing two Sp1 sites. The small and relatively simple structure for its promoter provides an explanation for the low level of SREBP-1a expression. Additionally, since Sp1 has been implicated in the modest regulation of several genes by insulin, its involvement in the expression of the SREBP-1a promoter provides an explanation for the modest insulin regulation observed in animal experiments.
Keywords: gene expression, nutrient regulation, promoter, Sp1, sterol-regulatory-element-binding protein (SREBP)
Abbreviations: EMSA, electrophoretic mobility-shift assay; FBS, fetal bovine serum; HEK-293T cells, human embryonic kidney 293 T cells; NF-κB, nuclear factor kappa B; RPA, RNase protection assay; SREBP, sterol-regulatory-element-binding protein; TNF-α, tumour necrosis factor-α
INTRODUCTION
SREBPs (sterol-regulatory-element-binding proteins) are important regulators of mammalian lipid metabolism [1]. The SREBP-1 gene encodes two almost identical proteins, SREBP-1a and SREBP-1c, which are expressed from overlapping mRNAs. A separate gene encodes a single mRNA and protein for SREBP-2. The two SREBP-1 proteins are identical except at the extreme N-termini. Two separate promoters control mRNA initiation giving rise to unique 5′-ends that are separated by several kilobases in the genomic DNA. Transcription at each promoter results in a unique 5′-terminal exon in each mRNA that is spliced to a second exon that is common to both. Translation is initiated in the first exon and continues in the identical reading frame across the splice junction into exon 2. Therefore the two proteins have different N-termini but are identical from the common second exon onwards. SREBP-1a has 28 unique amino acids from its first exon and SREBP-1c has only four (in addition to the initiator methionine residue). The activation domain of the SREBP-1 proteins is located in this N-terminal region [2,3]. SREBP-1a has a potent activation domain, which interacts efficiently with co-activators such as p300/CREB-binding protein (where CREB stands for cAMP-response-element-binding protein) and the mammalian mediator complex [2,4]. The shorter N-terminus of SREBP-1c is a weak activation domain and interacts weakly with the same transcriptional co-activators [2,5].
Since there are significant differences in the functional activity of SREBP-1a and -1c and their differential expression is dependent on the activity of different promoters, it is important to study how each promoter is regulated to determine how the ratios of the two proteins would vary under different conditions during development, in different tissues and in response to changing physiological conditions. So far, significant attention has been given to the regulation of SREBP-1c and SREBP-2. The SREBP-1c promoter is regulated by glucose, liver X receptor and is also auto-regulated by SREBPs [6–8]. Additionally, its expression also varies significantly from tissue to tissue [9]. Studies in animals have shown that the insulin regulation of SREBP-1c is key to the lipogenic response of the liver to a fasting/high carbohydrate refeeding regimen [10]. The promoter for the SREBP-2 gene is regulated by thyroid hormone [11] and is also autoregulated by SREBPs [12].
The ratio of SREBP-1a to SREBP-1c mRNA varies from 10:1 in spleen to 1:10 in liver [9]. This two order of magnitude difference is because SREBP-1c mRNA levels vary from tissue to tissue and SREBP-1a mRNA appears to be maintained at a consistently low level. This suggests that the SREBP-1a promoter would be simple and relatively weak. In this paper, we present evidence to support this hypothesis. We show that, for maximal levels of activity, the SREBP-1a promoter requires only 75 bp of the 5′-flanking sequence. We further identified two binding sites for Sp1 within this region, probably what the cis-acting DNA needed for maximal SREBP-1a promoter activity. Interestingly, in the studies that demonstrated a significant regulation of SREBP-1c mRNA levels by fasting/refeeding, there was a similar response for the SREBP-1a transcript. Since Sp1 sites have been identified in the insulin response regions of several genes [13], it is probable that the Sp1 response elements in the SREBP-1a promoter are important for the insulin-dependent changes in its mRNA in liver.
MATERIALS AND METHODS
Plasmids
A BAC (bacterial artificial chromosome) containing the mouse genomic DNA encompassing the SREBP-1a gene (BAC310-C22) was obtained from the Sanger Institute (Hinxton, Cambridge, U.K.), and the region corresponding to −2500 to +29 (relative to the SREBP-1a mRNA 5′-end) was amplified by PCR using the Advantage Genomic cloning kit from Clontech. This fragment was cloned into the polylinker upstream of the luciferase coding sequence in pGL3 (Promega). Deletion constructs for the present study were made by PCR amplification with strategically designed primers, and point mutations were constructed using the site-directed mutagenesis kit from Stratagene. CMV–β-gal (where CMV stands for cytomegalovirus), pPAC-β-gal and pPACSp1 have all been described previously [14]. The NF-κB (nuclear factor κB) luciferase reporter contains tandem copies of the NF-κB site from the mouse interleukin-2 promoter upstream of luciferase and has been described before [15].
Cells and media
Drosophila SL2 cells were cultured at 25 °C in Shields and Sang Drosophila medium (Sigma) containing 10% (v/v) heat-inactivated FBS (fetal bovine serum). HepG2 cells (A.T.C.C.), were grown in minimal essential medium (Life Technologies, Gaithersburg, MD, U.S.A.) containing 10% FBS (v/v) at 37 °C and 5% CO2. HeLa cells and HEK-293T cells (human embryonic kidney 293 T cells) were maintained in Dulbecco's modified Eagle's medium (Irvine Scientific, Irvine, CA, U.S.A.) with 10% FBS and additives were purchased from Life Technologies.
Transient DNA transfections
All transfections were performed by a standard calcium phosphate co-precipitation method as described in [16]. Drosophila SL2 cells were plated at 1.2×10⁶ cells/60 mm dish and were transfected on the following day and harvested 48 h after transfection. All reporter plasmids were added at 2 μg/dish and the pPAC-β-gal control was added at 1 μg/dish. HepG2 cells were plated at 1.75×10⁵ cells/60 mm dish and transfected on the following day. After transfection, the cells were cultured for 4–6 h and subjected to a glycerol shock [10% (v/v) in PBS for 2 min], rinsed three times in PBS, re-fed with normal media and incubated for an additional 40 h before harvest. HEK-293T cells were plated in 6-well dishes at 3×10⁵ cells/well on day 0. On day 1, the cells were transfected by calcium phosphate co-precipitation. Individual plasmids used in each transfection are noted in the Figure legends. On day 2 (16 h post-transfection), the dishes were washed twice with 1×PBS and re-fed with complete media. Cells were harvested on day 3 and analysed for luciferase and β-galactosidase activities by standard methods cited below.
Enzyme assays
Luciferase activities were measured in a luminometer (Analytical Luminescence Monolight 2010) using 20 μl of cell extract and 100 μl of luciferin reagent (Promega). The β-galactosidase assays were performed using a standard colorimetric assay with 50 μl of cell extract using 2-nitrophenyl β-D-galactopyranoside as the substrate [17]. The luciferase activities in relative light units were divided by the β-galactosidase activities (absorbance at 420 nm/h) for each sample, to control for variation in transfection efficiency and cell growth.
Animal feeding studies
For the fasting experiments, B6129 male mice were obtained from Taconic (Germantown, NY, U.S.A.) and maintained on a 12 h light/dark cycle (the dark cycle was from 19:00 to 07:00) with free access of food and water. Mice were allowed to adapt to the new environment for at least 1 week before experiments. Mice (7–8 weeks old) were randomly divided into three groups. One group was fed ad libitum with regular diet, the second group was fasted for 24 h and the third group was fasted for 24 h followed by refeeding with regular diet for 12 h before killing. All mice were killed at the same time between 08:00 and 10:00. Livers were removed and immediately frozen in liquid nitrogen and stored at −80 °C until mRNA was extracted as described below.
mRNA isolation and RPA (RNase protection assay)
Total RNA was isolated from mouse livers or other tissues using TRIzol® (Life Technologies). Total RNA samples (20 μg) were subjected to RPA using the RPAII kit (Ambion, Austin, TX, U.S.A.). 32P-Labelled cRNA probes were generated from pBlueScript-mSREBP-1c, mSREBP-1a-pGEM-T and L32-pGEM-2 constructs by in vitro transcription using the MAXIscript kit (Ambion). RPAs were performed by adding a cRNA probe for either SREBP-1a or SREBP-1c mRNA (1×10⁵ c.p.m.) and a cRNA probe (1×10⁵ c.p.m.) for L32 mRNA. L32 cRNA probe was used to normalize total amounts of RNA per lane. After digestion with RNase A/RNase T1, protected fragments were resolved on 8 M urea/5% (v/v) polyacrylamide gels, dried and exposed to a Kodak BioMAX film, followed by scanning with an HP 7400c flat bed scanner, and signal intensities were used to approximate mRNA levels, which were then quantified using the Quantity one software (Bio-Rad).
EMSA (electrophoretic mobility-shift assay)
Nuclear extracts from SL2 cells transfected with the pPACSp1 expression construct were the source of Sp1 and were prepared as described in [18]. Similarly prepared nuclear extracts from HeLa cells treated with TNF-α (tumour necrosis factor-α) for 24 h were used as a source of NF-κB [19].
RESULTS
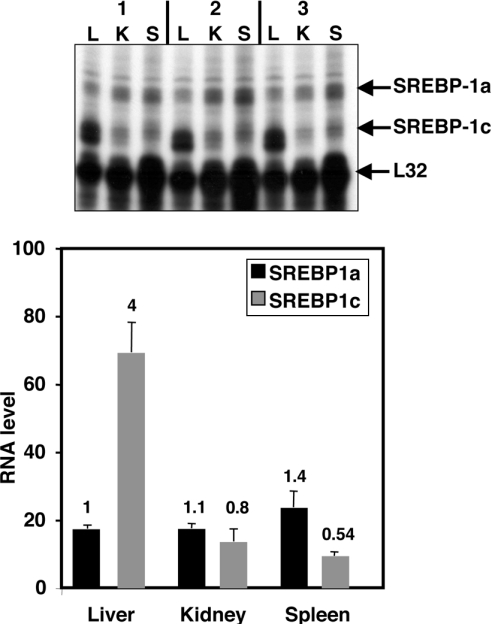
The SREBP-1 gene has two promoters that are differentially regulated as presented in the Introduction. Transcripts generated from each promoter can be distinguished by an RPA with probes that cross splice junctions unique to each mRNA. Shimomura et al. [9] used this technique to demonstrate that the ratio of SREBP-1a to SREBP-1c mRNA varies significantly. The two extremes are represented by liver, where SREBP-1c is significantly more abundant than SREBP-1a, and spleen, where the reverse is true. An example of this is shown in Figure 1 where RNase protection results using mRNA from liver, spleen and kidney were analysed and the corresponding signal intensities relative to the level of a control ribosomal protein L32 mRNA were measured. These results emphasize that the ratio between the two SREBP-1 transcripts varies significantly since the level of SREBP-1c mRNA varies, whereas that of SREBP-1a is pretty constant. SREBP-1c mRNA expression is highly regulated by oxysterol signalling through LXRs (liver X receptors), insulin signalling, and SREBP autoregulation. In contrast, little is known about SREBP-1a regulation. The results in Figure 1 suggest that transcription from the SREBP-1a promoter is low and similar across tissues.
Figure 1. mRNA levels for SREBP-1a and SREBP-1c in select tissues.
Total RNA was isolated from different tissues (L, liver; K, kidney; S, spleen) from three different mice (labelled 1–3) fed with a normal diet. Levels of SREBP-1a or -1c-specific mRNAs and the control ribosomal protein L32 mRNA were measured using an RPA as described in the Materials and methods section. The autoradiogram is shown in the upper panel. Different exposures of the gel were scanned and band intensities were measured for samples from all animals for each mRNA and values were normalized to the L32 signal. The ratio of the signal for 1a or 1c relative to L32 is plotted on the y-axis in the lower panel. The value for SREBP-1a in liver was set at 1 and the number on the top of each bar represents the value relative to this level.
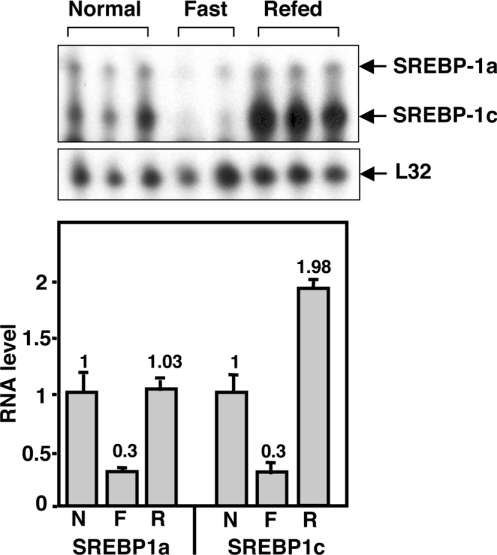
Several reports have provided evidence that SREBP-1c mRNA expression is low in fasting animals and induced by a refeeding procedure after a fast. This is a classic ‘lipogenic’ response pattern and is representative of several genes involved in the catabolism of carbohydrates and the synthesis of triacylglycerols. Liang et al. [10] have shown that most of the lipogenic response is gone when SREBP-1c is specifically knocked out in mice. However, the expression of SREBP-1a also follows a similar pattern of gene expression that is retained in the SREBP-1c knockout [10]. In a fasting/refeeding experiment that we performed, we noted that the magnitude of regulation for SREBP-1a and SREBP-1c was similar even though the absolute level of 1a mRNA was significantly lower (Figure 2).
Figure 2. Analysis of SREBP-1a or -1c mRNA levels during fasting and refeeding.
Mice were separated into three groups and fed ad libitum (normal) or fasted for 24 h or fasted for 24 h followed by a 12 h period of refeeding. Animals were killed and total RNA was harvested from liver and analysed by an RPA as described in the legend to Figure 1 and the Materials and methods section. The autoradiogram is shown in the upper panel and the positions of bands representing the indicated mRNAs are indicated. Different exposures of the gel were used to quantify signal intensities relative to the L32 control signal and the normalized signal intensities are plotted (lower panel) relative to the signal for either SREBP-1a or -1c fed ad libitum (N). Levels obtained in fasted (F) or fasted/re-fed (R) animals are also provided.
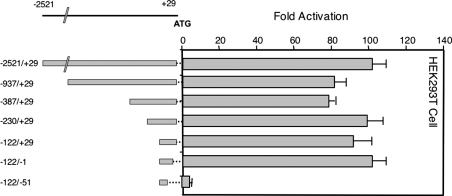
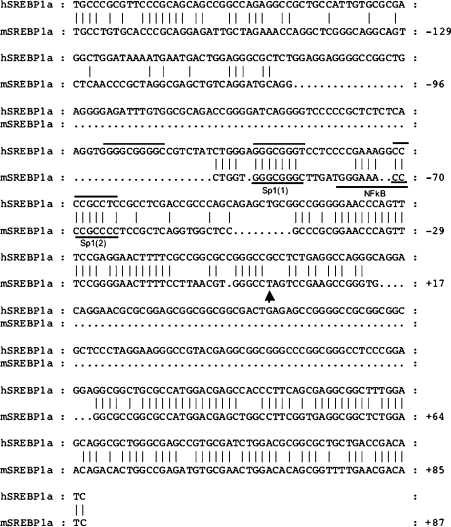
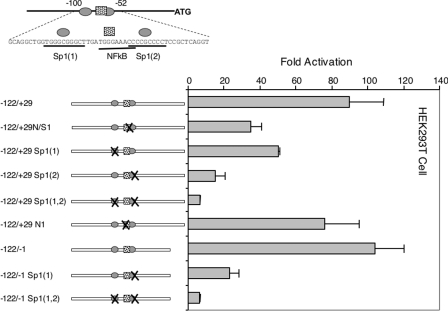
To study the mechanism of expression from the 1a promoter, we fused the mouse SREBP-1a promoter to luciferase and evaluated its activity in transient transfection experiments in HEK-293T cells (Figure 3). When a genomic fragment containing 2521 bp of the 5′-flanking sequence was analysed, reporter activity was 100-fold higher than in the empty pGL3-basic luciferase construct. A series of 5′- and 3′-truncations of this region resulted in identifying the region from −122 to +1 as retaining full promoter activity (Figure 3). When this region of the mouse SREBP-1a promoter was aligned with the corresponding sequence from the human gene, a very limited but focused region of identity was revealed (Figure 4). Within the highly conserved sequence there are two putative binding sites for Sp1 and little else that could be determined by simple predictions on the basis of known consensus sites. It should be noted that here is a potential site for NF-κB in the mouse promoter that is not conserved in the human gene. To evaluate the significance of the conserved potential Sp1 sites as well as the overlapping NF-κB site, we introduced point mutations into the sites and analysed the resulting mutant reporter plasmids for luciferase expression (Figure 5). Single mutations in each Sp1 site decrease the promoter activity by 2–4-fold, and the combined double mutation results in a 20-fold decrease in promoter activity. Thus the two conserved potential Sp1 sites are critical for promoter activity. However, mutation of the putative NF-κB element did not reduce promoter activity significantly.
Figure 3. The 5′-flanking sequence from the mouse SREBP-1a promoter up to the initiator methionine residue in the mRNA (−2521 to +29 relative to the mRNA start site) was fused to the firefly luciferase-coding sequence in pGL3 and analysed for promoter activity in HEK-293T cells as described in the Materials and methods section.
Serial deletions were made and also fused to luciferase as indicated. Each construct was analysed in triplicate and the average values relative to an internal control (CMV-β-gal) were calculated and plotted as fold activation above the value obtained for the empty pGL3 vector analysed in parallel.
Figure 4. Sequence alignment of the human and mouse genomic DNA regions encompassing the SREBP-1a mRNA initiation site (denoted by an arrowhead below the mouse sequence).
Regions of identity are denoted by vertical bars. The locations of putative DNA-binding sites for Sp1 and NF-κB are indicated and their relevance is discussed in the text.
Figure 5. Functional analysis of binding sites for Sp1 and NF-κB in the SREBP-1a promoter.
DNA containing the wild-type or indicated mutant versions of the mouse SREBP-1a promoter were fused to luciferase and analysed for promoter activity as described in Figure 3. N denotes a mutation in the putative NF-κB site. All constructs were analysed in triplicate and average values are plotted as fold activation above the value obtained for the empty pGL3 vector.
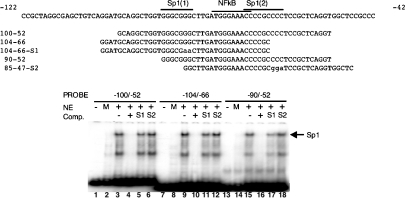
To evaluate directly whether the Sp1 protein truly binds to the putative sites in the proximal SREBP-1a promoter, we prepared nuclear extracts from Drosophila SL2 cells that were transfected with an expression vector for human Sp1 (Figure 6). We have used this system as a source of Sp1 protein in other studies [16,18]. Nuclear extracts from untransfected SL2 cells did not bind the probes used in the EMSA (lanes 2, 8 and 14). In contrast, there was a strong band corresponding to Sp1 binding when extracts from SL2 cells transfected with the Sp1 expression vector were used with wild-type EMSA probes from this region (lanes 3, 9 and 15). The binding was decreased when an excess of cold probe corresponding to the wild-type DNA was added (lanes 4, 10 and 16), but competition was not observed when competitor DNAs containing point mutations within the putative Sp1 recognition motifs were used (lanes 5, 6, 11, 12, 17 and 18). Thus the DNA sites predicted to function as Sp1 elements are required for maximal SREBP-1a promoter activity and they also bind Sp1 in vitro.
Figure 6. Binding of Sp1 to the SREBP-1a promoter analysed by EMSA.
The DNA sequence for the proximal region of the mouse SREBP-1a promoter, along with locations of the putative Sp1 and NF-κB sites, is shown in the upper panel. The sequences for individual probes derived from this sequence and used in the EMSA studies are shown below the wild-type sequence. Mutations generated in probes S1 and S2 are noted in lower-case. An autoradiogram from a typical EMSA is shown in the lower panel. The identity of the three probes that were 32P-labelled and used in the EMSA are shown. ‘NE’ denotes nuclear extract prepared from mock-transfected SL2 cells (M) or from SL2 cells transfected with the pPACSp1 expression vector (+). Where indicated, a 50-fold molar excess of the indicated unlabelled double-stranded oligonucleotide (‘Comp.’) was included in the binding reactions with the labelled probes. (+) denotes that the cold competitor was the same DNA used as a probe. S1 and S2 denote the use of mutant probes containing the mutations shown in the top of the Figure.
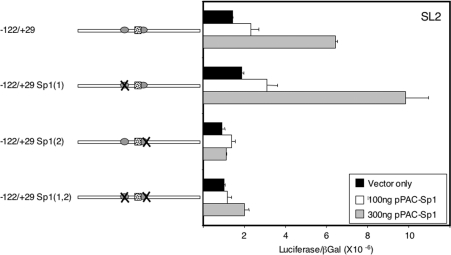
To determine directly whether changes in Sp1 expression result in changes in SREBP-1a promoter activity, we used a transient DNA transfection method in Drosophila SL2 cells (Figure 7). Expression of Sp1 along with the wild-type SREBP-1a promoter plasmid resulted in a dose-dependent activation of luciferase reporter activity. Importantly, mutations in the 5′-Sp1 site did not affect this stimulation significantly, whereas a mutation in the 3′-site or the double mutation totally eliminated the response to exogenous Sp1. Thus the 3′-site appears to be more crucial to promoter activity in SL2 cells.
Figure 7. SREBP-1a promoter is activated by Sp1 in SL2 cells.
Drosophila SL2 cells were used in a transfection assay along with the indicated SREBP-1a promoter plasmids. Where indicated, an expression vector for pPACSp1 was also included at either 100 or 300 ng. A control pPAC-β-gal plasmid was co-transfected in all samples as a control. Each construct was analysed in triplicate and the luciferase values were normalized to β-gal and plotted as indicated on the x-axis.
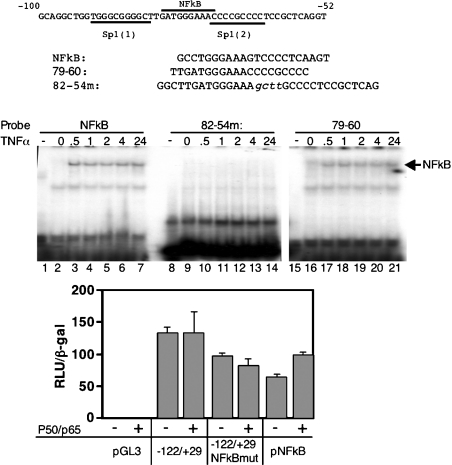
Even though mutations of the putative NF-κB site did not significantly affect expression from the SREBP-1a promoter (Figure 5), we evaluated NF-κB binding and activation (Figure 8). Nuclear translocation of endogenous NF-κB was activated by treating HeLa cells with TNF-α. Activated NF-κB bound to a known high-affinity NF-κB DNA site from the promoter (lanes 1–7). NF-κB also bound to a probe from the wild-type SREBP-1a promoter (lanes 15–21); however, there was no TNF-α-stimulated binding to a DNA fragment from the SREBP-1a promoter with a mutation introduced into the predicted NF-κB site (lanes 8–14). To evaluate NF-κB activation, we performed a transient DNA transfection experiment where expression constructs for the p50 and p65 subunits of NF-κB [19] were co-transfected along with the SREBP-1a promoter-luciferase reporter (Figure 8, bottom panel). Inclusion of the NF-κB expression constructs did not significantly affect expression from the wild-type SREBP-1a or a version containing a multibase substitution in the NF-κB site. Under these conditions, there was a mild activation of the positive control NF-κB site containing luciferase reporter.
Figure 8. NF-κB binds to the SREBP-1a promoter.
The DNA sequence for the region of the mouse SREBP-1a promoter is shown in the top panel, where the positions of the two critical Sp1 sites and the NF-κB site are noted. The sequences for the individual probes derived from this region and used in the EMSA studies are shown below the wild-type sequence. The multibase substitutions introduced in the putative NF-κB site are noted in lower-case. The third probe corresponds to a characterized NF-κB site in the mouse kappa light chain gene [19]. An autoradiogram from a typical EMSA is shown in the middle panel. TNF-α was added to HeLa cells at 100 ng/ml for the indicated times (hours) and nuclear extracts were prepared and used in the EMSA. Bottom panel: data from a transient DNA transfection, where the SREBP-1a wild-type or NF-κB mutant version were transfected alone or in the presence of expression vectors for NF-κB subunits p50 and p65 (10 ng each). The pNF-κB luciferase reporter plasmid was as described in [15].
DISCUSSION
Hepatic levels of SREBP-1a mRNA are very low compared with SREBP-1c. Indeed, SREBP-1a mRNA levels are low and at very similar levels in all the tissues examined and the changes in the ratio of 1a to 1c in different tissues is largely due to the level of 1c mRNA changes. Our studies demonstrate that SREBP-1a expression is controlled by a very simple promoter that controls the expression of its mRNA.
In the present study, we show that the promoter for mouse SREBP-1a is contained in a very small region of DNA that is proximal to the mRNA 5′-end. In this region, there are two binding sites for the transcription factor Sp1 that are key to promoter activity. Both sites are required for maximal promoter activity in transfection assays in mammalian cells. These two Sp1 sites reside in a region that is highly conserved with the human gene (Figure 4) and, consistent with our functional data, there is very little sequence conservation outside of the 5′-end proximal region. These results provide functional relevance for the usefulness of ‘phylogenetic footprinting’ that emphasizes the use of sequence comparisons across species to define important cis-acting DNA elements. This technique was first used in studies of the low-density lipoprotein receptor and globin regulatory regions [20,21] and has been continually refined and expanded as genome sequence information became available and computational methods were improved [22].
To evaluate directly the role of Sp1 in activating the SREBP-1a promoter, we turned to studies in the Drosophila SL2 cell line since there is no endogenous Sp1, but the expression of Sp1-responsive promoters can be stimulated by co-transfection of expression vectors that encode the Sp1 protein [16,23]. Using the SL2 cells, we showed that expression of the SREBP-1a promoter was stimulated by co-expression of Sp1 and the stimulation required the Sp1-binding sites. Additionally, we also showed that the Sp1 expressed in the SL2 cells bound to DNA probes containing the putative Sp1-binding sites from the SREBP-1a promoter. These studies indicate that the SREBP-1a promoter is small, simple and composed of two Sp1-binding sites. We also identified a putative response element for the NF-κB protein that was in close proximity to and potentially overlaps with one of the Sp1 sites (Figure 4). We did show that NF-κB binds to this site in vitro (Figure 8). However, mutations that specifically disrupted the NF-κB-binding site had no effect on SREBP-1a promoter activity (Figure 5) and co-transfection of cells with constructs that express subunits of NF-κB failed to stimulate SREBP-1a promoter activity (Figure 8).
Since SREBP-1c is the major SREBP-1 isoform expressed in the mammalian liver, most studies have focused on its role in hepatic metabolism. Importantly, in a mutant mouse model where the unique first exon of SREBP-1c was specifically knocked out, the robust lipogenic response to a fasting/refeeding regimen that occurs in normal animals is significantly decreased [10]. However, the fasting/refeeding-dependent regulation of SREBP-1a mRNA levels (Figure 2) appears to be normal in the SREBP-1c knockout animals. This result provides strong evidence that normal levels of SREBP-1c are necessary for the lipogenic response, but they also indicate that changes in SREBP-1a mRNA also occur during the fasting/refeeding cycle and they are independent of SREBP-1c. On the basis of these results and the other available data that implicate Sp1 in insulin signalling [13], it is probable that the changes in SREBP-1a levels are due to Sp1.
Acknowledgments
This work was partially supported by a grant from the NIH (HL48044). D.-J. S. was supported by a fellowship from the American Heart Association (0325131Y). We thank Dr C. Hughes for the NF-κB reporter and p50 and p65 expression constructs.
References
- 1.Horton J. D., Goldstein J. L., Brown M. S. SREBPs: activators of the complete program of cholesterol and fatty acid synthesis in the liver. J. Clin. Invest. 2002;109:1125–1131. doi: 10.1172/JCI15593. [DOI] [PMC free article] [PubMed] [Google Scholar]
- 2.Toth J. I., Datta S., Athanikar J. N., Freedman L. P., Osborne T. F. Selective co-activator interactions in gene activation by SREBP-1a and -1c. Mol. Cell. Biol. 2004;24:8288–8300. doi: 10.1128/MCB.24.18.8288-8300.2004. [DOI] [PMC free article] [PubMed] [Google Scholar]
- 3.Sato R., Yang J., Wang X., Evans M. J., Ho Y. K., Goldstein J. L., Brown M. S. Assignment of the membrane attachment, DNA binding, and transcriptional activation domains of sterol regulatory element-binding protein-1 (SREBP-1) J. Biol. Chem. 1994;209:17267–17273. [PubMed] [Google Scholar]
- 4.Nåår A. M., Beaurang P. A., Robinson K. M., Oliner J. D., Avizonis D., Scheek S., Zwicker J., Kadonaga J. T., Tjian R. Chromatin, TAFs and a novel multiprotein coactivator are required for synergistic activation by Sp1 and SREBP-1a in vitro. Genes Dev. 1998;12:3020–3031. doi: 10.1101/gad.12.19.3020. [DOI] [PMC free article] [PubMed] [Google Scholar]
- 5.Bennett M., Toth J. I., Osborne T. F. Selective association of sterol regulatory element binding protein isoforms with target promoters in vivo. J. Biol. Chem. 2004;279:37360–37367. doi: 10.1074/jbc.M404693200. [DOI] [PubMed] [Google Scholar]
- 6.Hasty A. H., Shimano H., Yahagi N., Amemiya-Kudo M., Perrey S., Yoshikawa T., Osuga J., Okazaki H., Tamura Y., Iizuka Y., et al. Sterol regulatory element-binding protein-1 is regulated by glucose at the transcriptional level. J. Biol. Chem. 2000;275:31069–31077. doi: 10.1074/jbc.M003335200. [DOI] [PubMed] [Google Scholar]
- 7.Amemiya-Kudo M., Shimano H., Yoshikawa T., Yahagi N., Hasty A. H., Okazaki H., Tamura Y., Shionoiri F., Iizuka Y., Ohashi K., et al. Promoter analysis of the mouse sterol regulatory element-binding protein-1c gene. J. Biol. Chem. 2000;275:31078–31085. doi: 10.1074/jbc.M005353200. [DOI] [PubMed] [Google Scholar]
- 8.Repa J. J., Liang G., Ou J., Bashmakov Y., Lobaccaro J. M., Shimomura I., Shan B., Brown M. S., Goldstein J. L., Mangelsdorf D. J. Regulation of mouse sterol regulatory element-binding protein-1c gene (SREBP-1c) by oxysterol receptors, LXRalpha and LXRbeta. Genes Dev. 2000;14:2819–2830. doi: 10.1101/gad.844900. [DOI] [PMC free article] [PubMed] [Google Scholar]
- 9.Shimomura I., Shimano H., Horton J. D., Goldstein J. L., Brown M. S. Differential expression of exons 1a and 1c in mRNAs for sterol regulatory element binding protein-1 in human and mouse organs and cultured cells. J. Clin. Invest. 1997;99:838–845. doi: 10.1172/JCI119247. [DOI] [PMC free article] [PubMed] [Google Scholar]
- 10.Liang G., Yang J., Horton J. D., Hammer R. E., Goldstein J. L., Brown M. S. Diminished hepatic response to fasting/refeeding and liver X receptor agonists in mice with selective deficiency of sterol regulatory element-binding protein-1c. J. Biol. Chem. 2002;277:9520–9528. doi: 10.1074/jbc.M111421200. [DOI] [PubMed] [Google Scholar]
- 11.Shin D.-J., Osborne T. F. Thyroid hormone regulation and cholesterol metabolism are connected through sterol regulatory element-binding protein-2 (SREBP-2) J. Biol. Chem. 2003;278:34114–34118. doi: 10.1074/jbc.M305417200. [DOI] [PubMed] [Google Scholar]
- 12.Sato R., Inoue J., Kawabe Y., Kodama T., Takano T., Maeda M. Sterol-dependent transcriptional regulation of sterol regulatory element-binding protein-2. J. Biol. Chem. 1996;271:26461–26464. doi: 10.1074/jbc.271.43.26461. [DOI] [PubMed] [Google Scholar]
- 13.Samson S. L., Wong N. C. Role of Sp1 in insulin regulation of gene expression. J. Mol. Endocrinol. 2002;29:265–279. doi: 10.1677/jme.0.0290265. [DOI] [PubMed] [Google Scholar]
- 14.Athanikar J. N., Sanchez H. B., Osborne T. F. Promoter selective transcriptional synergy mediated by SREBP and Sp1: a critical role for the Btd domain of Sp1. Mol. Cell. Biol. 1997;17:5193–5200. doi: 10.1128/mcb.17.9.5193. [DOI] [PMC free article] [PubMed] [Google Scholar]
- 15.Mestas J., Hughes C. C. Endothelial cell costimulation of T cell activation through CD58-CD2 interactions involves lipid raft aggregation. J. Immunol. 2001;167:4378–4385. doi: 10.4049/jimmunol.167.8.4378. [DOI] [PubMed] [Google Scholar]
- 16.Sanchez H. B., Yieh L., Osborne T. F. Cooperation by SREBP and Sp1 in sterol regulation of low density lipoprotein receptor gene. J. Biol. Chem. 1995;270:1161–1169. doi: 10.1074/jbc.270.3.1161. [DOI] [PubMed] [Google Scholar]
- 17.Sambrook J., Fritsch E. F., Maniatis T. Plainview, NY: Cold Spring Harbor Press; 1989. Molecular Cloning: A Laboratory Manual. [Google Scholar]
- 18.Yieh L., Sanchez H. B., Osborne T. F. Domains of transcription factor Sp1 required for synergistic activation with sterol regulatory element binding protein-1 of low density lipoprotein receptor promoter. Proc. Natl. Acad. Sci. U.S.A. 1995;92:6102–6106. doi: 10.1073/pnas.92.13.6102. [DOI] [PMC free article] [PubMed] [Google Scholar]
- 19.Baeuerle P., Baltimore D. Activation of DNA-binding activity in an apparently cytoplasmic precursor of the NF-κB transcription factor. Cell (Cambridge, Mass.) 1988;53:211–217. doi: 10.1016/0092-8674(88)90382-0. [DOI] [PubMed] [Google Scholar]
- 20.Mehta K. D., Brown M. S., Bilheimer D. W., Goldstein J. L. The low density lipoprotein receptor in Xenopus laevis. II. Feedback repression mediated by conserved sterol regulatory element. J. Biol. Chem. 1991;266:10415–10419. [PubMed] [Google Scholar]
- 21.Gumucio D. L., Heilstedt-Williamson H., Gray T. A., Tarle S. A., Shelton D. A., Tagle D. A., Slightom J. L., Goodman M., Collins F. S. Phylogenetic footprinting reveals a nuclear protein which binds to silencer sequences in the human gamma and epsilon globin genes. Mol. Cell. Biol. 1992;12:4919–4929. doi: 10.1128/mcb.12.11.4919. [DOI] [PMC free article] [PubMed] [Google Scholar]
- 22.Sandelin A., Wasserman W. W., Lenhard B. ConSite: web-based prediction of regulatory elements using cross-species comparison. Nucleic Acids Res. 2004;32:W249–W252. doi: 10.1093/nar/gkh372. [DOI] [PMC free article] [PubMed] [Google Scholar]
- 23.Courey A. J., Tjian R. Analysis of Sp1 in vivo reveals multiple transcriptional domains, including a novel glutamine-rich activation motif. Cell (Cambridge, Mass.) 1988;55:887–898. doi: 10.1016/0092-8674(88)90144-4. [DOI] [PubMed] [Google Scholar]


