

Abstract
BACKGROUND
In Brugada syndrome (BrS), phase 2 re-excitation/re-entry (P2R) induced by the transient outward potassium current (Ito) is a proposed arrhythmia mechanism; yet, the most common genetic defects are loss-of-function sodium channel mutations.
OBJECTIVES
The authors used computer simulations to investigate how sodium channel dysfunction affects P2R-mediated arrhythmogenesis in the presence and absence of Ito.
METHODS
Computer simulations were carried out in 1-dimensional cables and 2-dimensional tissue using guinea pig and human ventricular action potential models.
RESULTS
In the presence of Ito sufficient to generate robust P2R, reducing sodium current (INa) peak amplitude alone only slightly potentiated P2R. When INa inactivation kinetics were also altered to simulate reported effects of BrS mutations and sodium channel blockers, however, P2R occurred even in the absence of Ito. These effects could be potentiated by delaying L-type calcium channel activation or increasing ATP-sensitive potassium current, consistent with experimental and clinical findings. INa-mediated P2R also accounted for sex-related, day and night–related, and fever-related differences in arrhythmia risk in BrS patients.
CONCLUSIONS
Altered INa kinetics synergize powerfully with reduced INa amplitude to promote P2R-induced arrhyth-mias in BrS in the absence of Ito, establishing a robust mechanistic link between altered INa kinetics and the P2R-mediated arrhythmia mechanism. (J Am Coll Cardiol EP 2023;9:2459–2474) © 2023 by the American College of Cardiology Foundation.
Keywords: Brugada syndrome, phase 2 re-entry, sodium channel blocker, sodium channel mutation
Brugada syndrome (BrS) is an inherited cardio-vascular disease with a high risk of sudden death resulting from ventricular arrhythmias.1–3 Two main mechanisms of arrhythmogenesis have been proposed, whose relative contributions are still hotly debated.4–8 The depolarization hypothesis posits that a localized cardiomyopathic process creating fibrosis in the right ventricular outflow tract (RVOT) region causes conduction slowing, predisposing the heart to unidirectional conduction block initiating re-entry. This mechanism is supported by clinical observations that catheter ablation of the putative fibrotic regions is often an effective therapy. The alternative repolarization hypothesis posits that the ventricles are typically structurally normal in BrS and arrhythmias are triggered by phase 2 re-excitation/re-entry (P2R) arising from regions of the RVOT epicardium exhibiting a prominent spike-and-dome action potential (AP) morphology. The spike-and-dome AP morphology is normally caused by the presence of the transient outward potassium (K) current (Ito)9–11 or other Ito-like currents.12 Monophasic AP recordings have documented the relevant spike-and-dome AP morphology in the epicardial RVOT in BrS patients, where Ito density is known to be highest (Figure 1A)1,13 and the characteristic electrocardiographic ST segment changes of BrS are typically manifested. However, P2R has been conclusively demonstrated only in canine hearts14–19 and computer models.20–27 In computer simulations,20–27 a large Ito is required for the genesis of P2R, which may explain why the canine ventricle, which has a higher Ito density compared to most large mammals (see Nguyen et al28), including humans, is more susceptible.
FIGURE 1.

Brugada Syndrome and Ito-Mediated P2R
(A) ECG showing J-point elevation with corresponding monophasic AP recordings from the epicardial and endocardial RVOT in a BrS patient.1
(B) Phase diagram showing conduction behaviors in a heterogeneous 1-dimensional cable of the LRd model.27 Solid region = P2R. Gray region = conduction with a spike-and-dome AP (left side of P2R), or a spike AP (right side of P2R). White region = conduction failure. (C) Examples of conduction patterns from different regions marked by the symbols in B, where mS/cm2 and mS/cm2 (square), 1.7 mS/cm2 (triangle), and 1.9 mS/cm2 (diamond), respectively. The symbol “*” indicates P2R conduction. The cable was heterogeneous, in which the parameters in the first 50 cells were kept at control values and the maximal conductances of INa and Ito ( and , respectively) were varied in the remaining 250 cells to obtain the phase diagram in B. P2R = phase 2 re-excitation.
By contrast, genetic analysis has revealed that loss-of-function sodium (Na) channel mutations are the most common cause of inherited BrS.2,8 Moreover, Na channel blocking drugs are used diagnostically to unmask the characteristic electrocardiographic features of BrS. Regarding the 2 proposed BrS arrhythmogenic mechanisms, a wealth of clinical, experimental, and computational studies have shown how Na channel dysfunction can promote the initiation of re-entry in fibrotic tissue by exacerbating slow conduction and unidirectional block,29–35 consistent with the depolarization hypothesis. In the P2R mechanism, however, Na channel dysfunction has been thought to play only an indirect role, serving to unmask the ability of Ito (or Ito-like currents) to cause the regional early repolarization of the cardiac AP that underlies P2R.22,23,26,27 This effect is illustrated in the computer simulations in Figure 1B, which plots how the occurrence of P2R (solid region) depends on the maximum conductances of Ito versus INa . Note that P2R occurs only at large values exceeding 1.2 mS/ cm2 and is initially promoted by lowering to just above the point at which propagation fails completely (region 1 in Figure 1B). For values of (region 2 in Figure 1B), however, reducing never induces P2R.
By contrast, it is well known that both loss-of-function INa mutations in BrS and Na channel blocking drugs do more than just reduce peak INa amplitude. They also alter Na channel kinetics by shifting steady-state activation and inactivation curves and altering inactivation and recovery time constants26,36–50 (Table 1). The goal of this computational study was to explore whether such kinetic alterations, in combination with reduced INa peak amplitude, can account for the clinically observed robust effects of Na channel mutations at causing BrS as well as Na channel blockers unmasking its features, including P2R-mediated life-threatening arrhythmias. To study this issue, we first explored whether altering Na channel kinetics and amplitude together could generate a spike-and-dome AP morphology and induce P2R in cardiac tissue containing no Ito or Ito-like currents (Central Illustration). Interactions with the L-type calcium (Ca) channel and ATP-sensitive K channel were also characterized. Finally, we investigated the implications for the sex differences, day-night differences, and fever on arrhythmia risk in BrS.
TABLE 1.
Changes of Na Channels Kinetics Caused by BrS Mutations or Na Channel Blockers Observed in Patch Clamp Experiments
| (mV) |
(ms) (M/WT) |
(mV) () |
(ms) (M/WT) |
(ms) (M/WT) |
First Author | |
|---|---|---|---|---|---|---|
| F2004L (23 °C) | 3.3 | 0.75/0.66 | −7.5 | 12.9/24.6 | 3.17/2.2 | Bébarová et al26 |
| Thr1620Met (22 °C) | 4.9 | −0.4 | 0.42/0.42 | 17.4/23.1 | Dumaine et al36 | |
| Thr1620Met (32 °C) | 10.7 | 1.1 | 0.21/0.38 | 4.8/1.1(f); 48/3.7(s) | Dumaine et al36 | |
| R1512W (10 °C) | −2.7 | 1.35/1.33 | −2.4 | 12.24/13.03 | Rook et al37 | |
| R1512W (22 °C) | −5.1 | −3.6 | 1.30/1.12(f); 7.74/9.61(s) | Rook et al37 | ||
| A1924T (10 °C) | −7.5 | 1.29/1.33 | −4.4 | 13.08/13.03 | Rook et al37 | |
| A1924T (22 °C) | −9.0 | −0.2 | 1.12/1.12(f); 7.77/9.61(s) | Rook et al37 | ||
| C1850S (37 °C) | 1.4 | −11.6 | 0.3/0.95 | No change | Petitprez et al38 | |
| L10P (20–22 °C) | 0.44 | −9.59 | 6.21/3.12(f); 25.18/10.30(s) | Hu et al40 | ||
| R1269Q (22–25 °C) | 2.3 | −20.6 | 1.18/2.32 | 22.5/3.2(f); 139/104(s) | Zeng et al41 | |
| R811H (20–22 °C) | −0.6 | −8.4 | 5.44/2.65 | Calloe et al42 | ||
| L1786Q (37 °C) | 15.2 | −21.3 | Kanters et al43 | |||
| 795insD (21 °C) | 8.1 | −7.3 | 1.15/0.98(f); 10.49/7.1(s) | 14.7/12.2 | Bezzina et al44 | |
| R1232W (22 °C) | −1.3 | −5.7 | 10/9.9 | Baroudi et al45 | ||
| T1620M (22 °C) | −2.5 | −8.5 | 16.8/9.9 | Baroudi et al45 | ||
| Y1795H (22 °C) | 0.9 | −10.5 | 1.1/2.9 | No change | Rivolta46 | |
| Flecainide (22 °C) | −11.1 | Liu et al47 | ||||
| Lidocaine (WT) | −6.6 | 7/3(f); 30/10(s) | Barajas-Martínez et al48 | |||
| Lidocaine (V232I) | −10.3 | 12/4(f); 33/11(s) | Barajas-Martínez et al48 | |||
| Lidocaine (L1308F) | −8.0 | 10/4(f); 30/11(s) | Barajas-Martínez et al48 | |||
| Lidocaine (V232I+L1308F) | −18.8 | 22/5(f); 117/13(s) | Barajas-Martínez et al48 | |||
| Ajmaline (20–22 °C) | −12.9 | −13.5 | Friedrich et al50 |
is midpoint voltage shift in activation or inactivation caused by a mutant (or drug) relative to the control value . is the time constant of activation , inactivation , or recovery . The values are for a certain holding potential for a mutation and wild type (presented as M/WT). “f” and “s” indicate the fast and slow components when data were fitted with double exponential functions.
CENTRAL ILLUSTRATION.

Sodium Channel Mutations or Blockers Result in Spike-and-Dome Action Potential Morphology and Phase 2 Re-Entry.
METHODS
No institutional review board approval was necessary because only computer simulations were performed.
COMPUTER MODELS.
We used 2 AP models: the 2004 Ten Tusscher et al51 (TP04) human ventricular AP model and the 1994 Luo and Rudy52 (LRd) guinea pig ventricular AP model. For most of the simulations of this study, Ito was removed from the AP models. For the simulations with Ito, Ito was modeled using the formulation by Dumaine et al.36
Using these AP models, we simulated both 1-dimensional (1D) cable and 2-dimensional (2D) tissue. Inasmuch as re-entry is not possible in a linear 1D cable, we used the term P2R to mean phase 2 re-excitation without re-entry. For 2D tissue, we used P2R in its conventional sense to mean phase 2 re-excitation initiating re-entry.
The governing equation for voltage in a cable is:
| (equation 1) |
where is the membrane capacitance, is the total ionic current density, and is the stimulation current density (a 2-ms pulse of −50 mA/cm2). D is the diffusion constant describing the strength of gap junction coupling, which was set as 0.001 cm2/ms. In this study, we used a homogeneous 1D cable (except Figure 1) with the stimulus applied at one end. A single stimulus was used for all 1D cable simulations except when the effects of different Na channel recovery kinetics were characterized using multiple stimuli.
For 2D tissue, the governing equation for voltage is:
| (equation 2) |
2D tissue was heterogeneous incorporating spatial gradients in INa properties, as described more fully in the corresponding figure legend.
ALTERING ION CHANNEL PROPERTIES AND CONDUCTANCE.
Besides the reduction of INa amplitude, experimental studies have shown that Na channel mutations or blockers cause alterations in Na channel kinetics.26,36–45,47–50 To simulate these effects, we shifted steady-state activation and inactivation , and altered the time constants , , and by multiplying them by a scaling factor. was removed from the AP models for all simulations except the ones shown in Figures 1 and 2E. was added to the AP models using the formulation as used previously27 to investigate the effects of on INa -mediated P2R.
FIGURE 2.

INa-Mediated P2R (When ) and Comparison of Spike-and-Dome AP Morphology With Ito-Mediated P2R
In all simulations, a single stimulus was given a at the top end of the cable. (A) Time-space plot of voltage during normal conduction. The parameters are the same as in the original model except that mS/cm2 and . We also added IKATP to the model with mS/cm2. (B) Time-space plot of voltage during P2R (marked by *) when the Na channel properties are altered from A as follows: mS/cm2, shifted −10 mV, shifted −8 mV, and is 0.5-fold of the original value. Note that the changes in Na channel kinetics are similar to the changes caused by SCN5A mutations R1215W and A1924T shown by Rook et al.37 (C) Another example of P2R in which the INa-mediated spike fails to propagate beyond the middle of the cable, for the same parameters as in B but with mS/cm2. (D) Another example for a different parameter set in which multiple INa-mediated P2R episodes occur. mS/cm2, mS/cm2, shifted −10 mV, shifted 0 mV, and 5-fold and 0.13-fold of the original values. (E) Ito-mediated spike-and-dome AP morphology (above), INa (middle), and ICa,L (below) versus time for (solid trace), mS/cm2 (red trace), and mS/cm2 (green trace). (F) Same format for INa-mediated spike-and-dome AP morphology (). The solid traces are the same as the control case as in E. The parameters are the same as for B except for mS/cm2 (red trace) or 2.97 mS/cm2 (green trace). In E and F, data were recorded from the middle of the cable. For viewing purposes, there is a 10-ms shift between the traces. AP = action potential; P2R = phase 2 re-excitation.
In some simulations, we also modified L-type Ca channel (LCC) properties by shifting steady-state activation and inactivation parameters by the same amount to avoid changing the window ICa,L, which has a large impact on APD and the generation of EAD.53
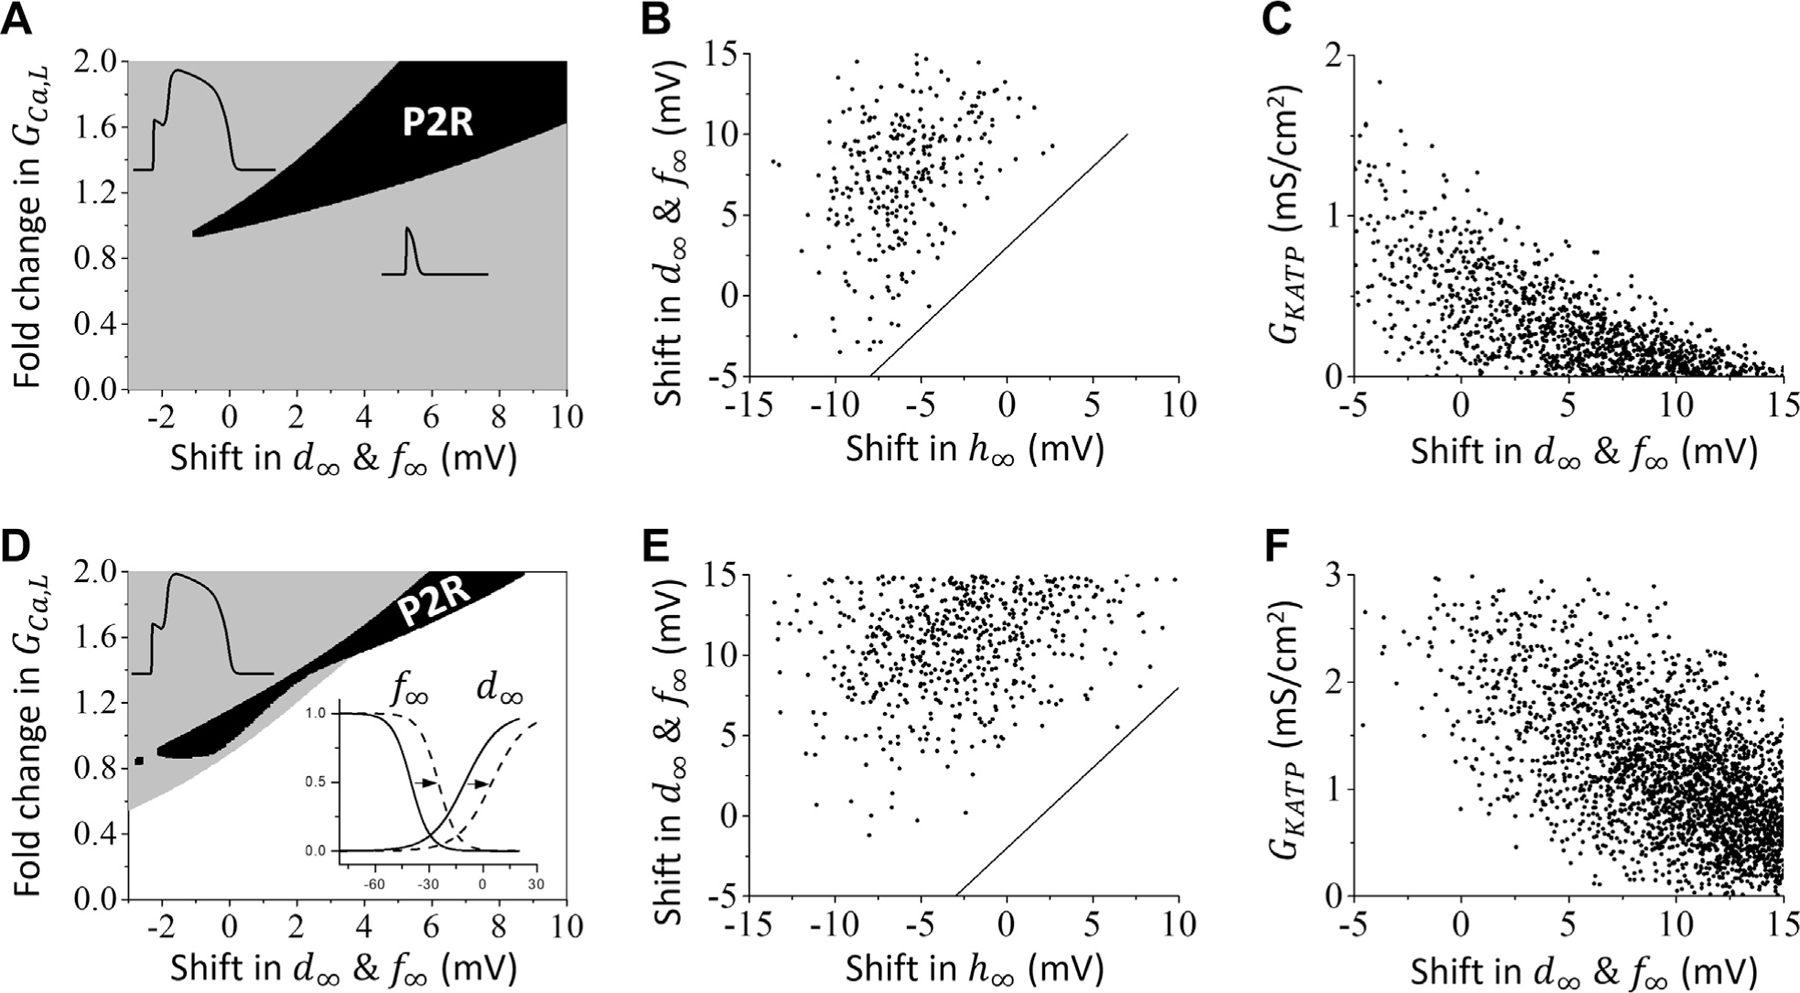
To account for individual variability as well as the robustness of the P2R mechanism, we also used random parameter sampling to detect P2R. For this purpose, a total of 15 parameters (including , , , , , , , , , , , , , and ) were sampled uniformly from preas-signed intervals. The ranges of parameters for the Na channel kinetics (, , , , and ) were largely based on changes caused by Na channel mutations and blockers shown in experiments26,36–50 (Table 1). The ranges of other parameters were mostly 1- or 2-fold of the values of the original model. The preassigned intervals are detailed in the Supplemental Methods. For the TP04 model, we randomly drew 12,000,000 parameter sets and carried out the 1D cable simulations using Eq.1, which resulted in 1,273 parameter sets (~1 out of 10,000) exhibiting P2R. For the LRd model, we randomly drew 600,000 parameter sets, which resulted in 1,701 parameter sets (~28 out of 10,000) exhibiting P2R.
NUMERICAL METHODS.
Computer simulations were carried out using a forward Euler method for Equations 1 and 2 with and . Other differential equations were solved as in the original codes of the LRd and TP04 models. Graphic processing unit computation with CUDA programming was used for simulations. In this study, the vast majority of the simulations were carried out in 1D cables with a cable length of 4.5 cm equivalent to 300 computational cells.
RESULTS
P2R CAUSED BY ALTERING NA CHANNEL PROPERTIES IN THE ABSENCE OF ITO.
To investigate whether altered Na channels properties alone could generate P2R, we removed Ito completely from the AP model. Figure 2A shows the conduction pattern in a 1D cable when Ito was removed from the TP04 human ventricular AP model51 and Na channel properties were normal. The AP did not exhibit a spike-and-dome pattern, and conduction was normal. However, when INa features were altered to mimic quantitatively the reported effects of BrS Na channel mutations and Na channel blocking drugs on INa kinetics as well as amplitude,26,36–42,48 certain combinations induced both spike-and-dome AP morphology and P2R, as illustrated in the example in Figure 2B. Figure 2C shows another example of a P2R-induced PVC that propagated throughout the cable even as the paced AP upstroke developed conduction block at the cable’s lower end. Figure 2D shows an example in which multiple spontaneous P2R-induced PVCs occurred at intervals of <100 ms. Note that the 1D cable in Figures 2A to 2D was homogeneous, but comparable P2R dynamics were also observed in a heterogeneous 1D cable with the same alterations of the Na channel properties (Supplemental Figure 1).
The appearance of the spike-and-dome AP morphology in these cases differed from that caused by Ito, and are compared in Figures 2E and 2F. Detailed analysis revealed that the spike-and-dome AP morphology is caused by reactivation of ICa,L in the Ito-mediated mechanism, but delayed activation of ICa,L in the INa-mediated mechanism. In the former case (Figure 2E), there was almost no change in INa during the transition from the spike-and-dome to spike-only morphology, but ICa,L exhibited large changes. For the spike-and-dome morphology (red trace), the peak ICa,L was much larger than that of control AP without Ito (solid trace) and was further reactivated during the dome. During the spike-only morphology (green trace), the peak ICa,L was even larger, but no reactivation occurred. By contrast, in the INa-mediated case (Figure 2F), INa was greatly reduced (red trace) compared with the control AP (solid trace) in such a manner that the spike amplitude was markedly attenuated, reaching only −30 mV or so at its peak. ICa,L, on the other hand, was roughly the same as in the control AP, but its activation was delayed. With transition to the spike-only morphology (green trace), INa was further reduced, and ICa,L was hardly activated at all. Thus, in the Ito-mediated case, the cell first depolarizes to a positive voltage as a result of INa activation, which then activates ICa,L and Ito. The activation of Ito brings the voltage back down to −30 mV, at which point ICa,L starts to reactivate. In the INa-mediated P2R case, however, the cell only depolarizes to around −30 mV during the spike as a result of early inactivation of INa, which delays the ICa,L activation that then generates the dome. Note that the INa-mediated spike-and-dome AP morphology (Figure 2F) is more similar to the recording from BrS patient (Figure 1A) than Ito-mediated spike-and-dome AP morphology (Figure 2E).
To quantify which Na channel parameter combinations resulted in P2R, we systematically scanned the relevant Na channel parameters over a wide range of values and constructed phase diagrams, in which the parameter regions corresponding to conduction without P2R, conduction with P2R, and conduction failure along the 1D cable were color-coded gray, solid, and white, respectively (Figures 3A to 3D). Figure 3A shows the phase diagram when (controlling steady-state inactivation) and (controlling INa peak amplitude) were varied, with other parameters held the same as in Figure 2B. When was reduced to limit the peak voltage obtained during the spike, P2R occurred only when was shifted to more negative voltages, which speeds Na channel inactivation [controlled by , where ]. As predicted by this equation, the same effect could be achieved by shortening the time constant of inactivation to speed up Na channel inactivation. This is illustrated in the phase diagram in Figure 3B, where and were varied, with other parameters held constant. In this case, P2R required no reduction of at all if inactivation was fast enough. Figures 3C and 3D show the effects of voltage-shifting the steady-state activation curve and altering the activation time constant . Shifting to more negative voltages promoted P2R, whereas increasing to slow activation slightly promoted and then suppressed P2R.
FIGURE 3.

Effects of Na Channel Properties on P2R Formation in a 1-Dimensional Cable (TP04 Model)
(A) Phase diagram showing conduction behaviors when the voltage shift in and were varied while all other parameters were kept the same as in Figure 2B. The solid region indicates P2R, the gray region is conduction without P2R (including conduction with spike-and-dome AP or spike AP as indicated in B), and the white region is conduction failure. (B) The analogous phase diagram showing conduction behaviors when the parameters and were varied. (C) The analogous phase diagram showing conduction behaviors when the voltage shift in and were varied. (D) The analogous phase diagram showing conduction behaviors when the parameters and were varied. (E) For parameter sets exhibiting P2R, the value of the parameter is plotted against the voltage shift of the parameter . The straight line is a linear regression of the data set. (F) Same as E, but plotting the voltage shift in against the voltage shift in . The equation of the straight line is: . (G) Same as E, but plotting against the voltage shift in . (H) Phase diagram showing conduction behaviors when the parameters and were varied. In the original TP04 model, for is −56.86 mV and for is −71.55 mV. AP = action potential; P2R = phase 2 re-excitation.
To explore further how these Na channel parameters interacted with other ionic currents in the model to influence the occurrence of P2R, we also performed simulations using parameter sets randomly drawn from preassigned intervals for 15 parameters related to Na channels as well as L-type Ca and K channels (see Methods and Supplemental Methods for details). The preassigned intervals for each parameter were chosen to mimic the natural variability observed in a genetically diverse population.54 Most of these parameter sets did not exhibit P2R when simulated in a 1D cable (see Methods for the total number of parameter sets drawn and the percentage exhibiting P2R), but in the subset that did give rise to P2R, we plotted the data points in various parameter pairs to look for relationships between them. Figure 3E plots the data points in pairs of the time constant of inactivation and the steady-state inactivation parameter , and it illustrates that the values giving rise to P2R are negatively correlated with the shift in (or of ). In other words, to promote P2R, a larger shift of to more negative voltages is needed to compensate for a smaller reduction in . Note that P2R events increase quickly with a reduction of (ie, data points become denser at smaller ), indicating that speeding up inactivation promotes P2R more efficiently, in agreement with the phase diagram in Figure 3B. Similarly, Figure 3F plots the same data points in pairs of the steady-state activation parameter and the steady-state inactivation parameter , illustrating that the majority of the P2R episodes occur at more negatively voltage-shifted values, and no P2R occurs if (corresponding to the area below the line shown in Figure 3F). Figure 3G plots the same data points in pairs of the steady-state activation parameter and the time constant of inactivation parameter , revealing that a more negative shift in is required to compensate for a larger (slower inactivation). We did not observe any meaningful relationships between and either or .
In the AP model, Na channel recovery kinetics are mainly controlled by the time constant of the -gate . In Figure 3H, the phase diagram of against shows that the occurrence of P2R is insensitive to . We also did not observe any meaningful relationship between and other Na channel properties. However, Na channel recovery did affect the onset of the heart rate at which P2R occurs. This is illustrated in Figure 4, showing time-space plots of voltage for 3 different pacing cycle lengths when was set at its control value (Figure 4A) or doubled (Figure 4B). In both cases, P2R occurs as pacing rate increases, but it occurs sooner when recovery from inactivation is slower (ie, larger in Figure 4B).
FIGURE 4.

Effects of INa Recovery From Inactivation on P2R
(A) Normal INa recovery kinetics using the control value of parameter . (B) Slowed INa recovery kinetics using twice the control value of . For all simulations, mS/cm2, is 1.1-fold of the original value, and other parameters are the same as in Figure 2B. The simulations were started with the same initial conditions, and the first beats in all cases are identical. The pacing cycle lengths are marked on each part of the figure. The onset of P2R occurs at a longer pacing cycle length when INa recovery from inactivation is slower. P2R = phase 2 re-excitation.
Equivalent 1D cable simulations were performed using the LRd model52 in place of the TP04 model (Supplemental Figures 2 and 3). The results are almost identical, indicating that the results are generic rather than model specific.
As mentioned earlier, given that re-entry cannot occur in a linear 1D cable, we define P2R in this setting as phase 2 re-excitation without re-entry, as opposed to phase 2 re-excitation with re-entry that becomes possible only in 2D or 3-dimensional tissue. To confirm that such phase 2 re-excitation with re-entry is possible for INa-mediated P2R, we also carried out 2D tissue simulations using the human TP04 ventricular AP model. Figure 5 shows voltage snapshots and a space-time plot of voltage from the vertical center line of the 2D tissue. After a single stimulus, spontaneous P2R-induced PVCs emerged as a result of heterogeneous repolarization gradients, which subsequently succeeded in initiating bona fide reentry (Video 1). The re-entry occurred spontaneously via the R-from-T mechanism as reviewed previously.55
FIGURE 5.

Re-Entry Initiation in INa-Mediated P2R in 2D Tissue
(A) Voltage snapshots showing spontaneous formation of re-entry (Video 1). Arrows indicate the propagating wavefront directions, and * indicates the origin of a spontaneous PVC (with the first one occurring at around 200 ms). Spiral wave re-entry first forms around 500 ms, and new ones repeatedly form via the same process. The dashed lines in the first part mark the boundary for normal (upper and right) and altered (lower and left) Na channel properties. (B) Time-space plot of voltage from the vertical line through the center of the 2D tissue. The 2D tissue is isotropic tissue with the tissue size of 9.6 × 9.6 cm2 (= 640 × 640 cells). The parameters in the right and top regions (x >8.85 cm or y>8.85 cm, marked by the dashed lines) are the same as normal control (the same as for Figure 2A). In the lower left region (x <8.85 cm and y <8.85 cm), the parameters are the same as in Figure 2D except that the fold change in is nonuniform in this region (ie, the fold change in is 0.05+0.08y/8.85). A single pacing stimulus was given to the upper border of the tissue at ms as marked on B. 2D = 2-dimensional; P2R = phase 2 re-excitation.
P2R FACILITATION BY ALTERED LCC AND ATP-SENSITIVE K CHANNEL PROPERTIES.
As shown in Figure 2F, the key feature of the spike-and-dome AP morphology generating INa-mediated P2R is the small spike in which the cell depolarizes only to around −30 mV so as to delay ICa,L activation sufficiently to generate the dome. Thus, other factors that delay ICa,L activation might also be predicted to synergize with altered Na channel kinetics in promoting P2R. Two candidate factors include altered LCC kinetic parameters that directly slow ICa,L activation, and activation of IKATP to assist in preventing the initial spike voltage from depolarizing beyond the −30-mV range. This might in part account for experimental observations in the canine ventricular epicardial preparations that Ca channel blockers and ATP-sensitive K channel agonists facilitated P2R under appropriate conditions.56–58 In addition, this hypothesis may be relevant to genetic analysis of BrS in which both loss-of-function Ca channel-related mutations and gain-of-function ATP-sensitive K channel–related mutations have been identified as causing BrS, although not as commonly as Na channel mutations.2 Activation of ATP-sensitive K channels has also been implicated in initiation of ventricular arrhythmias by P2R during acute myocardial ischemia.15 Accordingly, we used analogous computational approaches to explore whether altered LCC features and/or ATP-sensitive K channel activation, in combination with altered Na channel features, could facilitate P2R in the absence of Ito.
Facilitation of INa-mediated P2R by altered LCC properties.
Figure 6A shows the phase diagram in which the steady-state activation and inactivation curves were jointly voltage-shifted along the horizonal axis and the parameter controlling ICa,L peak amplitude was varied along the vertical axis, with other parameters held the same as in Figure 2B (to generate INa-mediated P2R). P2R occurred over a range (solid region) of values, which increased as and were shifted to more positive voltages. The minimum GCa,L required for P2R also increased. To look for a relationship between Na channel kinetics and LCC kinetics required to generate P2R, we plotted the same random parameter sets generating P2R analyzed in Figures 3E to 3G in the same paired manner, and found no meaningful relationships. However, if we plotted only the random parameter sets in which the Na channel inactivation time constant was >0.5-fold of the control value (Figure 6B), we found that P2R did not occur if the gap between steady-state Na channel inactivation and LCC activation was too small; ie, no P2R occurred if (the area below the line in Figure 6B). For example, if there was no shift in , one needed to shift and at least 3 mV in a positive direction to generate P2R, provided other parameters were properly chosen. However, if Na channel inactivation was sufficiently fast, this relationship is not required. When Na channel inactivation is too slow, however, a sufficient gap between the steady-state Na channel inactivation and altered LCC activation can promote P2R.
FIGURE 6.
Effects of L-Type Ca Channel Properties on INa-Mediated P2R
(A) Phase plot of conduction behaviors when the voltage shift in & and the parameter are varied while all other parameters are kept the same as in Figure 2B. The solid region indicates P2R; the gray region indicates conduction without P2R (including conduction with normal AP, spike-and-dome AP, or spike AP); the white region indicates conduction failure. (B) For the same parameter sets giving rise to P2R as in Figures 3E to 3G (excluding those with -fold of the original value), the plot shows the relationship between the voltage shifts in and & . The equation of the straight line is: . (C) Same as B, but showing the relationship between the voltage shift in & and . (D to F) Same as A to C but using the LRd model in place of the TP04 model. The equation of the straight line in E is: . P2R = phase 2 re-excitation.
Facilitation of INa-mediated P2R by ATP-sensitive K channel activation.
Figure 6C shows the phase diagram when the voltage shift in and controlling steady-state activation and inactivation were varied along the horizontal axis and controlling ATP-sensitive K current amplitude was varied along the vertical axis, with other parameters held the same as in Figure 2B. The negative correlation indicates that a smaller voltage shift in and is required for P2R as increases. That is, increasing can enable a lesser positive voltage shift of ICa,L steady-state activation/inactivation parameters to induce P2R.
Figures 6D to 6F show that similar results were obtained using the LRd model in place of the TP04 model. The GCa,L range for P2R in the LRd model is narrower than that for the TP04 model, and conduction failure occurs if GCa,L is not sufficiently large (Figure 6D). Similar to the TP04 model, when we plotted the random parameter set (same as the one in Supplemental Figures 3E to 3G) giving rise to P2R, we found no meaningful relationship between Na channel kinetics and LCC kinetics. However, when exceeded 0.5-fold of the control value (Figure 6E), a minimum gap between Na channel inactivation and LCC activation was required for P2R. Unlike the TP04 human ventricular AP model, however, P2R could not be induced in the LRd model by altering the Na channel properties alone in the absence of IKATP. A minimum of +10 mV shift in and in the LCC properties was also required if IKATP was absent, as seen in Figure 6F. With a large enough IKATP, however, P2R could be induced in the LRd model by altering Na channel properties without altering LCC kinetics (Figure 6F). If IKATP became too large, however, P2R was suppressed.
EFFECTS OF SEX DIFFERENCE AND CIRCADIAN RHYTHM ON INa-MEDIATED P2R.
The majority of BrS patients are male,59 and arrhythmia risk increases after midnight60,61 and during febrile illnesses.62–64 It has been shown that current densities differ in male and female hearts and exhibit different responses to sex hormones.65,66 The sympathetic activity differs in daytime from that in nighttime, and certain ionic currents are directly regulated by circadian rhythm.67,68 To investigate their effects on INa-mediated P2R, we carried out 1D cable simulations incorporating sex differences in ionic currents. We set the female-to-male ratios of the maximum conductances of the ionic currents based on previous studies65,66 (see Table S1 in our previous study27). More specifically, in a female individual, ICa,L conductance is 50% higher, K current conductances are 15% to 25% lower, and gap junction coupling is 35% weaker. Ito was removed from the model, and thus there is no difference in Ito.
Figure 7 shows the P2R regions in phase diagrams for female (red) and male (blue) individuals. The control parameters for male individuals are the same as in Figure 2B in such a manner that P2R occurs at the baseline (1.0-fold of GCa,L). Figure 7A is the phase diagram showing the P2R regions versus GCa,L and GNa. For both female and male, P2R occurs over a small range of GNa and GCa,L. Figure 7B shows the P2R regions versus GCa,L and GKs. In this case, the P2R regions are almost vertical bars, indicating that changing GKs exhibits little effect on P2R. Figure 7C shows the P2R regions versus GCa,L and GKr, which indicates that changing GKr also exhibits little effect on P2R. Unlike GKs and GKr, changing GKATP exhibits a large effect on P2R (Figure 7D), agreeing with the results in Figures 6C and 6F. In all 4 cases, a larger-fold reduction of ICa,L (or a higher-fold increase in IKATP) is required for female than for male individuals to become susceptible to P2R. This difference in susceptibility is mainly caused by the difference in ICa,L (because changing GKs or GKr exhibits little effect, the difference in these K current conductances does not contribute to the difference in susceptibility), ie, female individuals are less susceptible to P2R because of a larger baseline ICa,L. In the daytime, the sympathetic tone is normal or high, both ICa,L and IKs are a couple of folds higher (eg, 2.0-fold in GCa,L and 3.0-fold in GKs).69 At night, when sympathetic tone is low, ICa,L and IKs are lower. Furthermore, ICa,L conductance is also reduced at night because of circadian rhythm.67,68 Therefore, the susceptibility to P2R is much higher at night when ICa,L reaches its nadir as a result of both circadian effects and low sympathetic tone, in agreement with the clinical observations. These findings are similar to those we reported in a previous study27 using similar protocols, which showed that P2R induced by Ito also follows the same sex differences and day-night differences observed in BrS.
FIGURE 7.

Sex Differences and Day-Night Effects on INa-Mediated P2R
Phase plots of P2R regions (blue = male; red = female). The horizontal axis represents the fold-change in (with 1.0-fold corresponding to the different male and female baseline values), and the vertical axis represents the value of the parameters: (A) . (B) . (C) . (D) . All other parameters were held constant at their sex-specific values. Note that in comparison with to female individuals, a lesser-fold reduction in is required to elicit P2R in male individuals, consistent with their increased susceptibility to P2R, especially at night, when is typically at its nadir owing to circadian factors and low sympathetic tone. P2R = phase 2 re-excitation.
DISCUSSION
In this study, we carried out computer simulations using human ventricular and guinea pig ventricular AP models to investigate P2R in the absence of Ito. We demonstrated that P2R can occur in the absence of Ito when Na channel kinetic properties are altered alone or in combination with altered LCC kinetics and ATP-sensitive K channel activation. The key to the genesis of P2R is the formation of a spike-and-dome AP morphology and its transition to a spike-only morphology caused by early repolarization that suddenly truncates the AP duration. In both the Ito-mediated and INa-mediated mechanisms, the critical aspect is to hold the voltage of the notch separating the spike and the dome in the −30-mV range for a sufficient time to allow ICa,L to reactivate (in Ito-mediated P2R) or activate initially (in INa-mediated P2R) to generate an AP dome. The ICa,L-mediated dome can then re-excite adjacent already repolarized spike-only regions, thereby creating a PVC capable (in 2- or 3-dimensional tissue) of initiating re-entry (Figure 5). In the Ito case, both INa and ICa are activated during the initial spike, and Ito activation serves the role of bringing the voltage back down to the −30 mV range, allowing ICa,L to reactivate during the notch (Figure 2E). In the INa-mediated case, the combination of reduced peak amplitude and rapid inactivation of INa caused by altered kinetics prevents the initial spike from increasing much beyond −30 mV in the first place. If the voltage of the notch is negative enough and long enough to delay but not suppress ICa,L activation, the delayed ICa,L activation then generates the dome (Figure 2F).
In both cases, P2R requires a delicate balance between inward and outward currents, in such a manner that the transition from a spike-and-dome to spike-only AP morphology occurs over a very narrow range. This transition is critical for P2R, and too small or too large an ICa,L, Ito, or IKATP conductance can suppress P2R by either the Ito- or the INa-mediated mechanism. The necessary features are facilitated by early and fast inactivation of INa, a shift of the ICa,L activation to more positive voltages, and/or activation of IKATP. In addition, ICa,L peak amplitude must be sufficiently large to support propagation. As shown in our previous studies,24,70 a PVC arising from P2R is a result of a tissue-scale instability, requiring a strong enough ICa,L to facilitate the formation and propagation of the PVC, yet small enough to permit the transition from spike-and-dome to spike morphology. Thus, P2R can occur only over a restricted range of ICa,L amplitude for both INa-mediated (Figure 6) and Ito-mediated P2R.24,27 Inasmuch as both regional Ito density and INa density vary throughout the ventricles (with significant endocardial-to-epicardial gradients in both71–73), this increases the likelihood that some regions will have the correct balance for the 2 mechanisms to synergize and cause P2R.
Our simulations of sex differences in ionic currents indicate that INa-mediated P2R, like the Ito-mediated P2R mechanism, is more likely to occur in male than in female individuals and is more likely to occur at night than during the day, in agreement with clinical observations that most BrS patients are male and have an increased arrhythmia risk at night (Figure 7). Also matching clinical observations,62–64 INa-mediated P2R is facilitated by the accelerated INa inactivation during fever (Table 1).
KEY ALTERATIONS IN ION CHANNEL PROPERTIES PROMOTING INa-MEDIATED P2R.
For INa-mediated P2R, the 2 main alterations in Na channel kinetics that, combined with a reduction in INa amplitude, serve to delay the activation of ICa,L sufficiently to set the stage for P2R are: 1) a negative voltage shift of steady-state inactivation (corresponding to the parameter in the model); and 2) a speedup of time constant of inactivation (corresponding to the parameter in the model). Faster inactivation requires less voltage shift in steady-state inactivation, exhibiting a negative linear correlation. As for INa activation parameters, one might expect that shifting the steady-state activation curve to more positive voltages and slowing the activation time constant to weaken INa activation would promote P2R. However, our simulations show that P2R requires and to maintain adequate separation (Figure 3F, Supplemental Figure 3F) to allow activation of enough INa for successful propagation. Thus, the negative voltage shift of together with a negative voltage shift of preserves this critical relationship, whereas a too large positive voltage shift of does not. Na channel recovery-from-inactivation kinetics (corresponding to in the model) do not directly affect the formation of P2R (Figure 3H) but do affect the rate dependence of P2R via its effect on the recovery of INa amplitude (Figure 4).
Our findings are consistent with experimental evidence that many of the Na channel mutations causing BrS exhibit a negative voltage shift in steady-state inactivation or a reduction in inactivation time constant (Table 1).26,36–45,48 Moreover, a reported Na channel mutation that increases the inactivation time constant and has no effect on steady-state inactivation showed no features of BrS despite significantly reducing INa amplitude, although the resulting conduction abnormalities caused a high incidence of sudden cardiac death.74 Regarding Na channel blocking drugs that are often used clinically to unmask BrS, these drugs also commonly cause negative voltage shifts in steady-state inactivation.47–50 Finally, elevated temperature is known to shorten Na channel inactivation time constant36,37,75,76 (Table 1), correlating with the increased arrhythmia risk in BrS patients during febrile illnesses.62–64
When Na channel inactivation is not sufficiently fast, we also found that the minimum gap between INa inactivation and ICa,L activation required to generate INa-mediated P2R could be achieved by voltage-shifting the steady-state activation curve of ICa,L to more positive voltages (Figure 6). Whereas loss-of-function Ca channel mutations associated with BrS consistently reduce peak ICa,L amplitude, they have not specifically been reported, to our knowledge, to cause a positive voltage shift in steady-state activation. The same also applies to Ca channel blocking drugs.77 Thus, the facilitation of P2R by Ca channel mutations and Ca channel blockers may be related more to restricting ICa,L amplitude to the appropriate range for P2R, ie, small enough to permit the transition from spike-and-dome to spike morphology required for both INa-mediated and Ito-mediated P2R24,27 yet large enough to allow the PVC to propagate (Figures 6 and 7).
IKATP activation has also been implicated as a cause of BrS2 and is also involved in promoting P2R during acute ischemia.15 Being time independent, IKATP is simply a function of voltage and intracellular ATP and thus can have a large effect on the voltage level of the notch. Thus, IKATP activation and changes in ICa,L activation properties interact strongly to influence the transition from spike-and-dome to the spike morphology underlying P2R (Figures 6C and 6F). The importance of IKATP has been demonstrated in canine ventricle experiments using pinacidil to activate IKATP and induce P2R.14
The delayed rectifier K currents, IKs and IKr, on the other hand, play much smaller roles. At the timing of the notch, IKr and IKs are still minimally activated and so have little effect on P2R (Figures 7B and 7C, Supplemental Figure 4).
Unlike the weakly inward-rectifying IKATP, the strongly inwardly-rectifying IK1 has only a small effect on spike-and-dome AP morphology. Moreover, in contrast to IKATP, increasing IK1 suppresses rather than promotes P2R (Supplemental Figure 4). This is similar to the situation with EAD-mediated PVCs in long QT syndrome,24,70,78 in which increasing IK1 suppresses PVCs in tissue because of its antiexcitability effects on tissue-scale instabilities.
CLINICAL IMPLICATIONS FOR ARRHYTHMOGENESIS IN BrS.
These findings are relevant to the role of Na channel dysfunction in both of the proposed mechanisms of arrhythmogenesis in BrS: the depolarization hypothesis positing that fibrosis in the RVOT region predisposes to re-entry, and the repolarization hypothesis positing that the high Ito density in the RV epicardium predisposes to Ito-mediated P2R. In the first case, loss-of-function Na channel mutations or drugs blocking Na channels are well known to promote the initiation of re-entry in fibrotic tissue by exacerbating slow conduction and unidirectional block.29–35 In the second case, however, Na channel dysfunction has previously been thought to play an indirect role, serving to unmask the ability of Ito (or Ito-like currents) to cause the regional early repolarization of the cardiac AP that underlies P2R.22,23,26,27 Our findings, however, show that altered Na channel kinetics, together with reduced Na channel conductance (), play more than an ancillary role and can induce P2R independently of Ito. In this regard, it is interesting to note that monophasic AP recordings from the epicardial RVOT region in BrS patients1,13 (eg, Figure 1A) often exhibit a much lower spike amplitude that more closely resembles the INa-mediated than the Ito-mediated spike-and-dome morphology (Figures 2E and 2F). Also, although the depolarization and repolarization hypotheses have often been viewed as mutually exclusive, there is no a priori reason why both mechanisms cannot be operating simultaneously and/or synergistically in BrS, especially given that Na channel dysfunction is common to both. For example, phase 2 re-excitation without re-entry could be an important source of PVCs that, even if they fail to initiate re-entry on their own via P2R, subsequently propagate into fibrotic regions of the RVOT where they develop unidirectional conduction block and initiate re-entry. P2R in the absence of Ito could also potentially contribute to other forms of early repolarization syndrome, such as when the J-wave elevation occurs in inferior or lateral ECG leads where cardiac ventricular tissue expresses Ito at lower levels than the RVOT region.
STUDY LIMITATIONS.
We only used computer simulations of 1D cable and 2D tissue with 2 action potential models, and thus the results need be further validated in animal experiments or clinical settings. Furthermore, there is no structural defects, such as fibrosis, in the tissue model, and the interactions of altered Na channel kinetics with fibrosis and other structural heterogeneities in the genesis of arrhythmias need to be investigated to further understand the roles of Na channel mutations or blockers in promoting arrhythmias in BrS.
CONCLUSIONS
Loss-of-function Na channel mutations (the most common genetic cause of inherited BrS) and Na channel blocking drugs (that are often used to unmask BrS features) reduce INa amplitude and alter its kinetics to promote P2R. We have demonstrated how kinetic alterations that accelerate Na channel inactivation, alone or in synergy with altered Ca channel properties and/or ATP-sensitive activation, play a heretofore unappreciated essential role in promoting P2R-mediated arrhythmias. These novel findings advance our understanding of the mechanistic links between the causes of BrS and its association with lethal ventricular arrhythmias.
Supplementary Material
PERSPECTIVES.
COMPETENCY IN MEDICAL KNOWLEDGE:
Links Na channel mutations and blockers mechanistically to P2R, providing novel mechanistic insights into arrhythmogenesis in BrS.
TRANSLATIONAL OUTLOOK:
Systematic computer simulations reveal not only a novel mechanism but also key parameters for P2R caused by Na channel mutations or blockers, which provides important information for testing the predictions in experimental systems. Our study, while not resolving the relative importance of the depolarization and repolarization hypotheses to arrhythmogenesis in BrS patients, provides strong mechanistic evidence demonstrating how Na channel mutations and blockers can contribute to both, even in the absence of Ito.
FUNDING SUPPORT
This study was supported by National Institutes of Health grants R01 HL134709, R01 HL133294, P01 HL164311, and R01 HL157116. Dr Zhang was supported by the National Natural Science Foundation of China Grants No. 12375033, No. 12235007 and No. 11975131, Zhejiang Provincial Natural Science Foundation of China under Grant No. LY23A050002; and K. C. Wong Magna Fund at Ningbo University.
AUTHOR DISCLOSURES
The authors have reported that they have no relationships relevant to the contents of this paper to disclose.
ABBREVIATIONS AND ACRONYMS
- 1D
1-dimensional
- 2D
2-dimensional
- AP
action potential
- APD
action potential duration
- BrS
Brugada syndrome
- GCa,L
maximum conductance of ICa,L
- GKATP
maximum conductance of IKATP
- GKr
maximum conductance of IKr
- GKs
maximum conductance of IKs
- GNa
maximum conductance of INa
- Gto
maximum conductance of Ito
- ICa,L
L-type calcium current
- IKATP
ATP-sensitive potassium current
- IKr
rapid component of the delayed rectifier potassium current
- IKs
slow component of the delayed rectifier potassium current
- INa
sodium current
- Ito
transient outward potassium current
- LCC
L-type calcium channel
- P2R
phase 2 re-entry
- PVC
premature ventricular complex
- RVOT
right ventricular outflow tract
Footnotes
APPENDIX For a supplemental video, methods, and figures, please see the online version of this paper.
REFERENCES
- 1.Antzelevitch C, Brugada P, Brugada J, et al. Brugada syndrome: a decade of progress. Circ Res 2002;91:1114–1118. [DOI] [PubMed] [Google Scholar]
- 2.Sieira J, Dendramis G, Brugada P. Pathogenesis and management of Brugada syndrome. Nat Rev Cardiol 2016;13:744–756. [DOI] [PubMed] [Google Scholar]
- 3.Brugada J, Campuzano O, Arbelo E, Sarquella-Brugada G, Brugada R. Present status of Brugada syndrome. J Am Coll Cardiol 2018;72:1046–1059. [DOI] [PubMed] [Google Scholar]
- 4.Wilde AAM, Postema PG, Di Diego JM, et al. The pathophysiological mechanism underlying Brugada syndrome: depolarization versus repolarization. J Mol Cell Cardiol 2010;49:543–553. [DOI] [PMC free article] [PubMed] [Google Scholar]
- 5.Nademanee K, Wilde AAM. Repolarization versus depolarization defects in Brugada syndrome. J Am Conll Cardiol EP 2017;3:364–366. [DOI] [PubMed] [Google Scholar]
- 6.Antzelevitch C, Patocskai B. Brugada syndrome: clinical, genetic, molecular, cellular, and ionic aspects. Curr Probl Cardiol 2016;41:7–57. [DOI] [PMC free article] [PubMed] [Google Scholar]
- 7.Weiss JN. Arrhythmias in Brugada syndrome: defective depolarization, repolarization or both? J Am Coll Cardiol EP 2021;7:271–272. [DOI] [PubMed] [Google Scholar]
- 8.Cerrone M, Costa S, Delmar M. The genetics of Brugada syndrome. Annu Rev Genomics Hum Genet 2022;23:255–274. [DOI] [PubMed] [Google Scholar]
- 9.Lukas A, Antzelevitch C. Differences in the electrophysiological response of canine ventricular epicardium and endocardium to ischemia: role of the transient outward current. Circulation. 1993;88:2903–2915. [DOI] [PubMed] [Google Scholar]
- 10.Liu DW, Gintant GA, Antzelevitch C. Ionic bases for electrophysiological distinctions among epicardial, midmyocardial, and endocardial myocytes from the free wall of the canine left ventricle. Circ Res 1993;72:671–687. [DOI] [PubMed] [Google Scholar]
- 11.Greenstein JL, Wu R, Po S, Tomaselli GF, Winslow RL. Role of the calcium-independent transient outward current I(to1) in shaping action potential morphology and duration. Circ Res 2000;87:1026–1033. [DOI] [PubMed] [Google Scholar]
- 12.Landaw J, Zhang Z, Song Z, et al. Small-conductance Ca2+-activated K+ channels promote J-wave syndrome and phase 2 reentry. Heart Rhythm 2020;17:1582–1590. [DOI] [PMC free article] [PubMed] [Google Scholar]
- 13.Kurita T, Shimizu W, Inagaki M, et al. The electrophysiologic mechanism of ST-segment elevation in Brugada syndrome. J Am Coll Cardiol 2002;40:330–334. [DOI] [PubMed] [Google Scholar]
- 14.Di Diego JM, Antzelevitch C. Pinacidil-induced electrical heterogeneity and extrasystolic activity in canine ventricular tissues: does activation of ATP-regulated potassium current promote phase 2 reentry? Circulation. 1993;88:1177–1189. [DOI] [PubMed] [Google Scholar]
- 15.Lukas A, Antzelevitch C. Phase 2 reentry as a mechanism of initiation of circus movement reentry in canine epicardium exposed to simulated ischemia. Cardiovasc Res 1996;32:593–603. [PubMed] [Google Scholar]
- 16.Morita H, Kusano KF, Miura D, et al. Fragmented QRS as a marker of conduction abnormality and a predictor of prognosis of Brugada syndrome. Circulation. 2008;118:1697–1704. [DOI] [PubMed] [Google Scholar]
- 17.Yan GX, Joshi A, Guo D, et al. Phase 2 reentry as a trigger to initiate ventricular fibrillation during early acute myocardial ischemia. Circulation. 2004;110:1036–1041. [DOI] [PubMed] [Google Scholar]
- 18.Aiba T, Shimizu W, Hidaka I, et al. Cellular basis for trigger and maintenance of ventricular fibrillation in the Brugada syndrome model: high-resolution optical mapping study. J Am Coll Cardiol 2006;47:2074–2085. [DOI] [PubMed] [Google Scholar]
- 19.Take Y, Morita H, Wu J, et al. Spontaneous electrocardiogram alterations predict ventricular fibrillation in Brugada syndrome. Heart Rhythm 2011;8:1014–1021. [DOI] [PubMed] [Google Scholar]
- 20.Maoz A, Krogh-Madsen T, Christini DJ. Instability in action potential morphology underlies phase 2reentry: a mathematical modeling study. Heart Rhythm 2009;6:813–822. [DOI] [PubMed] [Google Scholar]
- 21.Miyoshi S, Mitamura H, Fujikura K, et al. A mathematical model of phase 2 reentry: role of L-type Ca current. Am J Physiol Heart Circ Physiol 2003;284:H1285–H1294. [DOI] [PubMed] [Google Scholar]
- 22.Miyoshi S, Mitamura H, Fukuda Y, et al. Link between SCN5A mutation and the Brugada syndrome ECG phenotype: simulation study. Circ J 2005;69:567–575. [DOI] [PubMed] [Google Scholar]
- 23.Cantalapiedra IR, Penaranda A, Mont L, Brugada J, Echebarria B. Reexcitation mechanisms in epicardial tissue: role of I(to) density heterogeneities and I(Na) inactivation kinetics. J Theor Biol 2009;259:850–859. [DOI] [PubMed] [Google Scholar]
- 24.Zhang Z, Qu Z. Life and death saddles in the heart. Phys Rev E 2021;103:062406. [DOI] [PMC free article] [PubMed] [Google Scholar]
- 25.Maoz A, Christini DJ, Krogh-Madsen T. Dependence of phase-2 reentry and repolarization dispersion on epicardial and transmural ionic heterogeneity: a simulation study. Europace. 2014;16: 458–465. [DOI] [PMC free article] [PubMed] [Google Scholar]
- 26.Bébarová M, O’Hara T, Geelen JLMC, et al. Subepicardial phase 0 block and discontinuous transmural conduction underlie right precordial ST-segment elevation by a SCN5A loss-of-function mutation. Am J Physiol Heart Circ Physiol 2008;295:H48–H58. [DOI] [PMC free article] [PubMed] [Google Scholar]
- 27.Zhang Z, Chen P-S, Weiss JN, Qu Z. Why is only type 1 electrocardiogram diagnostic of Brugada syndrome? Mechanistic insights from computer modeling. Circ Arrhythm Electrophysiol 2022;15: e010365. [DOI] [PMC free article] [PubMed] [Google Scholar]
- 28.Nguyen TP, Singh N, Xie Y, Qu Z, Weiss JN. Repolarization reserve evolves dynamically during the cardiac action potential: effects of transient outward currents on early afterdepolarizations. Circ Arrhythm Electrophysiol 2015;8:694–702. [DOI] [PMC free article] [PubMed] [Google Scholar]
- 29.Wu TJ, Ong JJ, Hwang C, et al. Characteristics of wave fronts during ventricular fibrillation in human hearts with dilated cardiomyopathy: role of increased fibrosis in the generation of reentry. J Am Coll Cardiol 1998;32:187–196. [DOI] [PubMed] [Google Scholar]
- 30.Qu Z, Karagueuzian HS, Garfinkel A, Weiss JN. Effects of Na+ channel and cell coupling abnormalities on vulnerability to reentry: a simulation study. Am J Physiol Heart Circ Physiol 2004;286: H1310–H1321. [DOI] [PubMed] [Google Scholar]
- 31.de Jong S, van Veen TAB, van Rijen HVM, de Bakker JMT. Fibrosis and cardiac arrhythmias. J Cardiovasc Pharmacol 2011;57:630–638. [DOI] [PubMed] [Google Scholar]
- 32.Nguyen TP, Qu Z, Weiss JN. Cardiac fibrosis and arrhythmogenesis: the road to repair is paved with perils. J Mol Cell Cardiol 2014;70:83–91. [DOI] [PMC free article] [PubMed] [Google Scholar]
- 33.Campos FO, Whitaker J, Neji R, et al. Factors promoting conduction slowing as substrates for block and reentry in infarcted hearts. Biophys J 2019;117:2361–2374. [DOI] [PMC free article] [PubMed] [Google Scholar]
- 34.Hansen BJ, Zhao J, Helfrich KM, et al. Unmasking arrhythmogenic hubs of reentry driving persistent atrial fibrillation for patient-specific treatment. J Am Heart Assoc 2020;9: e017789. [DOI] [PMC free article] [PubMed] [Google Scholar]
- 35.Haïssaguerre M, Nademanee K, Sacher F, et al. Multisite conduction block in the epicardial substrate of Brugada syndrome. Heart Rhythm 2022;19:417–426. [DOI] [PubMed] [Google Scholar]
- 36.Dumaine R, Towbin JA, Brugada P, et al. Ionic mechanisms responsible for the electrocardio-graphic phenotype of the Brugada syndrome are temperature dependent. Circ Res 1999;85:803– 809. [DOI] [PubMed] [Google Scholar]
- 37.Rook MB, Bezzina Alshinawi C, Groenewegen WA, et al. Human SCN5A gene mutations alter cardiac sodium channel kinetics and are associated with the Brugada syndrome. Cardiovasc Res 1999;44:507–517. [DOI] [PubMed] [Google Scholar]
- 38.Petitprez S, Jespersen T, Pruvot E, et al. Analyses of a novel SCN5A mutation (C1850S): conduction vs. repolarization disorder hypotheses in the Brugada syndrome. Cardiovasc Res 2008;78: 494–504. [DOI] [PubMed] [Google Scholar]
- 39.Watanabe H, Koopmann TT, Le Scouarnec S, et al. Sodium channel b1 subunit mutations associated with Brugada syndrome and cardiac conduction disease in humans. J Clin Invest 2008;118: 2260–2268. [DOI] [PMC free article] [PubMed] [Google Scholar]
- 40.Hu D, Barajas-Martinez H, Burashnikov E, et al. A mutation in the b3 subunit of the cardiac sodium channel associated with Brugada ECG phenotype. Circ Cardiovasc Genet 2009;2:270– 278. [DOI] [PMC free article] [PubMed] [Google Scholar]
- 41.Zeng Z, Zhou J, Hou Y, et al. Electrophysiological characteristics of a SCN5A voltage sensors mutation R1629Q associated with Brugada syndrome. PLoS One. 2013;8:e78382. [DOI] [PMC free article] [PubMed] [Google Scholar]
- 42.Calloe K, Refaat MM, Grubb S, et al. Characterization and mechanisms of action of novel NaV1.5 channel mutations associated with Brugada syndrome. Circ Arrhythm Electrophysiol 2013;6:177–184. [DOI] [PubMed] [Google Scholar]
- 43.Kanters JK, Yuan L, Hedley PL, et al. Flecainide provocation reveals concealed Brugada syndrome in a long QT syndrome family with a novel L1786Q mutation in SCN5A. Circ J 2014;78:1136–1143. [DOI] [PubMed] [Google Scholar]
- 44.Bezzina C, Veldkamp MW, van Den Berg MP, et al. A single Na+ channel mutation causing both long-QT and Brugada syndromes. Circ Res 1999;85:1206–1213. [DOI] [PubMed] [Google Scholar]
- 45.Baroudi G, Acharfi S, Larouche C, Chahine M. Expression and intracellular localization of an SCN5A double mutant R1232W/T1620M implicated in Brugada syndrome. Circ Res 2002;90: e11–e16. [PubMed] [Google Scholar]
- 46.Rivolta I, Abriel H, Tateyama M, et al. Inherited Brugada and long QT-3 syndrome mutations of a single residue of the cardiac sodium channel confer distinct channel and clinical phenotypes. J Biol Chem 2001;276:30623–30630. [DOI] [PubMed] [Google Scholar]
- 47.Liu H, Tateyama M, Clancy CE, Abriel H, Kass RS. Channel openings are necessary but not sufficient for use-dependent block of cardiac Na+ channels by flecainide: evidence from the analysis of disease-linked mutations. J Gen Physiol 2002;120:39–51. [DOI] [PMC free article] [PubMed] [Google Scholar]
- 48.Barajas-Martínez HM, Hu D, Cordeiro JM, et al. Lidocaine-induced Brugada syndrome phenotype linked to a novel double mutation in the cardiac sodium channel. Circ Res 2008;103:396–404. [DOI] [PMC free article] [PubMed] [Google Scholar]
- 49.Liu H, Atkins J, Kass RS. Common molecular determinants of flecainide and lidocaine block of heart Na+ channels: evidence from experiments with neutral and quaternary flecainide analogues. J Gen Physiol 2003;121:199–214. [DOI] [PMC free article] [PubMed] [Google Scholar]
- 50.Friedrich O, Wegner FV, Wink M, Fink RHA. Na+- and K+-channels as molecular targets of the alkaloid ajmaline in skeletal muscle fibres. Br J Pharmacol 2007;151:63–74. [DOI] [PubMed] [Google Scholar]
- 51.ten Tusscher KH, Noble D, Noble PJ, Panfilov AV. A model for human ventricular tissue. Am J Physiol Heart Circ Physiol 2004;286:H1573– H1589. [DOI] [PubMed] [Google Scholar]
- 52.Luo CH, Rudy Y. A dynamical model of the cardiac ventricular action potential: I. simulations of ionic currents and concentration changes. Circ Res 1994;74:1071–1096. [DOI] [PubMed] [Google Scholar]
- 53.Qu Z, Xie L-H, Olcese R, et al. Early after-depolarizations in cardiac myocytes: beyond reduced repolarization reserve. Cardiovasc Res 2013;99:6–15. [DOI] [PMC free article] [PubMed] [Google Scholar]
- 54.Weiss JN, Karma A, Maclellan WR, et al. “Good enough solutions” and the genetics of complex diseases. Circ Res 2012;111:493–504. [DOI] [PMC free article] [PubMed] [Google Scholar]
- 55.Qu Z, Liu MB, Olcese R, et al. R-on-T and the initiation of reentry revisited: Integrating old and new concepts. Heart Rhythm 2022;19:1369–1383. [DOI] [PMC free article] [PubMed] [Google Scholar]
- 56.Diego JMD, Cordeiro JM, Goodrow RJ, et al. Ionic and cellular basis for the predominance of the Brugada syndrome phenotype in males. Circulation. 2002;106:2004–2011. [DOI] [PubMed] [Google Scholar]
- 57.Yan GX, Antzelevitch C. Cellular basis for the Brugada syndrome and other mechanisms of arrhythmogenesis associated with ST-segment elevation. Circulation. 1999;100:1660–1666. [DOI] [PubMed] [Google Scholar]
- 58.Fish JM, Antzelevitch C. Role of sodium and calcium channel block in unmasking the Brugada syndrome. Heart Rhythm 2004;1:210–217. [DOI] [PMC free article] [PubMed] [Google Scholar]
- 59.Milman A, Gourraud J-B, Andorin A, et al. Gender differences in patients with Brugada syndrome and arrhythmic events: data from a survey on arrhythmic events in 678 patients. Heart Rhythm 2018;15:1457–1465. [DOI] [PubMed] [Google Scholar]
- 60.Yamaki M, Sato N, Okada M, et al. A case of Brugada syndrome in which diurnal ECG changes were associated with circadian rhythms of sex hormones. Int Heart J 2009;50:669–676. [DOI] [PubMed] [Google Scholar]
- 61.Kim S-H, Nam G-B, Baek S, et al. Circadian and seasonal variations of ventricular tachyarrhythmias in patients with early repolarization syndrome and Brugada syndrome: analysis of patients with implantable cardioverter defibrillator. J Cardiovasc Electrophysiol 2012;23:757–763. [DOI] [PubMed] [Google Scholar]
- 62.Porres JM, Brugada J, Urbistondo V, García F, Reviejo K, Marco P. Fever unmasking the Brugada syndrome. Pacing Clin Electrophysiol 2002;25: 1646–1648. [DOI] [PubMed] [Google Scholar]
- 63.Chockalingam P, Clur S- AB, Breur JMPJ, et al. The diagnostic and therapeutic aspects of loss-of-function cardiac sodium channelopathies in children. Heart Rhythm 2012;9:1986–1992. [DOI] [PubMed] [Google Scholar]
- 64.Adler A, Topaz G, Heller K, et al. Fever-induced Brugada pattern: how common is it and what does it mean? Heart Rhythm 2013;10:1375– 1382. [DOI] [PMC free article] [PubMed] [Google Scholar]
- 65.Yang P-C, Perissinotti LL, López-Redondo F, et al. A multiscale computational modelling approach predicts mechanisms of female sex risk in the setting of arousal-induced arrhythmias. J Physiol 2017;595:4695–4723. [DOI] [PMC free article] [PubMed] [Google Scholar]
- 66.Gaborit N, Varro A, Le Bouter S, et al. Gender-related differences in ion-channel and transporter subunit expression in non-diseased human hearts. J Mol Cell Cardiol 2010;49:639–646. [DOI] [PubMed] [Google Scholar]
- 67.Chen Y, Zhu D, Yuan J, et al. CLOCK-BMAL1 regulate the cardiac L-type calcium channel subunit CACNA1C through PI3K-Akt signaling pathway. Can J Physiol Pharmacol 2016;94:1023–1032. [DOI] [PubMed] [Google Scholar]
- 68.Jeyaraj D, Haldar SM, Wan X, et al. Circadian rhythms govern cardiac repolarization and arrhythmogenesis. Nature. 2012;483:96–99. [DOI] [PMC free article] [PubMed] [Google Scholar]
- 69.Liu GX, Choi BR, Ziv O, et al. Differential conditions for early after-depolarizations and triggered activity in cardiomyocytes derived from transgenic LQT1 and LQT2 rabbits. J Physiol 2012;590:1171–1180. [DOI] [PMC free article] [PubMed] [Google Scholar]
- 70.Zhang Z, Liu MB, Huang X, Song Z, Qu Z. Mechanisms of premature ventricular complexes caused by QT prolongation. Biophys J 2021;120: 352–369. [DOI] [PMC free article] [PubMed] [Google Scholar]
- 71.Cordeiro JM, Mazza M, Goodrow R, Ulahannan N, Antzelevitch C, Diego JMD. Functionally distinct sodium channels in ventricular epicardial and endocardial cells contribute to a greater sensitivity of the epicardium to electrical depression. Am J Physiol Heart Circ Physiol 2008;295:H154–H162. [DOI] [PMC free article] [PubMed] [Google Scholar]
- 72.Remme CA, Verkerk AO, Hoogaars WMH, et al. The cardiac sodium channel displays differential distribution in the conduction system and transmural heterogeneity in the murine ventricular myocardium. Basic Res Cardiol 2009;104:511–522. [DOI] [PMC free article] [PubMed] [Google Scholar]
- 73.Veerman CC, Podliesna S, Tadros R, et al. The Brugada syndrome susceptibility gene HEY2 modulates cardiac transmural ion channel patterning and electrical heterogeneity. Circ Res 2017;121:537–548. [DOI] [PubMed] [Google Scholar]
- 74.Zumhagen S, Veldkamp MW, Stallmeyer B, et al. A heterozygous deletion mutation in the cardiac sodium channel gene SCN5A with loss- and gain-of-function characteristics manifests as isolated conduction disease, without signs of Brugada or long QT syndrome. PLoS One. 2013;8: e67963. [DOI] [PMC free article] [PubMed] [Google Scholar]
- 75.Nagatomo T, Fan Z, Ye B, et al. Temperature dependence of early and late currents in human cardiac wild-type and long Q-T ∆KPQ Na+ channels. Am J Physiol Heart Circ Physiol 1998;275: H2016–H2024. [DOI] [PubMed] [Google Scholar]
- 76.Park DS, Shekhar A, Marra C, et al. Fhf2 gene deletion causes temperature-sensitive cardiac conduction failure. Nat Commun 2016;7:12966. [DOI] [PMC free article] [PubMed] [Google Scholar]
- 77.Lee KS, Tsien RW. Mechanism of calcium channel blockade by verapamil, D600, diltiazem and nitrendipine in single dialysed heart cells. Nature. 1983;302:790–794. [DOI] [PubMed] [Google Scholar]
- 78.Huang X, Kim TY, Koren G, Choi B-R, Qu Z. Spontaneous initiation of premature ventricular complexes and arrhythmias in type 2 long QT syndrome. Am J Physiol Heart Circ Physiol 2016;311:H1470–H1484. [DOI] [PMC free article] [PubMed] [Google Scholar]
Associated Data
This section collects any data citations, data availability statements, or supplementary materials included in this article.