Abstract
The pattern of expression of glutaminase isoenzymes in tumour cells has been investigated to clarify its role in the malignant transformation and the prospect of its use as a clinically relevant factor. Using leukaemia cells from medullar blood of human patients and several established human cancer cell lines, we have developed a competitive RT (reverse transcriptase)-PCR assay to quantify simultaneously K-type (kidney-type) and L-type (liver-type) glutaminase mRNAs. Co-expression of both transcripts and higher amounts of L-type mRNA were always found in all cancer cell types analysed. However, mature lymphocytes from the medullar blood of a patient suffering aplasia did not express the K-type transcript and showed a 15-fold increase of L-type transcript. Co-expression was also confirmed at the protein level using isoform-specific antibodies; nevertheless, it did not correlate with the relative abundance of glutaminase transcripts and strong K-type protein signals were detected. On the other hand, marked differences were found with regard to glutamate inhibition and phosphate activation of tumour glutaminase activity. Taken together, the protein data suggest that K isoform would account for the majority of glutaminase activity in these human tumour cells. The results confirm that simultaneous expression of both isoenzymes in human cancer cells is a more frequent event than previously thought. Furthermore, the present work and other previous data suggest that K isoform is up-regulated with increased rates of proliferation, whereas prevalence of the L isoform seems to be related with resting or quiescent cell states.
Keywords: breast cancer cell, glutaminase, glutamine, hepatoma cancer cell, leukaemia, reverse transcriptase PCR (RT-PCR)
Abbreviations: GA, glutaminase; GS, glutamine synthetase; KGA, kidney-type glutaminase; LGA, liver-type glutaminase; MBMNC, medullar blood mononuclear cell; RT, reverse transcriptase
INTRODUCTION
The causes of tumour formation are genetic mutational events that lead either to the over-expression of growth-promoting oncogenes or the inactivation of cell cycle-controlling tumour suppressor genes. Both over-expression and loss of expression of genes are important steps in the tumorigenesis of many types of cancer. The role of two key genes of glutamine metabolism, glutamine synthetase (GS, EC 6.3.1.2) and glutaminase (GA, EC 3.5.1.2), has received considerably attention in tumour biology, because glutamine behaves as a central metabolite for growth and proliferation [1].
The catabolism of glutamine has been linked to neoplastic transformation [2]. The high rate of glutaminolysis observed in a wide variety of tumours would be essential to maintain their proliferative capacity [3]. Thus GA over-expression seems to be a hallmark exhibited by many tumours [4]. Studies on experimental and human tumours, looking at changes in enzymic activity and relative mRNA levels of both GS and GA, revealed a similar pattern in many cases: a knock-down or repression of GS expression along with an over-expression of GA [5]. Moreover, the inhibition of GA expression by antisense technology decreases tumour cell proliferation and promotes reversal of the transformed phenotype [6]. Tumour cells transfected with antisense GA cDNA constructs were unable to grow in the peritoneal cavity of mice due to their inability to reject the host immune response [7].
In humans there are two GA genes: one encoding the K-type (kidney-type) isoenzyme, located on chromosome 2, and another on chromosome 12 encoding the L-type (liver-type) isoform [8]. The KGA isoenzyme was the first cloned from rat brain and kidney [9]; it seemed to be ubiquitous in all tissues with GA activity, with the exception of postnatal liver [10]. The KGA gene has been shown to elicit many mRNA transcripts employing multiple polyadenylation sites [11] or alternative splicing [12]. The alternatively spliced mRNA encodes a protein with a distinct C-terminal region from that of KGA; thus, it represents a new KGA isoform, named GAC, first described in human kidney and colon cancer cells [12]. The LGA isoenzyme was originally thought to be present only in adult liver tissue [13]. However, emerging evidence has now clearly demonstrated that expression also occurs in extrahepatic tissues, such as brain, pancreas and breast cancer cells [14]. The human LGA gene has been extensively characterized in our laboratory [15].
In human colorectal tumour cells most GA activity was K-type, in spite of the fact that these cells expressed both GAC and LGA transcripts [16]. Nevertheless, studies at the molecular level of GA expression in tumour cells are scarce. The molecular portrait of GA expression in human tumour cell lines would be of interest in clinical studies if a pervasive pattern would be associated with proliferation, degree of malignancy, response to chemotherapy or clinical outcome of the patients. With this goal in mind, the results here reported are aimed at studying the pattern of GA expression in human leukaemia and breast cancer cells, at both the transcriptional and translational level. In order to study the mRNA level of human tumour cells a new quantitative RT (reverse transcriptase)-PCR assay has been developed, which allow simultaneous detection of KGA and LGA mRNAs with great sensitivity. At the protein level, we take advantage of the use of immunoblot analysis with isoform-specific anti-GA antibodies. In this study, an unexpected result was confirmed: the co-expression of KGA and LGA isoforms in human cancer cells is a frequent event. Furthermore, KGA expression is up-regulated with increased rates of proliferation, whereas repression of KGA and prevalence of LGA transcript would be related to quiescent or resting states.
EXPERIMENTAL
Cell lines and patient samples
Human hepatoblastoma HepG2 cells (European Collection of Cell Cultures, Porton Down, Salisbury, Wiltshire, U.K.) were maintained in Eagle's minimum essential medium with 1% non-essential amino acids and 1 mM sodium pyruvate (BioWhittaker), supplemented with 2 mM L-glutamine, 10% (v/v) fetal calf serum (Harlan), 100 units/ml penicillin, 100 μg/ml streptomycin and 2.5 μg/ml amphotericin (antibiotics were from Roche). The human breast cancer cell line MCF7 (A.T.C.C.) was maintained in DMEM (Dulbecco's modified Eagle's medium) with 4.5 g/l glucose, supplemented with 10% fetal calf serum, 100 units/ml penicillin, 100 μg/ml streptomycin and 2.5 μg/ml amphotericin. The KU812F human myeloid cell line and the ZR-75-1 breast cancer cell line were cultured as described previously [14]. Human studies were performed on 11 patients suffering from lymphoblastic leukaemia. One additional patient suffering from medullar aplasia was also included in our study. Patients were diagnosed and treated in the Hospital Materno Infantil of Málaga. When they were included in the study all of them were symptomatic and were not taking any drug for the relief of these symptoms. Informed consent was obtained in all cases and ethics approval was obtained from The Hospital Materno Infantil Ethics of Human Research Committee.
Blood samples and RNA isolation
Medullar blood samples (2 ml) were collected in EDTA-coated tubes, and were centrifuged at 800 g for 30 min at 4 °C through a Ficoll (Lymphopred™) density gradient for the separation of MBMNCs (medullar blood mononuclear cells) from whole blood. MBMNCs were washed with 0.9% NaCl twice by centrifugation at 250 g at 4 °C, and counted using a haemocytometer. Total RNA was isolated using TRI Reagent (Sigma). Total RNA from human brain tissue was from Clontech.
RT-PCR analysis
Single-stranded cDNA was synthesized by reverse transcription of total RNA by using SuperScript II RT (Gibco BRL) and 0.2 pmol of antisense specific primers RT-LGA (Table 1) and RT-KGA (Table 1) for the LGA and KGA transcripts respectively. Total RNA (2 μg) was incubated with the antisense primer at 80 °C for 3 min and then put on ice. Reverse transcription reactions (20 μl) were prepared by mixing the RNA and antisense primer with 4 μl of First strand 5×buffer (Gibco BRL), 1 μl of 10 mM dNTPs, 2 μl of 0.1 M dithiothreitol, 10 units of RNase inhibitor (Promega), diethyl pyrocarbonate-treated water and 10 units of SuperScript II RT. This mixture was incubated at 42 °C for 1 h, at 50 °C for 10 min, at 70 °C for 15 min and then put on ice. After that, 1.5 units of RNase H (USB) was added to the mixture and then it was incubated at 37 °C for 20 min. A volume of 2 μl of this reaction mixture was used as a substrate for 40 cycles of PCR. Cycling conditions included an initial denaturation step at 94 °C for 5 min, followed by 40 cycles of 30 s at 94 °C, 1 min at 50 °C and 2 min at 72 °C, and a final extension step of 10 min at 72 °C. For the LGA enzyme the PCR was carried out in a 50-μl reaction mixture with 0.5 unit of Taq DNA polymerase (Roche) in 1×PCR buffer (Roche), using 0.2 mM dNTPs, 5 μl of sterilized glycerol and 0.5 μM of each forward and reverse primer. Primers used for PCR were F-LGA and R-LGA (Table 1). For the KGA transcript, the PCR was made in a 50 μl reaction mixture with 0.5 unit of Taq DNA polymerase (Roche) in 1×PCR buffer (Roche), using 0.2 mM dNTPs, 10 μl of sterilized glycerol and 0.5 μM of each primer forward and reverse. Primers used for PCR were F-KGA and R-KGA (Table 1). For the GAC transcript the primers used were F-GAC and R-GAC (Table 1) and PCR was carried out as described previously [12]. In each case an RT negative control, made up of the components of the RT reaction mixture, without the addition of RNA, was used as the template in the reaction. The PCR negative control contains the reagents of the PCR reaction but lacks template. Additional control using genomic DNA (100 ng) was used to confirm that a product of equal size to the cDNA product would not be amplified. The PCR products were separated in 1.5% agarose gels.
Table 1. Oligonucleotides used for RT-PCR and competitive RT-PCR experiments in human GA analysis.
Sequences used to design of the primers were obtained from GenBank (accession numbers AF348119 for LGA, M65150 for KGA and AF158555 for GAC). Numbering of nucleotides is based on the transcription start site. Numbering of nucleotides and positions are relative to LGA, KGA and GAC respectively.
| Name | Sequence | nt | Exon position |
|---|---|---|---|
| RT-LGA | 5′-CCGTGGGTCTAACTTCCGAGCAC-3′ | 1457–1479 | 14 |
| RT-KGA | 5′-TCCAAGCTAGGTAACAGACCCT-3′ | 648–669 | 3 |
| F-LGA | 5′-GCAGAGAGACGCCACACAG-3′ | 191–209 | 1 |
| R-LGA | 5′-GCATCTCGCTCATGCAGTCT-3′ | 378–397 | 3 |
| F-KGA | 5′-AGAACCGGTCGCGGCAATCCTA-3′ | 13–34 | 1 |
| R-KGA | 5′-CTGAGGCCACAAGCTTTTTGCCCTCG-3′ | 604–629 | 2 |
| F-GAC | 5′-TGATGGCTGCGACACTGGCTAATG-3′ | 1184–1207 | 8 |
| R-GAC | 5′-GATGTCCTCATTTGACTCAGGTGAC-3′ | 1623–1647 | 13 |
| C-LGA | 5′-GCATCTCGCTCATGCAGTCTCTTGTGGATAGGGGTTCGTTCC-3′ | ||
| C-KGA | 5′-CTGAGGCCACCAGCTCTTTGCCCTCGGTGCCCGCCGCAGAGTCGCGCTC-3′ |
Competitive RT-PCR
Total RNA was reverse-transcribed using Superscript II RT as described above. A competitor or DNA mimic is a cDNA fragment used as competitive internal standard in PCR amplification which may be used for quantification of transcript levels of target genes [17]. Two competitors were constructed for KGA and LGA transcripts respectively. We used two rounds of PCR amplification generating fragments of 157 bp (LGA competitor) and 350 bp (KGA competitor). To generate GA competitors for the target fragments, we used composite primers consisting of the reverse GA primers (R-LGA and R-KGA respectively, Table 1), but with the addition of 22 bp for LGA (C-LGA, Table 1) and 23 bp for KGA (C-KGA, Table 1) [18]. Each 50-μl reaction mixture contained 2 μl of plasmid cDNA (200 ng/μl) with the ORF (open reading frame) of LGA (pGEMT[hLGA]) or KGA (pBlueScript II SK+[hKGA]) respectively, 5 μl of 10×reaction buffer (Roche), 5 μl of 1 mM dNTPs, 3 μl of 5 μM forward (F-LGA or F-KGA) and reverse primers (C-LGA or C-KGA), and 1 unit of Taq polymerase (Roche). The amplification conditions were 1 cycle of 94 °C for 5 min, followed by 40 cycles of 94 °C for 30 s, 50 °C for 1 min and 72 °C for 2 min. A final extension cycle of 72 °C for 10 min completed the amplification. The products of these amplifications are 157 and 350 bp long and the ends of the fragments are complementary to the forward and reverse LGA and KGA primers. These fragments were purified by 1.5% agarose gel electrophoresis, quantified by spectophotometry and used as the competitors. The final step of competitive RT-PCR was carried out using the same amplification conditions (cycles, times and temperatures), but with some modifications in the composition of the 50-μl reaction mixture. Each 50-μl reaction mixture contained 2 μl of cDNA (from the respective reverse transcription reaction), 5 μl of 10× reaction buffer (Roche), 5 μl of sterilized glycerol for LGA experiments and 10 μl for KGA amplifications, 1 μl of 10 mM dNTPs, 2 μl of 12.5 μM forward (F-LGA or F-KGA) and reverse primers (R-LGA or R-KGA) and 0.5 unit of Taq polymerase (Roche). Additionally, 10-fold dilution series of competitor cDNA were used in amplifications. Each target cDNA (2 μl) was co-amplified with 10, 1, 0.1, 0.01 or 0.001 ng of the respective GA competitor. Finally, 10 μl of the PCR products was subjected to electrophoresis on a 1.5% agarose gel and stained with 0.5 μg/ml ethidium bromide for 20 min to estimate the intensity of the bands. The identity of all products were confirmed by sequencing.
Although the LGA and KGA genes and the competitors share the same primer templates, the intervening DNA sequences differ, thus making it possible for the competitors and GA transcripts to amplify with different efficiencies due to differences in several factors [17]. To compare the data of PCR amplification of GA transcripts with the serial dilutions of competitors, we titrated the respective competitors with a constant amount of a cloned GA cDNA. In the analysis of transcripts levels we included 2.5 μCi (0.25 μl) of [α-32P]dCTP in the standard reaction. For quantification of relative band intensities, gels were cut and their radioactivity analysed in a liquid-scintillation counter.
Western blotting and analytical measurements
Cultured cells were washed with PBS buffer, trypsinized and eluted from culture dishes with 10 ml of PBS (except for KU812F cells that grow in suspension). After counting with a Coulter counter, cells were pelleted, washed twice with PBS, and resuspended in Tes buffer (25 mM Tris/HCl, 0.2 mM EDTA, 0.33 M sucrose, pH 8.0) containing the Complete Protease Inhibitor kit (Roche). For isolation of mitochondria, cells were homogenized by 10 strokes in a Teflon glass Potter homogenizer and centrifuged at 1000 g for 10 min at 4 °C. The supernatant was centrifuged at 12000 g for 10 min at 4 °C and the pellet, crude mitochondrial fraction, was resuspended in a small volume of Tes buffer, divided into aliquots and kept at −80 °C until analysis. Protein content was determined by a modified Lowry method [19]. GA activity was measured as described elsewhere [20]. Mitochondrial fractions and cell extracts were analysed by SDS/PAGE and Western blotting essentially as described previously [21], using isoform-specific polyclonal antibodies raised in rabbits against recombinant LGA and KGA proteins [21,22]. The blots were developed with the enhanced chemiluminiscence technique as recommended by the manufacturer (Amersham Biosciences).
Statistical analysis
All experiments were carried out at least in triplicate and P<0.01 was significance, as tested with the Mann–Whitney U test. Representative gels are shown in the Figures below.
RESULTS
GA expression in patients suffering from leukaemia and medullar aplasia
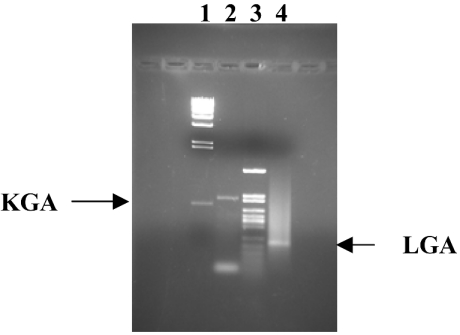
Preliminary work established the optimal reaction conditions for selective and simultaneous amplification of the LGA and KGA targets. We chose RNA from total human brain to optimize and check the specificity of the RT-PCR method, because it has been previously demonstrated that human brain contains both KGA and LGA isoforms [14,22]. The sizes of the PCR-specific products were 210 bp for LGA and 618 bp for the KGA (Figure 1). A negative control containing 2 μl of RT-omitted reaction mixture instead of cDNA did not yield any product (results not shown). The fragment of 464 bp corresponding to the GAC isoform was not obtained, even though specific primers and optimal PCR conditions for amplification of this human isoform were used [12].
Figure 1. Expression of KGA and LGA markers in human brain.
Samples of total RNA derived from commercially available human brain tissue were reverse-transcribed and PCR-amplified for 40 cycles with forward and reverse KGA and LGA isoform-specific primers. The products were separated on 1.5% agarose gel and visualized by ethidium bromide staining. Lanes 1 and 3 represent φλ/HindIII and pFL61/HpaII molecular-mass markers respectively. The amplified products are indicated with arrows. Lane 2 contains KGA product (618 bp) and lane 4 contains LGA product (210 bp). The identity of the bands was confirmed by sequencing.
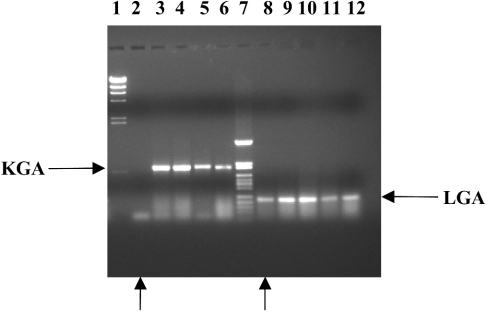
Next, we evaluated the presence of GA isoenzymes in human leukaemia cells by RT-PCR. Both KGA and LGA isoforms were detected in MBMNCs in a very similar ratio (Figure 2). The cellular content of medullar blood of acute lymphoblastic leukaemia patients, showed more than 95% of tumour cells, mostly undifferentiated blasts; thus the pattern of mRNA expression can be ascribed to precursor blasts cells of myeloid or lymphoid lineages. Again, the GAC isoform was not detected in any analysed sample (results not shown). However, a striking result was found in the analysis of medullar blood from a patient suffering from medullar aplasia: the level of KGA fragment was fully undetectable (Figure 2). The haemogram of this medullar blood lacks precursor blood cells, mature lymphocytes being the predominant population for this particular patient, after Lymphoprep™ purification. Furthermore, the absence of KGA isoform in these cells was accompanied by a 15-fold higher LGA expression than that shown by MBMNCs from patients suffering from leukaemia, as judged by competitive RT-PCR (Table 2).
Figure 2. Expression of KGA and LGA markers in medullar blood of patients suffering from leukaemia.
Samples of total RNA derived from MBMNCs of patients suffering from leukaemia were reverse-transcribed and PCR-amplified for 40 cycles with forward and reverse KGA and LGA specific primers. The products were separated on 1.5% agarose gel and visualized by ethidium bromide staining. Lanes 1 and 7 represent φλ/HindIII and pFL61/HpaII molecular-mass markers respectively. The amplified products are indicated with horizontal arrows. Lanes 3–6 contain KGA product (618 bp) and lanes 8–12 contain LGA product (210 bp). Lanes 2 and 8, marked with vertical arrows, correspond to the patient suffering from medullar aplasia which only showed the LGA fragment.
Table 2. Quantification of GA mRNA isoforms using a competitive RT-PCR method.
Each experiment was carried out at least in triplicate.
| GA mRNA (fg/μg of total RNA) | ||||||
|---|---|---|---|---|---|---|
| Isoenzyme | Cell type… | MCF7 | ZR-75-1 | HepG-2 | Leukaemia MBMNCs | Medullar aplasia |
| KGA | ∼50† | ∼50† | ∼50*† | 10* | 0 | |
| LGA | 100 | 100 | 1000 | 100 | 1500 | |
* P<0.01 as tested with the Mann–Whitney U test.
† The relative amount of KGA mRNA was between 10 and 100 fg/μg of RNA in MCF7, ZR-75-1 and HepG-2 cells.
Competitive RT-PCR applied to human leukaemia cells and tumour cell lines
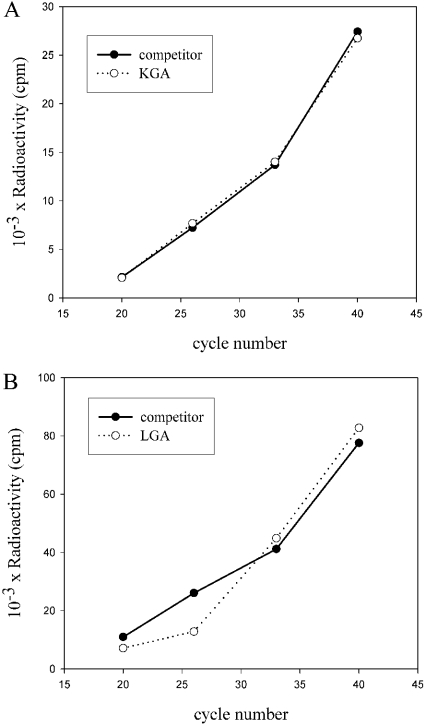
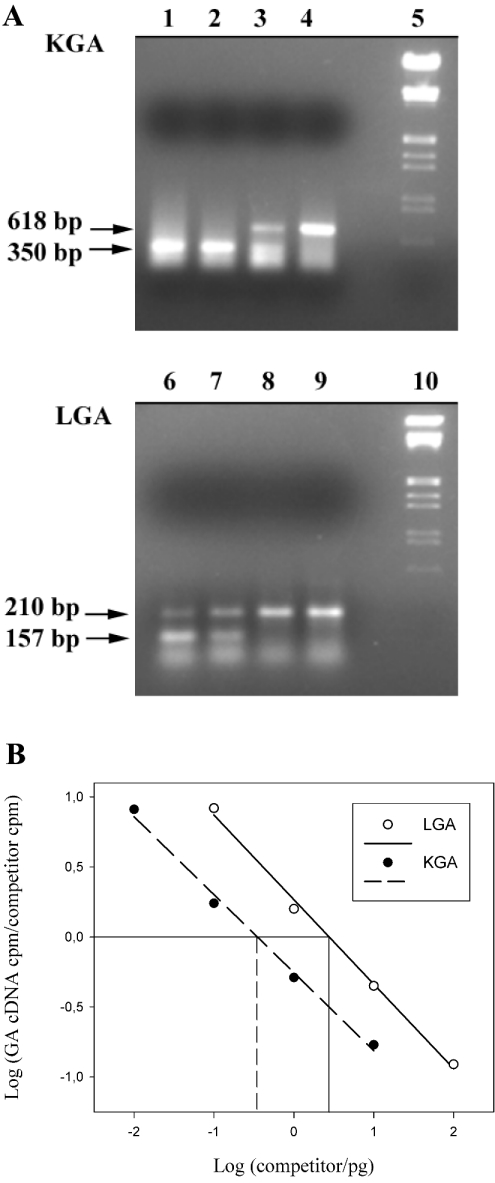
Competitive RT-PCR involves the co-amplification of a target and an exogenous control, DNA mimic or competitor. To show that their amplification efficiencies were similar, a kinetic analysis was carried out as previously described [17]. The quantification of the results indicates that the GA transcripts and competitors shared very similar amplification kinetics (Figure 3). Under competitive conditions, the absolute amount of competitor added to the reaction is equal to the amount of the respective GA transcript when the molar ratio of products becomes equal for target and competitor pairs (Figure 4). Molar equivalence occurs at approximately the point where equivalent amounts of radioactivity are incorporated into the GA transcripts and competitors. The relative amounts of target and competitors products were calculated after correcting for the difference in size between them (Figure 4B). We used this assay to study expression of GA isoforms in various tumour cell lines, as well as in MBMNCs from patients suffering from leukaemia. Competitors of the competitive RT-PCR technique were 157 and 350 bp long for LGA and KGA amplifications respectively. The ends of the fragments were complementary to the forward and reverse GA primers employed in each case (see the Experimental section). Visualization and quantification of gels shows that the equivalent point of the target and the competitor is between two amounts of competitor. This range can be used for a second 2-fold dilution series and the determination of the equivalent point [23]. Therefore, the equivalent point is estimated by the concentration of GA competitor that generate a similar concentration of both target cDNA and competitor (Figure 4B). Relative quantification has been achieved by comparing the relative amount of the two products [24], and confirmed by titration of competitors with a constant amount of GA transcripts [17].
Figure 3. Kinetics of amplification of KGA and LGA and their competitors.
(A) KGA cDNA (0.50 pg, from medullar blood cells) and the corresponding molar amount of its competitor (0.28 pg) were added to a PCR reaction mixture, together with [α-32P]dCTP. Following 20, 26, 33 and 40 amplification cycles 10 μl of the reaction was removed and the products were resolved on a 1.5% agarose/ethidium bromide gel. Following gel electrophoresis, the bands corresponding to the KGA transcript (○) and competitor (●) were excised from the gel and the amount of radioactivity in each band was determined by scintillation counting. The amount of PCR product (as radioactivity) was plotted as a function of cycle number. (B) LGA cDNA (5 pg from medullar blood cells) and the corresponding molar amount of its competitor (3.75 pg) were added to a PCR reaction mixture, together with [α-32P]dCTP. The same procedure was carried out for the determination of the amount of the respective PCR products.
Figure 4. Titration of KGA and LGA competitors with a constant amount of KGA and LGA cDNAs.
(A) KGA and LGA cDNAs (2 μl) from medullar blood cells was added to a PCR containing 10-fold serial dilutions of the respective competitors. After 40 cycles of amplifications, 20 μl of PCR products were resolved on a 1.5% agarose/ethidium bromide gel. Lanes 1–4, 1, 0.1, 0.01 and 0.001 pg of competitor for KGA. Lanes 6–9, 10, 1, 0.1 and 0.01 pg of competitor for LGA. Lane 5 and 10, DNA-size markers. The amplified products are indicated with horizontal arrows. (B) The relative amounts of KGA or LGA and competitor products were calculated after correcting for the difference in size between them. The log of the ratios of KGA and LGA products to the respective competitor were plotted as a function of the initial amount of the respective competitor added to the PCR reaction mixture.
Using the above described RT-PCR method, a co-expression of KGA and LGA was detected in the human breast cancer cell lines MCF7 and ZR-75-1 (Table 2), as well as in the human hepatoblastoma HepG2 cell line (Figure 5). These results were unexpected, because only the KGA isoform had been previously described for HepG2 cells [25], whereas Northern and cDNA library screening supported the view of LGA as the only isoform expressed in ZR-75-1 cells [14].
Figure 5. Competitive RT-PCR for the determination of KGA and LGA isoforms in HepG2 human hepatocellular carcinoma cells.
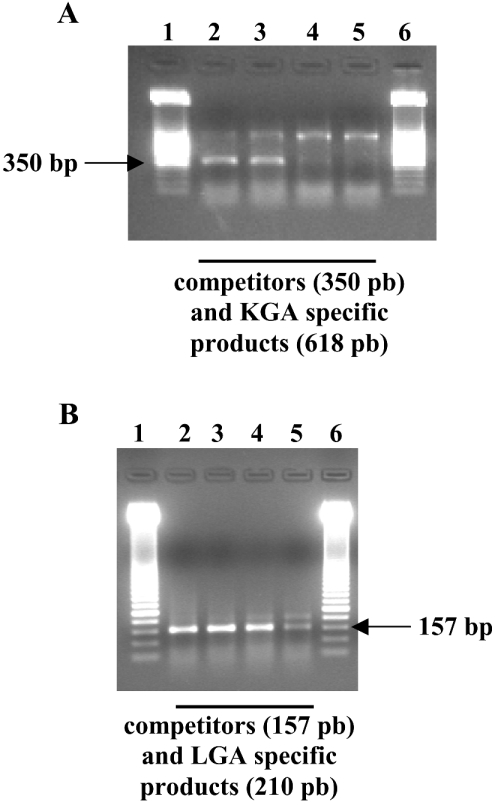
Representative gels are shown in this Figure; horizontal arrows point to amplified competitors. (A) Quantification of KGA isoenzyme. Lanes 1 and 6, 50-bp ladder molecular-mass marker. Lanes 2–5: co-amplification of KGA (618 bp, upper band) with 500, 100, 10 and 1 fg of KGA competitor respectively (350 bp, lower band). KGA amount in this experiment was located between 10 and 100 fg. (B) Quantification of LGA isoenzyme. Lanes 1 and 6: 50-bp ladder molecular-mass marker. Lanes 2–5: co-amplification of LGA (210 bp, upper band) with 500, 100, 5 and 1 pg of LGA competitor respectively (157 bp, lower band). LGA amount in this experiment was approx. 1 pg.
Finally, we used the competitive RT-PCR technique to quantify the isoform-specific expression of GA in various human cancer cells. Similar levels of KGA mRNA were found for MCF7, ZR-75-1 and HepG2 cells, whereas larger amounts were always found for LGA isoform, particularly in HepG2 cells which displayed a 20-fold higher concentration of LGA than KGA (Table 2). Medullar blood from 10 patients suffering from lymphoblastic leukaemia was analysed by this competitive RT-PCR method: in all experiments, the level of LGA mRNA was consistently higher (about 10-fold) than that of KGA (Table 2). These RNA samples from MBMNCs exhibited a similar level of LGA isoform to breast cancer cell lines, but a 10-fold lower expression than human hepatoblastoma HepG2 cells (Table 2).
Immunoblot and kinetic analyses of GA isoform expression in human cancer cell lines
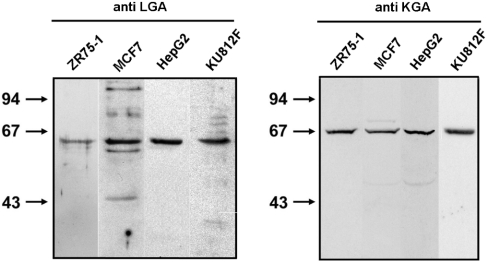
In order to complete the molecular portrait of GA expression, the study was extended to include immunoblot analysis of several human cancer cell lines to assess isoform expression at the protein level. In Figure 6 (right-hand panel) a clear polypeptide band of about 68 kDa was seen, which confirms that KGA protein is present in HepG2, MCF7, ZR-75-1 and KU812F cells. The same cells were probed with anti-LGA antibodies and a reactive polypeptide of about 63 kDa was detected (Figure 6, left-hand panel), which shows that a LGA protein is, indeed, expressed. The antibodies used to detect both GA polypeptides were isoform-specific and have been previously validated for Western blotting and immunocytochemistry [21,22].
Figure 6. Immunoblot analysis of human tumour cells.
Samples (30 μg of protein) were subjected to SDS/PAGE, transferred on to nitrocellulose, and immunostained using isoform-specific anti-GA antibodies. Isolated mitochondria or cellular extracts were probed with isoform-specific anti-LGA antibodies (left-hand panel) or anti-KGA antibodies (right-hand panel). The arrows indicate the positions of the molecular-mass markers (kDa). For LGA panel only mitochondrial extracts were used, except for KU812F cells. For KGA panel whole cellular extracts are shown.
Finally, once we had demonstrated that both mRNA and protein of KGA and LGA isoforms are expressed in these human tumour cells, the kinetic characteristics of the GA isoforms present in breast cancer cell lines were determined, in an attempt to elucidate the extent that each species was contributing to the total GA catalytic activity. It is well known that both isoenzymes differ in their kinetic properties, mainly in the effects of glutamate and inorganic phosphate as effectors: the KGA isoform is inhibited by glutamate and strongly activated by phosphate, whereas LGA shows no inhibition by the product of reaction and a considerably lower degree of phosphate dependence [10]. Although the kinetic properties of the human breast tumour cell LGA have not yet been characterized, it shares more than 95% identity in protein sequence with the rat liver LGA isoform. This last enzyme has proven to be insensitive to glutamate inhibition and, for this reason, we assume that breast cell LGA is not inhibited by glutamate.
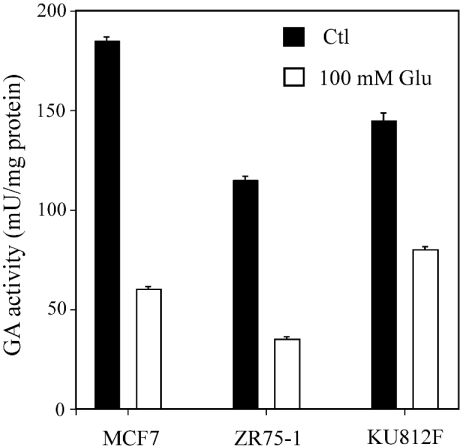
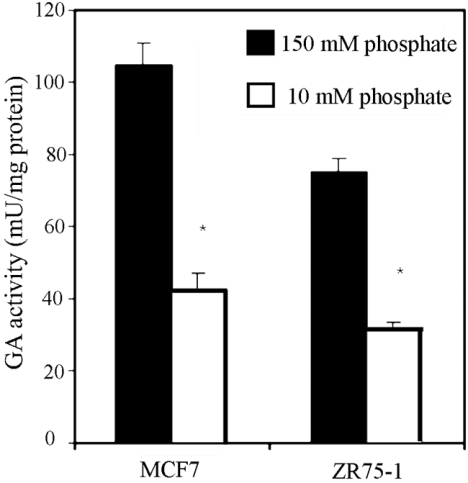
In Figure 7, the glutamate inhibition pattern is shown. In ZR-75-1 and MCF7 breast cancer cells the GA activity decreased by 70–80% in the presence of glutamate. However, in KU812F human myeloid leukaemia cells the decrease was less severe, accounting for about 50% of total GA activity. The phosphate dependence of GA activity in breast cancer cells is shown in Figure 8; a decrease of approx. 60% was seen when the phosphate concentration was lowered from 150 mM to 10 mM in both MCF7 and ZR-75-1 cells.
Figure 7. Effect of glutamate on GA activity in human tumour cells.
GA activity was measured by following the ammonia produced with the o-phthalaldehyde reagent, as detailed in the Experimental section, in the presence or absence of 100 mM glutamate. Values are given as μmol of ammonium/min per mg of total protein. The results are expressed as the means±S.E.M. for at least three different experiments. *P<0.01, as tested with the Mann–Whitney U test.
Figure 8. Effect of inorganic phosphate on GA activity in human tumour cells.
GA activity in MCF7 and ZR75-1 breast cancer cells was measured, as described in the Experimental section, at two phosphate concentrations: 10 mM and 150 mM. The results are presented as μmol of ammonium/min per mg of total protein and are expressed as the means±S.E.M. for three separate determinations. *P<0.01, as tested with the Mann–Whitney U test.
DISCUSSION
Although the importance of GA in cancer has been largely recognized, few studies have been done on expression of this enzyme in tumours. In this work, the molecular portrait of GA isoform expression in leukaemia cells from human patients and in several human cancer cell lines has been characterized at both transcriptional and translational levels. We use both cancer cell lines and medullar blood from patients with leukaemia as source of tumour cells. The use of cell lines has the great advantage of providing reproducible controls to test the sensitivity of the RT-PCR assays during studies of patient samples. Competitive RT-PCR has been also previously applied to the quantification of GA mRNA in enterocytes [26] and in colonic mucosa [24]. In our study, the HepG2 hepatoblastoma cell line showed the largest differential expression of GA isoforms at the transcriptional level, with a 20-fold higher concentration of LGA mRNA than KGA. Nevertheless, this difference was not seen at the protein level; Western blot analysis indicated a strong signal for KGA protein in cell extracts, whereas the LGA polypeptide was only detected in mitochondrial extracts. Assuming that KGA and LGA isoforms expressed by HepG2 cells have a kinetic behaviour similar to standard K-type and L-type isoenzymes, the glutamate inhibition and phosphate dependence of GA activity support the view that KGA protein, and not LGA, is mainly responsible for GA activity in these cells. The lack of correlation between levels of mRNA and protein for LGA in some cell types suggests the existence of post-transcriptional and/or post-translational mechanisms of regulation.
HepG2 cells were previously classified as expressing only the KGA isoenzyme, on the basis of kinetic data from glutamate inhibition [25]. The following lines of evidence should be taken into account to deduce conclusions for hepatocellular transformation: (i) rat hepatoma cells express the kidney-type KGA [3,27,28]; (ii) fetal hepatocytes express the KGA isoform and shortly after the child is born there is a loss of expression of KGA, whereas LGA becomes turned on [10]; (iii) normal nonproliferating hepatocytes express the LGA isoenzyme [29]; and (iv) human hepatoma cells, similar to HepG2, express both isoforms, although KGA seems to account for most of GA activity. Therefore, it is tempting to speculate that the process of malignant transformation shifts the pattern of GA expression in such way that KGA isoenzyme becomes up-regulated; in other words, transformed liver cells, like HepG2, return to a fetal-like phenotype, characterized by a higher rate of cell proliferation and prevalence of KGA expression. Our results confirm and extend previous data from Bode and Souba [25] on HepG2 cells: these authors also found changes in glutamine transport and metabolism related to cell proliferation status.
Recent studies have been carried out to measure the relative levels of alternative transcripts of other target genes involved in haematological malignancies [30]. In the present work, we demonstrate that KGA and LGA mRNAs are expressed in MBMNCs from patients suffering from leukaemia; precursor malignant blast cells showed 10-fold higher LGA than KGA mRNA levels. Western blot analysis for the KU812F human myeloid cells displayed a good expression level of both KGA and LGA proteins. However, cells from a patient suffering from medullar aplasia did not exhibit KGA expression. Medullar aplasia is a haematological disease characterized by medullar dysfunction that results in a marked decrease of various haematological cellular precursor elements and a low proliferation status [31]. In the sample of medullar blood analysed, mature non-proliferating lymphocytes were the predominant population and, surprisingly, the level of KGA transcript was not detected; in parallel, there was a sharp increase of LGA mRNA (Table 2). The expression of LGA alone is consistent with the pattern observed in liver-derived cells and supports the view of KGA being down-regulated, whereas LGA is over-expressed, in differentiated and non-proliferating cells. Accordingly, the expression of rat lymphocyte KGA mRNA was greatly increased (approx. 4-fold) after mitogenic challenge induced by endotoxin [32]: again, stimulation of proliferation induced KGA expression. Very recently, Castell et al. [33] have demonstrated LGA protein expression in human PMNs (polymorphonuclear neutrophils). Interestingly, a large increase in the amount of LGA protein on the cell surface occurs after stimulation with PMA, a differentiation agent. Therefore, a secretion stimulus unrelated with proliferation-induced LGA expression resulted in release of GA into cell culture media [33].
The levels of LGA mRNA were higher than those of KGA in breast cancer cells. The relatively low level of KGA mRNA in these cells may explain why we were unable to detect its presence by less sensitive techniques, such as Northern blotting or library screening, using a rat kidney KGA cDNA probe [14]. Despite the relative abundance of both GA transcripts, the results of Western blotting and enzymic measurements suggest that KGA isoform would represent the larger fraction of total GA activity. These results agreed with those previously reported by Turner and McGivan [16]. These authors [16] also show that LGA mRNA was consistently higher in slow-growing adenomas than in rapidly proliferating carcinomas; unfortunately, the lack of isoform-specific antibodies means that the authors could not obtain clear-cut conclusions at the protein level. Final evidence supporting the view of KGA being related to proliferation status is based on our previous results with antisense mRNA inhibition of KGA expression [6]. We were able to reverse the transformed phenotype of Ehrlich ascites tumour cells after inhibition of KGA expression by using an antisense rat KGA cDNA [6]. In addition, transfected cells lose their tumorigenic capacity in vivo and were unable to grow in the peritoneal cavity of mice [7]. Hence, KGA would be a rational target for the design of antitumour therapeutical approaches.
In conclusion, the evidence obtained support a novel and consistent pattern showing co-expression of KGA and LGA isoforms in many types of human cancer cells at the transcriptome and proteome levels. Although it is unknown what the selective advantages, if any, this pattern of GA expression may confer to tumour cells, the new functions [34] and subcellular locations [22,33] recently discovered for LGA in mammals may help to understand the physiological meaning and molecular mechanisms involved. Furthermore, and in addition to co-expression, a pattern can be inferred from the tumour cells investigated here and from previous data [27–29,33]. KGA expression is up-regulated in parallel with the rate of proliferation, whereas prevalence of LGA expression can be associated with low proliferation rates and seems to be a characteristic exhibited by resting or quiescent cells. In the near future, it will be interesting to extend these studies on GA expression to other human tumours, which might offer an interesting marker for tumour proliferation in certain types of cancer.
Acknowledgments
We thank C. Lobo and B. Fernández-Molina for valuable help during the course of this work. C.P.-G. was a predoctoral fellow from the Ministry of Education of Spain. This work was supported by grant SAF 2001-1894 from the Ministry of Ciencia y Tecnología of Spain and by a Coordinated Project CVI-179 of Junta de Andalucía, Spain.
References
- 1.Medina M. A., Sánchez-Jiménez F., Márquez J., Rodríguez-Quesada A., Núñez de Castro I. Relevance of glutamine metabolism to tumor cell growth. Mol. Cell. Biochem. 1992;113:1–15. doi: 10.1007/BF00230880. [DOI] [PubMed] [Google Scholar]
- 2.Kovacevic Z., McGivan J. D. Mitochondrial metabolism of glutamine and glutamate and its physiological significance. Physiol. Rev. 1983;63:547–605. doi: 10.1152/physrev.1983.63.2.547. [DOI] [PubMed] [Google Scholar]
- 3.Souba W. W. Glutamine and cancer. Ann. Surg. 1993;218:715–728. doi: 10.1097/00000658-199312000-00004. [DOI] [PMC free article] [PubMed] [Google Scholar]
- 4.Aledo J. C., Segura J. A., Medina M. A., Alonso F. J., Nuñez de Castro I., Márquez J. Phosphate-activated glutaminase expression during tumor development. FEBS Lett. 1994;341:39–42. doi: 10.1016/0014-5793(94)80236-x. [DOI] [PubMed] [Google Scholar]
- 5.Matsuno T., Goto I. Glutaminase and glutamine synthetase activities in human cirrhotic liver and hepatocellular carcinoma. Cancer Res. 1992;52:1192–1194. [PubMed] [Google Scholar]
- 6.Lobo C., Ruiz B. M. A., Aledo J. C., Márquez J., Núñez de Castro I., Alonso F. J. Inhibition of glutaminase expression by antisense mRNA decreases growth and tumorigenicity of tumour cells. Biochem. J. 2000;348:257–261. [PMC free article] [PubMed] [Google Scholar]
- 7.Segura J. A., Ruiz-Bellido M. A., Arenas M., Lobo C., Márquez J., Alonso F. J. Ehrlich ascites tumor cells expressing anti-sense glutaminase mRNA lose their capacity to evade the mouse immune system. Int. J. Cancer. 2001;91:379–384. doi: 10.1002/1097-0215(200002)9999:9999<::aid-ijc1046>3.3.co;2-c. [DOI] [PubMed] [Google Scholar]
- 8.Aledo J. C., Gómez-Fabre P. M., Olalla L., Márquez J. Identification of two human glutaminase loci and tissue-specific expression of the two related genes. Mammal. Genome. 2000;11:1107–1110. doi: 10.1007/s003350010190. [DOI] [PubMed] [Google Scholar]
- 9.Shapiro R. A., Farrell L., Srinivasan M., Curthoys N. P. Isolation, characterization, and in vitro expression of a cDNA that encodes the kidney isoenzyme of the mitochondrial glutaminase. J. Biol. Chem. 1991;266:18792–18796. [PubMed] [Google Scholar]
- 10.Curthoys N. P., Watford M. Regulation of glutaminase activity and glutamine metabolism. Annu. Rev. Nutr. 1995;15:133–159. doi: 10.1146/annurev.nu.15.070195.001025. [DOI] [PubMed] [Google Scholar]
- 11.Porter L. D., Ibrahim H., Taylor L., Curthoys N. P. Complexity and species variation of the kidney-type glutaminase gene. Physiol. Genomics. 2002;9:157–166. doi: 10.1152/physiolgenomics.00017.2002. [DOI] [PubMed] [Google Scholar]
- 12.Elgadi K. M., Meguid R. A., Qian M., Souba W. W., Abcouwer S. F. Cloning and analysis of unique human glutaminase isoforms generated by tissue-specific alternative splicing. Physiol. Genomics. 1999;1:51–62. doi: 10.1152/physiolgenomics.1999.1.2.51. [DOI] [PubMed] [Google Scholar]
- 13.Watford M. Hepatic glutaminase expression: relationship to kidney-type glutaminase and to the urea cycle. FASEB J. 1993;7:1468–1474. doi: 10.1096/fasebj.7.15.8262331. [DOI] [PubMed] [Google Scholar]
- 14.Gómez-Fabre P. M., Aledo J. C., del Castillo-Olivares A., Alonso F. J., Nuñez de Castro I., Campos J. A., Márquez J. Molecular cloning, sequencing and expression studies of the human breast cancer cell glutaminase. Biochem. J. 2000;345:365–375. [PMC free article] [PubMed] [Google Scholar]
- 15.Pérez-Gómez C., Matés J. M., Gómez-Fabre P. M., del Castillo-Olivares A., Alonso F. J., Márquez J. Genomic organization and transcriptional analysis of the human L-glutaminase gene. Biochem. J. 2003;370:771–784. doi: 10.1042/BJ20021445. [DOI] [PMC free article] [PubMed] [Google Scholar]
- 16.Turner A., McGivan J. D. Glutaminase isoform expression in cell lines derived from human colorectal adenomas and carcinomas. Biochem. J. 2003;370:403–408. doi: 10.1042/BJ20021360. [DOI] [PMC free article] [PubMed] [Google Scholar]
- 17.Serra D., Bellido D., Asins G., Arias G., Vilaró S., Hegardt F. G. The expression of mitochondrial 3-hydroxy-3-methylglutaryl-coenzyme-A synthase in neonatal rat intestine and liver is under transcriptional control. Eur. J. Biochem. 1996;237:16–24. doi: 10.1111/j.1432-1033.1996.0016n.x. [DOI] [PubMed] [Google Scholar]
- 18.Celi F. S., Zenilman M. E., Shuldiner A. R. A rapid and versatile method to synthesize internal standards for competitive PCR. Nucleic Acids Res. 1993;21:1047. doi: 10.1093/nar/21.4.1047. [DOI] [PMC free article] [PubMed] [Google Scholar]
- 19.Markwell M. A., Haas S. M., Tolbert N. E., Bieber L. L. Protein determination in membrane and lipoprotein samples: manual and automated procedures. Methods Enzymol. 1981;72:296–303. doi: 10.1016/s0076-6879(81)72018-4. [DOI] [PubMed] [Google Scholar]
- 20.Heini H. G., Gebhardt R., Brecht A., Mecke D. Purification and characterization of rat liver glutaminase. Eur. J. Biochem. 1987;162:541–546. doi: 10.1111/j.1432-1033.1987.tb10673.x. [DOI] [PubMed] [Google Scholar]
- 21.Campos J. A., Aledo J. C., Segura J. A., Alonso F. J., Gómez-Fabre P. M., Núñez de Castro I., Márquez J. Expression of recombinant human L-glutaminase in Escherichia coli: polyclonal antibodies production and immunological analysis of mouse tissues. Biochim. Biophys. Acta. 2003;1648:17–23. doi: 10.1016/s1570-9639(03)00026-8. [DOI] [PubMed] [Google Scholar]
- 22.Olalla L., Gutierrez A., Campos J. A., Khan Z. U., Alonso F. J., Segura J. A., Márquez J., Aledo J. C. Nuclear localization of L-type glutaminase in mammalian brain. J. Biol. Chem. 2002;277:38939–38944. doi: 10.1074/jbc.C200373200. [DOI] [PubMed] [Google Scholar]
- 23.Kong S. E., Heel K. A., Hall J. C., McCauley R. D. Quantitation of glutaminase mRNA in enterocytes using competitive RT-PCR. Mol. Cell. Probes. 1998;12:339–341. doi: 10.1006/mcpr.1998.0183. [DOI] [PubMed] [Google Scholar]
- 24.Cherbuy C., Andrieux C., Honvo-Houeto E., Thomas M., Ide C., Druesne N., Chaumontet C., Darcy-Vrillon B., Duee P. H. Expression of mitochondrial HMGCoA synthase and glutaminase in the colonic mucosa is modulated by bacterial species. Eur. J. Biochem. 2004;271:87–95. doi: 10.1046/j.1432-1033.2003.03908.x. [DOI] [PubMed] [Google Scholar]
- 25.Bode B. P., Souba W. W. Modulation of cellular proliferation alters glutamine transport and metabolism in human hepatoma cells. Ann. Surg. 1994;220:411–422. doi: 10.1097/00000658-199410000-00001. [DOI] [PMC free article] [PubMed] [Google Scholar]
- 26.Kong S. E., Hall J. C., Cooper D., McCauley R. D. Glutamine-enriched parenteral nutrition regulates the activity and expression of intestinal glutaminase. Biochim. Biophys. Acta. 2000;1475:67–75. doi: 10.1016/s0304-4165(00)00049-0. [DOI] [PubMed] [Google Scholar]
- 27.Linder-Horowitz M., Knox W. E., Morris H. P. Glutaminase activities and growth rates of hepatomes. Cancer Res. 1969;29:1195–1199. [PubMed] [Google Scholar]
- 28.Perera S. Y., Voith D. M., Curthoys N. P. Biosynthesis and processing of mitochondrial glutaminase in HTC hepatoma cells. Biochem. J. 1991;273:265–270. doi: 10.1042/bj2730265. [DOI] [PMC free article] [PubMed] [Google Scholar]
- 29.Watford M., Smith E. M. Distribution of hepatic glutaminase activity and mRNA in perivenous and periportal rat hepatocytes. Biochem. J. 1990;267:265–267. doi: 10.1042/bj2670265. [DOI] [PMC free article] [PubMed] [Google Scholar]
- 30.Bromidge T., Lynas C. Relative levels of alternative transcripts of the ING1 gene and lack of mutations of p33/ING1 in haematological malignancies. Leuk. Res. 2002;26:631–635. doi: 10.1016/s0145-2126(01)00185-0. [DOI] [PubMed] [Google Scholar]
- 31.Sepulveda E., Rojas-Castro J. Signs of medullar aplasia in the oral cavity: report of case. ASDC J. Dent. Child. 2001;68:70–72; 32. [PubMed] [Google Scholar]
- 32.Sarantos P., Ockert K., Souba W. W. Endotoxin stimulates lymphocyte glutaminase expression. Arch. Surg. 1993;128:920–924. doi: 10.1001/archsurg.1993.01420200094017. [DOI] [PubMed] [Google Scholar]
- 33.Castell L., Vance C., Abbott R., Márquez J., Eggleton P. Granule localization of glutaminase in human neutrophils and the consequence of glutamine utilization for neutrophil activity. J. Biol. Chem. 2004;279:13305–13310. doi: 10.1074/jbc.M309520200. [DOI] [PubMed] [Google Scholar]
- 34.Olalla L., Aledo J. C., Bannenberg G., Márquez J. The C-terminus of human glutaminase L mediates association with PDZ domain-containing proteins. FEBS Lett. 2001;488:116–122. doi: 10.1016/s0014-5793(00)02373-5. [DOI] [PubMed] [Google Scholar]


