Abstract
Normal differentiation and induced reprogramming require the activation of target cell programs and silencing of donor cell programs1,2. In reprogramming, the same factors are often used to reprogram many different donor cell types3. As most developmental repressors, such as RE1-silencing transcription factor (REST) and Groucho (also known as TLE), are considered lineage-specific repressors4,5, it remains unclear how identical combinations of transcription factors can silence so many different donor programs. Distinct lineage repressors would have to be induced in different donor cell types. Here, by studying the reprogramming of mouse fibroblasts to neurons, we found that the pan neuron-specific transcription factor Myt1-like (Myt1l)6 exerts its pro-neuronal function by direct repression of many different somatic lineage programs except the neuronal program. The repressive function of Myt1l is mediated via recruitment of a complex containing Sin3b by binding to a previously uncharacterized N-terminal domain. In agreement with its repressive function, the genomic binding sites of Myt1l are similar in neurons and fibroblasts and are preferentially in an open chromatin configuration. The Notch signalling pathway is repressed by Myt1l through silencing of several members, including Hes1. Acute knockdown of Myt1l in the developing mouse brain mimicked a Notch gain-of-function phenotype, suggesting that Myt1l allows newborn neurons to escape Notch activation during normal development. Depletion of Myt1l in primary postmitotic neurons de-repressed non-neuronal programs and impaired neuronal gene expression and function, indicating that many somatic lineage programs are actively and persistently repressed by Myt1l to maintain neuronal identity. It is now tempting to speculate that similar ‘many-but-one’ lineage repressors exist for other cell fates; such repressors, in combination with lineage-specific activators, would be prime candidates for use in reprogramming additional cell types.
The combination of Ascl1, Brn2, and Myt1l has been shown to reprogram fibroblasts and other somatic cells to induced neuronal (iN) cells7. Ascl1 acts as an “on target” pioneer factor to activate the neuronal program, whereas chromatin access of Brn2 is context-dependent and facilitates reprogramming later on8. While Ascl1 alone is sufficient to generate iN cells, endogenous Myt1l is induced during reprogramming and exogenous Myt1l greatly improves the efficiency and quality of the resulting iN cells9,10. To investigate Myt1l’s role in reprogramming we first raised an antibody specific for mouse and human Myt1l (Fig. ED1). Chromatin-immunoprecipitation followed by DNA sequencing (ChIP-Seq) of endogenous Myt1l in fetal neurons (E13.5) and ectopic Myt1l in mouse embryonic fibroblasts (MEFs) two days after induction identified 3325 high-confidence Myt1l peaks that overlapped remarkably well between neurons and MEFs (Fig. 1a, ED2, Table S1). Thus, similar to the pioneer factor Ascl1, Myt1l can access the majority of its cognate DNA binding sites even in a distantly related cell type. However, unlike Ascl1 targets8, the chromatin at Myt1l targets is preferentially open (nucleosomal-free) in fibroblasts (Fig. 1b). Hence, Myt1l appears to possess no pioneer factor activity, raising the question why the targets of a neuron-specific transcription factor are easily accessible in fibroblasts. As expected, there was little overlap between Myt1l and Ascl1 target sites and the chromatin binding of Myt1l was not strongly affected by Ascl1 and Brn2, indicating that both factors bind and function independent from another (Fig. 1c, ED2d). Conversely, Brn2 targets were co-enriched for both Ascl1 and Myt1l, confirming that chromatin access of Brn2 in fibroblasts is strongly directed by other factors8 (Fig. ED2d). De novo motif discovery identified an AAGTT-motif significantly enriched in all Myt1l ChIP-seq experiments (Fig. 1d), which is similar to a previously proposed motif11,12. Remarkably, almost half of the Myt1l peaks were located in gene promoters, enabling likely association to actual target genes (Fig. 1e). Accordingly, we found histone marks associated with active promoters such as H3K27ac and H3K4me3 enriched at Myt1l bound regions in MEFs (Fig. ED2e).
Fig. 1: Context independent on target chromatin access of Myt1l.
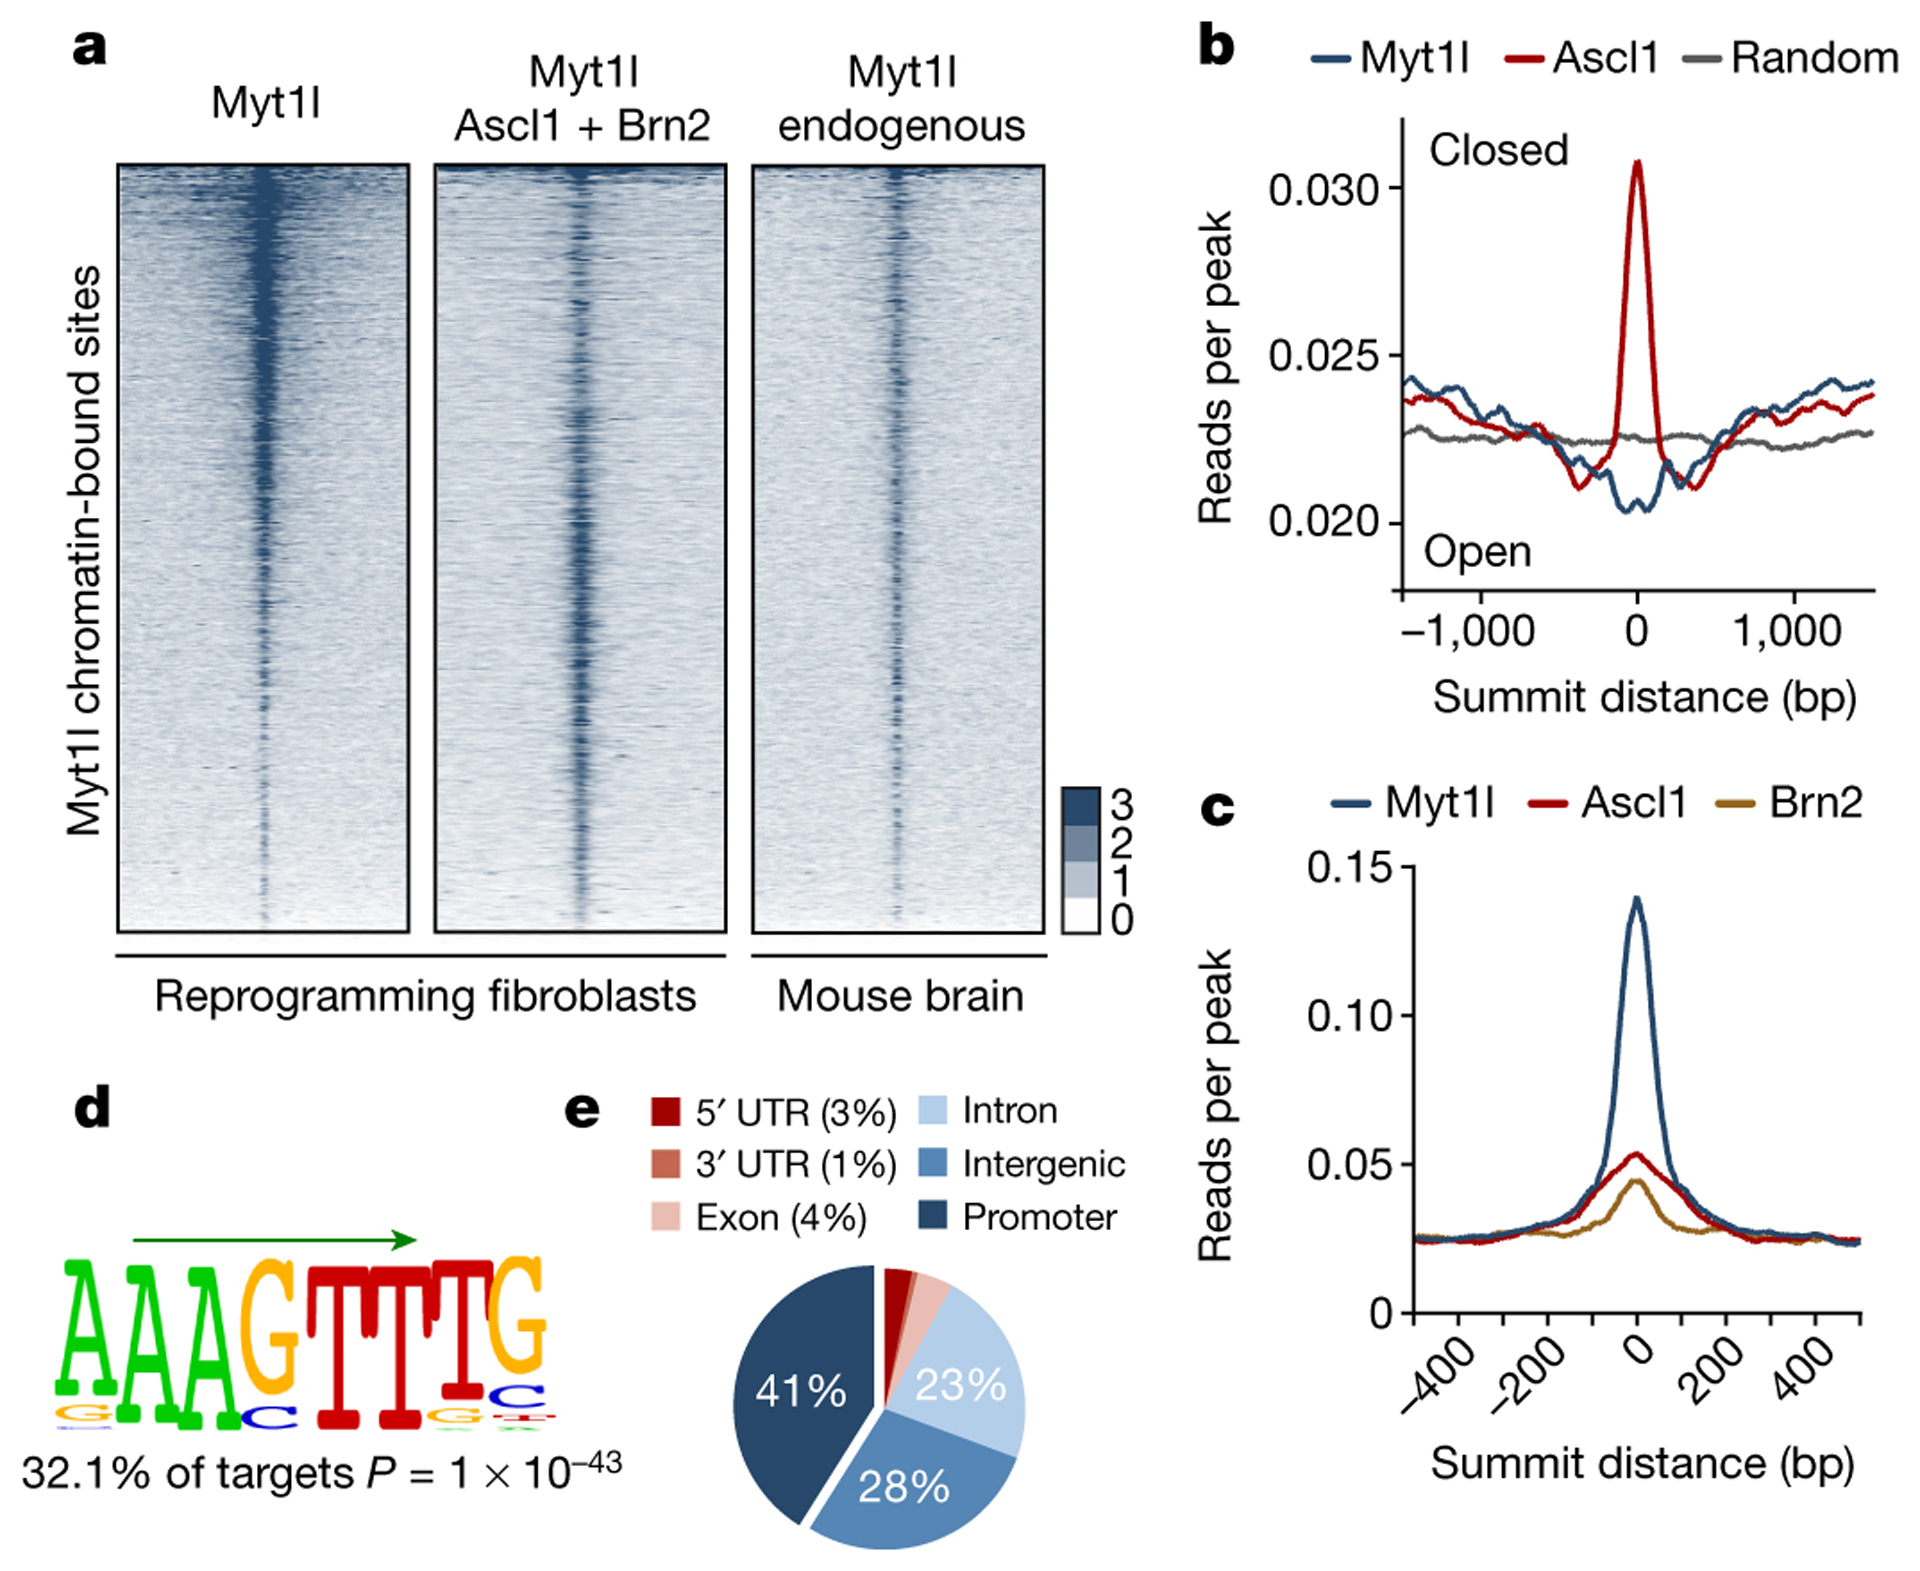
a, Genome-wide occupancy profiles of endogenous Myt1l in E13.5 mouse brains (n = 2) or overexpressed Myt1l with (n = 3) or without (n = 2) Ascl1 and Brn2 in MEFs two days after reprogramming. Corresponding regions are displayed across all data sets ± 2 kb from summits. b, Chromatin accessibility based on MNase-seq signal in MEFs25 shows binding enrichment of Myt1l in open and ASCL1 in closed regions. c, Read densities of ASCL1 and BRN2 chromatin binding8 shows minor overlap at Myt1l bound regions. d, The Myt1l AAGTT-core motif (green arrow) is significantly enriched at bound sites across data sets. P-value reported, E-value is 9.6e-3. e, Pie chart indicates enrichment of high confidence Myt1l bound sites at gene promoters.
We next assessed the transcriptional effects of Myt1l by RNA sequencing (RNA-Seq)8 (Fig. 2a, ED3, Table S2). On average, Myt1l targets were significantly down regulated in reprogramming fibroblasts, indicating Myt1l may be a transcriptional repressor and functions to silence the fibroblast program during reprogramming. Indeed, gene set enrichment analysis (GSEA) showed a significant enrichment of MEF signature genes among the repressed Myt1l target genes (Fig. 2b, Table S3). To functionally evaluate whether repressive or activating properties of Myt1l drive iN cell reprogramming, we fused activating (VP64) or repressing (engrailed repressor; EnR) domains to a putative DNA-binding fragment of Myt1l (410–623). While the VP64-Myt1l fusion had a strong dominant-negative effect on Ascl1-mediated neuronal conversion, the EnR-fusion significantly increased induction of TUJ1 and TauEGFP-positive cells compared to the inactive Myt1l fragment (410–623) (Fig. 2d–e). Thus, transcriptional repression is the predominant function of Myt1l during neuronal reprogramming.
Fig. 2: Myt1l target gene repression dominates induced neurogenesis.
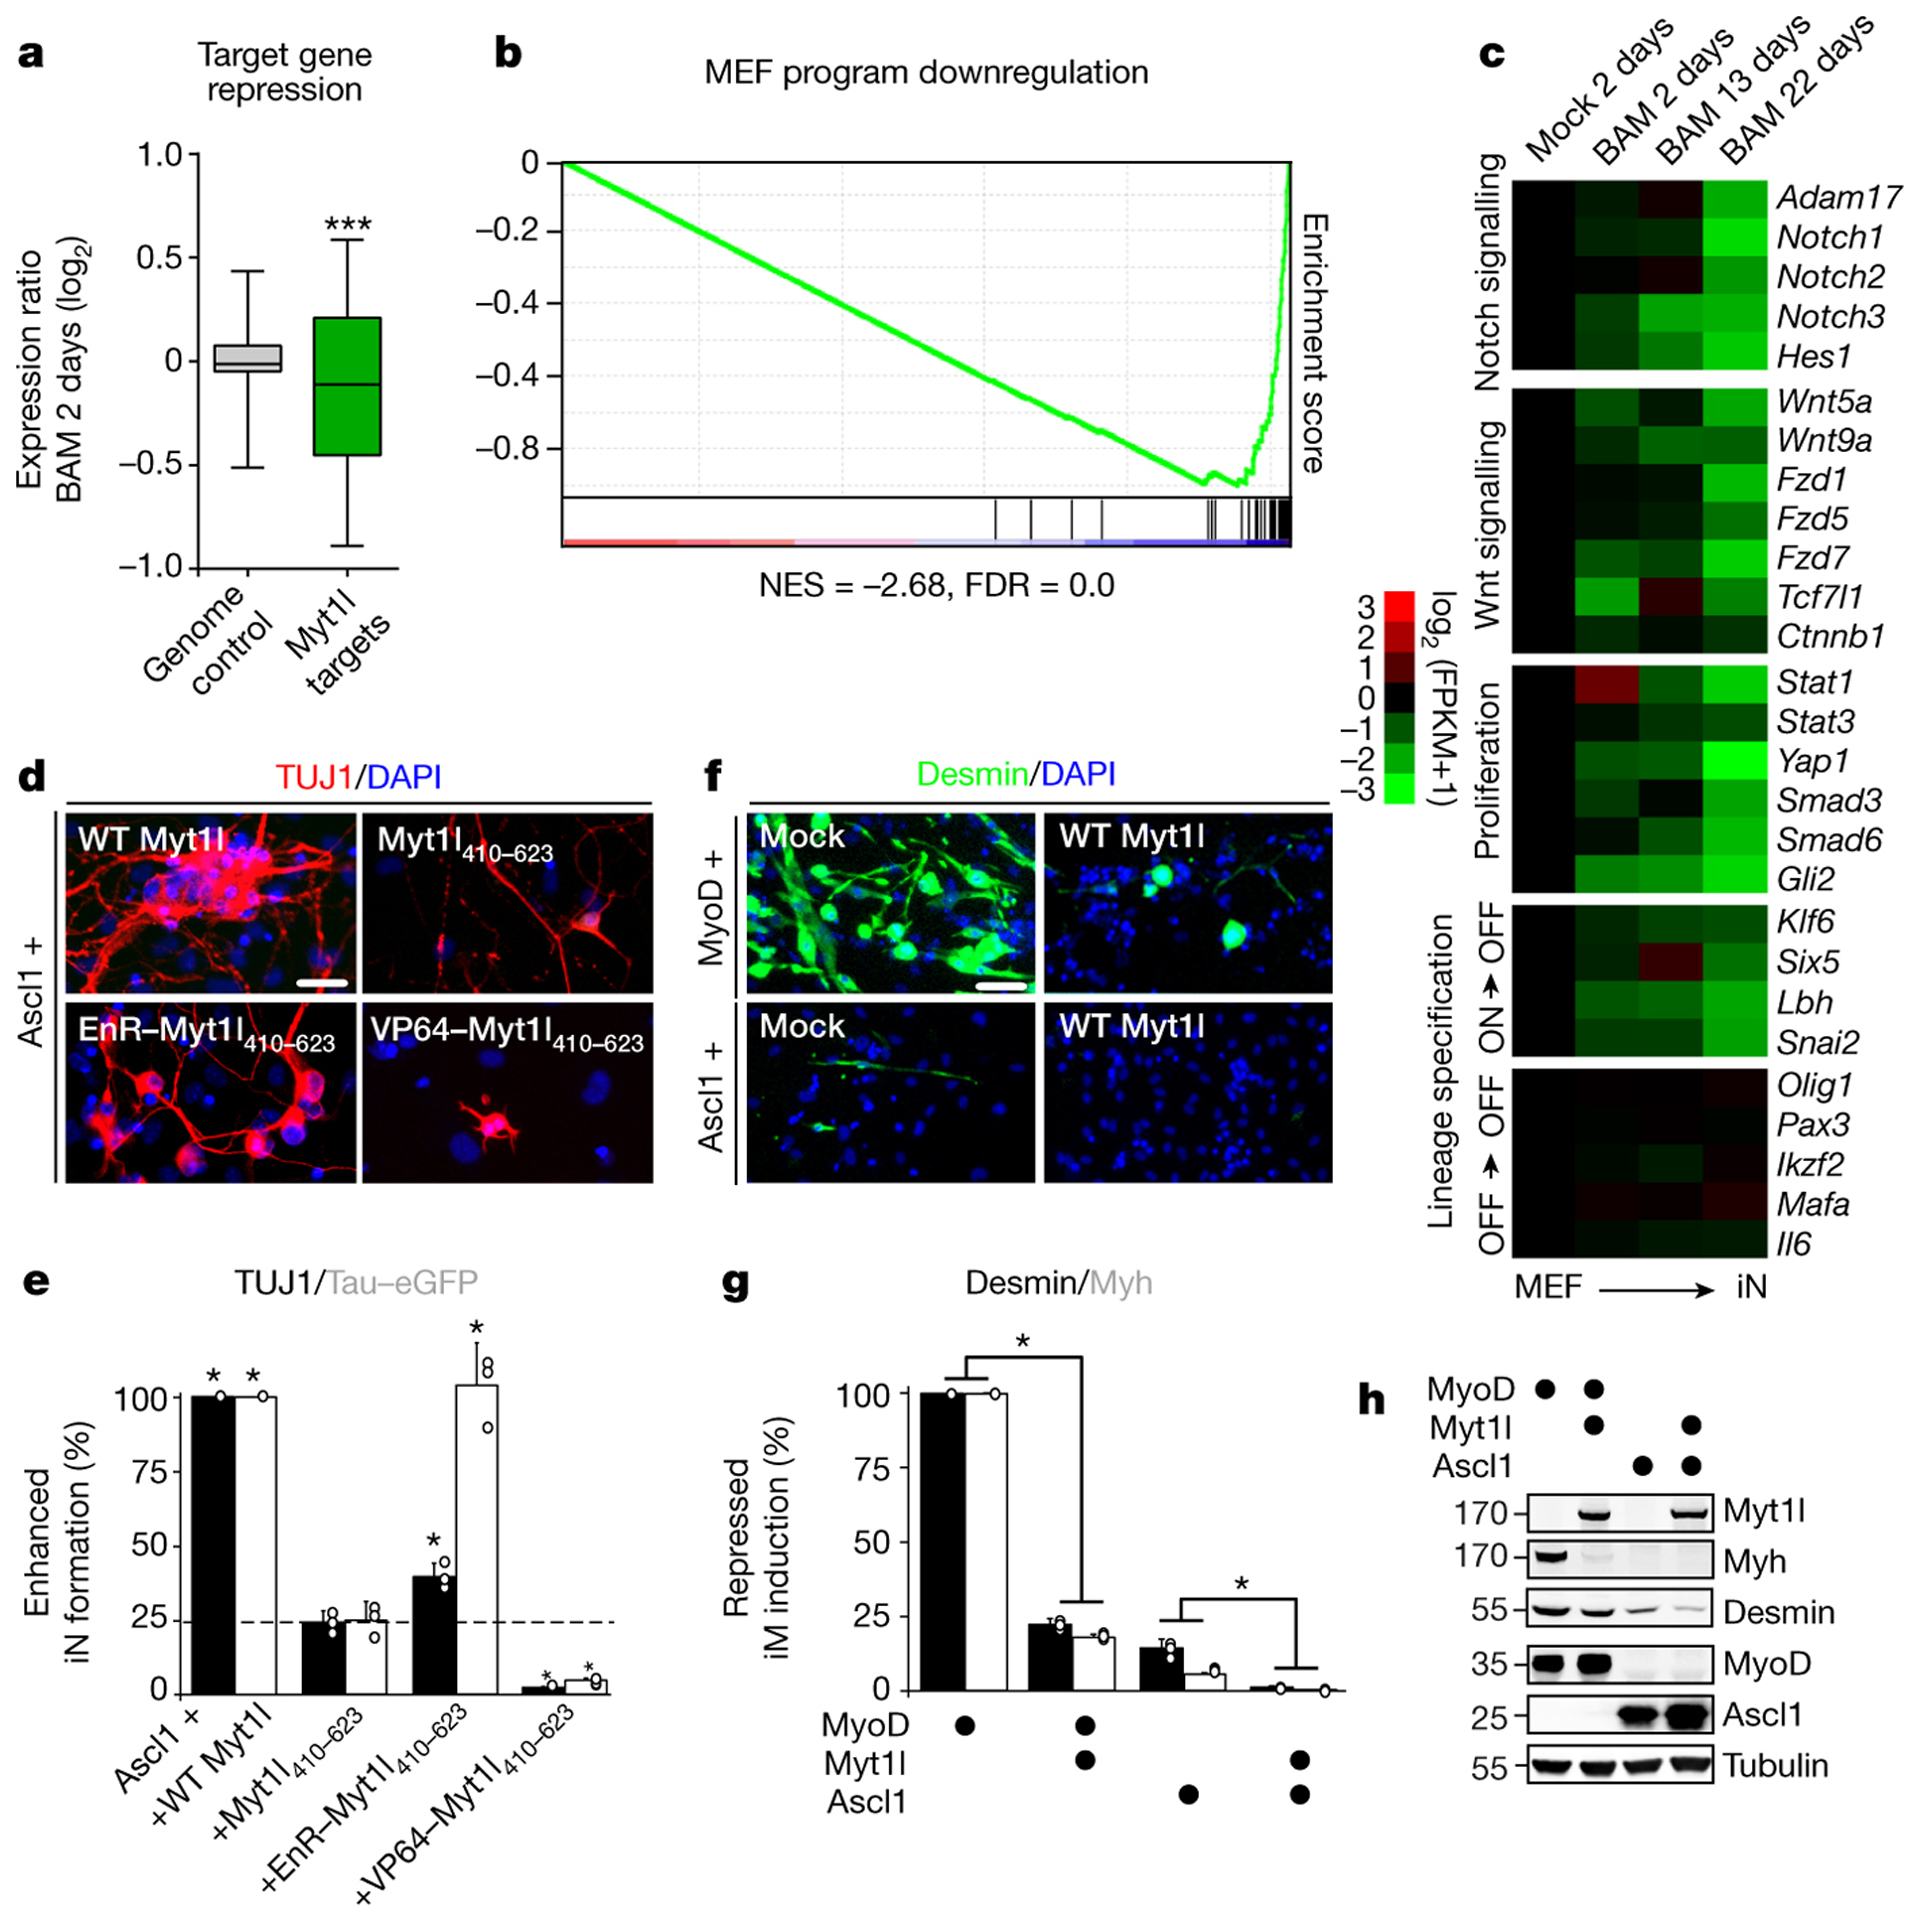
a, Repression of promoter bound (TSS −5,+2kb) Myt1l targets (n = 1798) dominates genome wide expression changes (n = 33459) upon two days of reprogramming (p = 2.78×10⁻¹²), two biological replicates each8. b, GSEA identified MEF signature among repressed Myt1l targets. Normalised enrichment score (NES) and false discovery rate (FDR). c, RNA-seq expression values of selected Myt1l targets at indicated time points during reprogramming, normalised to the mock sample, n = 28. Myt1l represses several Notch, Wnt, and proliferation factors. Many lineage specifiers are bound and repressed (ON->OFF) or remain repressed (OFF->OFF). d, Immunofluorescence of iN cells derived from MEFs upon reprogramming for 14 days with Ascl1 and Myt1l wt or a non-functional zinc finger fragment fused to a repressor (EnR) and activator (VP64); TUJ1 (red), DAPI staining (blue). e, Conversion efficiency of cells shown in D based on TUJ1-positive cells with neuronal morphology (black) or TauEGFP expression (grey) show partial reprogramming using repressor fusion, with many TauEGFP-positive cells without neuronal morphologies. f, Immunofluorescence of MEFs upon reprogramming for 14 days with Ascl1 or MyoD without (mock) or with Myt1l wt; DESMIN (green), DAPI staining (blue). g, Induced muscle (iM) conversion efficiency of cells shown in F based on either DESMIN (black) or MYH expression (grey) show decreased muscle marker-positive cells upon Myt1l wt addition. h, Western blot analysis of cells shown in F after two days of reprogramming using indicated antibodies (gel source data Fig. S1). d-g, Scale bar 50 μm, n = 3, error bars = SD, t-test * p < 0.05.
We then asked, whether Myt1l’s role might go beyond repressing the fibroblast identity. Indeed, we found many Myt1l target genes with prominent non-neuronal developmental roles and most were down-regulated or remained silent during reprogramming (Fig. 2c). Among the repressed targets were negative regulators of neurogenesis (Notch & Wnt pathway members, as well as Id3), key effectors of proliferation (like Jak/Stat, Hippo, TGF, and Shh signaling), and transcriptional regulators of several non-neuronal lineages. Strikingly, GO analysis of Myt1l repressed targets enriched terms associated with several non-neuronal processes (such as cartilage, heart and lung development), suggesting that Myt1l is able to repress not only the fibroblast program but also additional non-neuronal programs (Fig. ED3e). Indeed, we found the gene expression signatures of MEFs, myocytes, hepatocytes, and keratinocytes but not the neuronal to be strongly associated (odds ratio > 2) with repressed Myt1l target genes (Fig. ED3d, Table S3). In addition, Myt1l strongly inhibited the formation of myocytes when overexpressed in primary myoblasts during differentiation or together with MyoD in fibroblasts (Fig. 2f–h, ED4). These data suggest that the main physiological function of Myt1l is to repress many non-neuronal programs in neurons.
Next, we explored how Myt1l accomplishes transcriptional repression. To identify critical domains of Myt1l we tested a collection of systematic Myt1l truncations in our iN reprogramming assay (Fig. 3a, Table S4). After ensuring nuclear localisation and protein stability our studies revealed that a short, 423 amino acid-long fragment was sufficient to generate mouse and human iN cells molecularly and functionally indistinguishable from full length Myt1l (Fig. 3a–d, Fig. ED5–6). This Myt1l 200–623 fragment contained a previously uncharacterised N-terminal domain and two zinc fingers (ZF 2–3), presumably responsible for DNA interaction. Surprisingly, the conserved MYT1 domain was dispensable for reprogramming and only one of the three putative DNA-binding zinc finger domain clusters was required. The presence of three zinc finger clusters could imply a complex DNA interaction with multiple DNA sites simultaneously bound by different areas of the protein. However, mutating the central zinc finger cluster to abolish sequence specific DNA-binding had no effect on Myt1l function13 (Fig. 3a, ED7). In a fragment devoid of additional zinc fingers the same mutations completely abolished Myt1l function, suggesting that the zinc finger clusters are functionally redundant. Indeed, in vitro DNA binding studies (SELEX) revealed that zinc finger clusters 2–3 and 4–6 enriched the same AAGTT-motif and ChIP-Seq experiments showed that full length and Myt1l 200–623 bound the same genomic sites during reprogramming (Fig. 3e, ED2, Table S1,5). Thus, multiple DNA interacting zinc fingers are not required to engage DNA simultaneously but might simply increase the binding probability of Myt1l to its targets. Strikingly, down-regulated Myt1l targets harbor significantly more AAGTT-motifs compared to up-regulated targets, suggesting that indeed binding affinity affects transcriptional output (Fig. ED3a).
Fig. 3: Characterisation of neurogenic and repressive Myt1l domains.
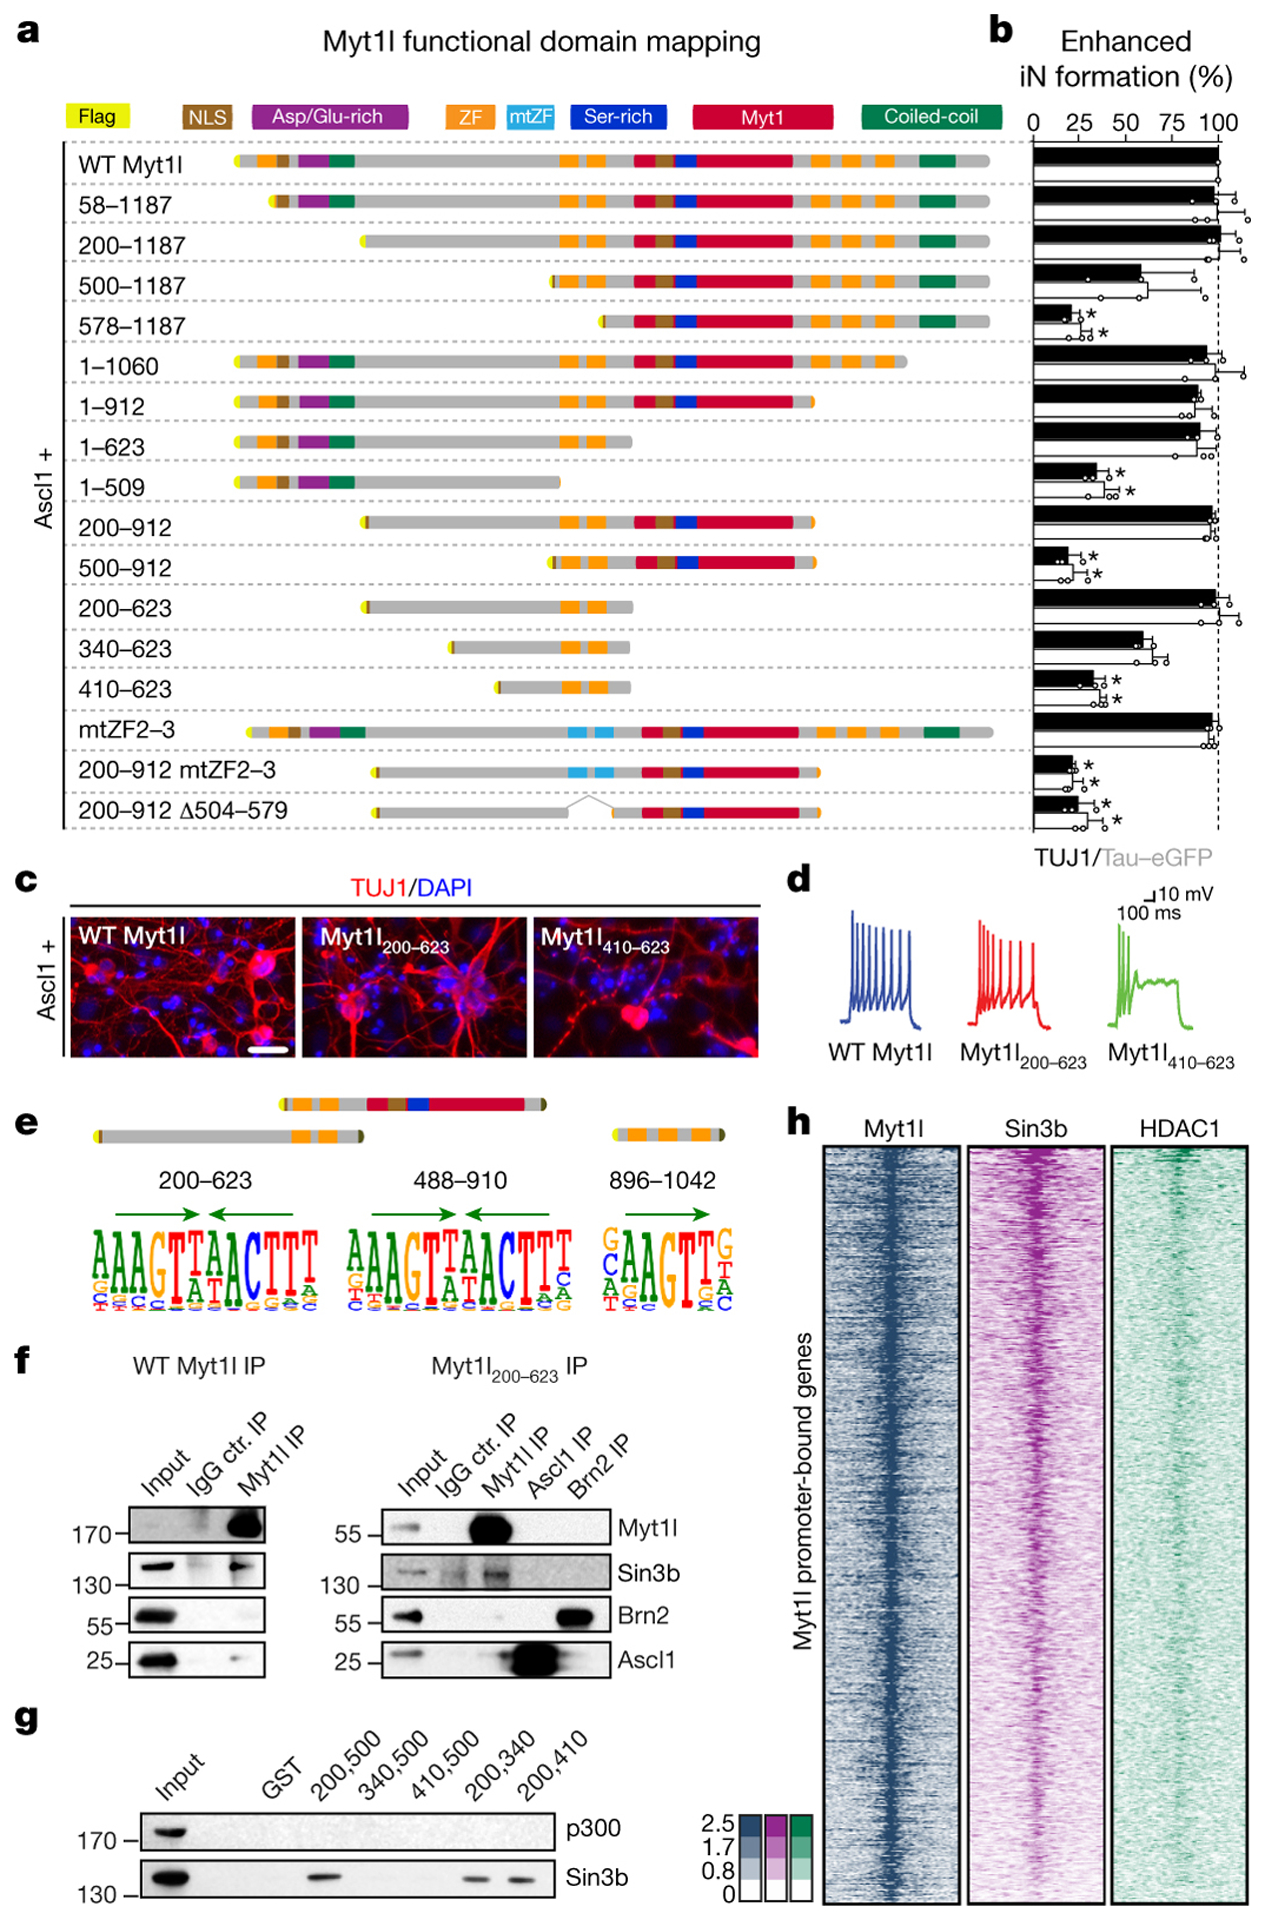
a, Truncation and mutation screen identifies Myt1l domains essential for induced neurogenesis from MEFs upon reprogramming for 14 days with Ascl1. Highlighted are nuclear localisation signals (NLS), aspartic acid/glutamic acid-rich (Asp/Glu-rich), serine-rich (Ser-rich), MYT1, coiled-coil domains, CCHC-type zinc fingers (ZF) and mutants (mtZF). b, Conversion activity compared to Myt1l wt based on number of TUJ1-positive cells with neuronal morphology (black) or TauEGFP expression (grey). n = 3, error bars = SD, t-test * p < 0.005. c, Representative immunofluorescence of iN cells in A; TUJ1 (red), DAPI staining (blue), scale bar 50 μm. d, Representative action potential (AP) traces of iN cells in A upon maturation for 21 days on mouse glia. e, SELEX DNA binding experiments of Myt1l ZF fragments enrich same Myt1l AAGTT-core motif (green arrows). f, Immunoprecipitation show binding of SIN3b to full length and minimal Myt1l in DNase-treated MEF cell lysates two days after transgene overexpression. g, GST pull down from MEF cell lysates identify minimal SIN3b interaction region within functional Myt1l domain. h, Overlapping ChIP-seq chromatin occupancy profiles of overexpressed Myt1l (left, blue), endogenous SIN3b (middle, violet) and HDAC1 (right, green) at Myt1l promoter target sites in MEFs two days after reprogramming induction. n = 2.
The N-terminal domain preceding the central zinc finger cluster was also critical for Myt1l function, because increased truncation resulted in progressive loss of reprogramming activity (Fig. 3a–d, ED5). Since Myt1 family members have been reported to interact with Sin3b to mediate gene repression we tested if Myt1l can bind this repressive chromatin remodeling complex during neuronal reprogramming14. We found that both full length and minimal Myt1l 200–623, but not Ascl1 or Brn2, could enrich Sin3b by immunoprecipitation (Fig. 3f). Sequence analysis revealed four highly conserved hydrophobic helical peptides within Myt1l 410–623 that are similar to reported Sin3 interacting domains (SID) known to bind the paired amphipathic helix (PAH) of Sin3b15 (Fig. ED8). To identify the actual SID of Myt1l we performed GST pull down experiments and found that the most N-terminal predicted SIDs were necessary and sufficient to bind Sin3b, while no fragment bound the p300 co-activator (Fig. 3g, ED8). ChIP-seq experiments showed that 80% of Myt1l targets, including Hes1, were co-bound by the repressive Sin3/HDAC1 complex early during reprogramming (Fig. 3h, ED8c). As expected shRNA-mediated knock-down of Sin3b completely abolished iN cell formation, but this could also be due to additional roles of Sin3b16 (Fig. ED8e–g).
One of the pathways targeted by Myt1l on multiple levels is Notch, in line with observations made with its family member Myt117,18 (Fig. 2c). Notch signaling inhibits differentiation of neural progenitor cells via Hes1 by repressing proneuronal factors like Ascl1, but it remains unclear how newborn neurons escape this inhibition19,20. We found that Myt1l largely inhibited the negative effect of Notch intracellular domain (NICD) on neuronal reprogramming and repressed Hes1 protein levels (Fig. 4a–b, ED9a). Chemical Notch inhibition using DAPT enhanced Ascl1-mediated TauEGFP induction, but did not further enhance reprogramming of Ascl1 and Myt1l (Fig. ED9b). Combined overexpression of Ascl1 and Hes1 in MEFs did not only counteract neuronal reprogramming, but also decreased Ascl1 levels without inducing neural stem cell markers (Fig. ED9b–c). Very surprisingly, Hes1 overexpression decreased not only Ascl1 protein but also the transgenic Ascl1 mRNA, suggesting a previously unrecognized post-transcriptional regulation (Fig. ED9d). Myt1l addition could not rescue the reprogramming block by Hes1 overexpression whereas it could rescue the NICD-mediated reprogramming block, demonstrating that Myt1l-mediated Notch-inactivation is primarily caused by direct repression of Hes1 transcription.
Fig. 4: Myt1l represses Notch/Hes1 activity to promote neurogenesis.
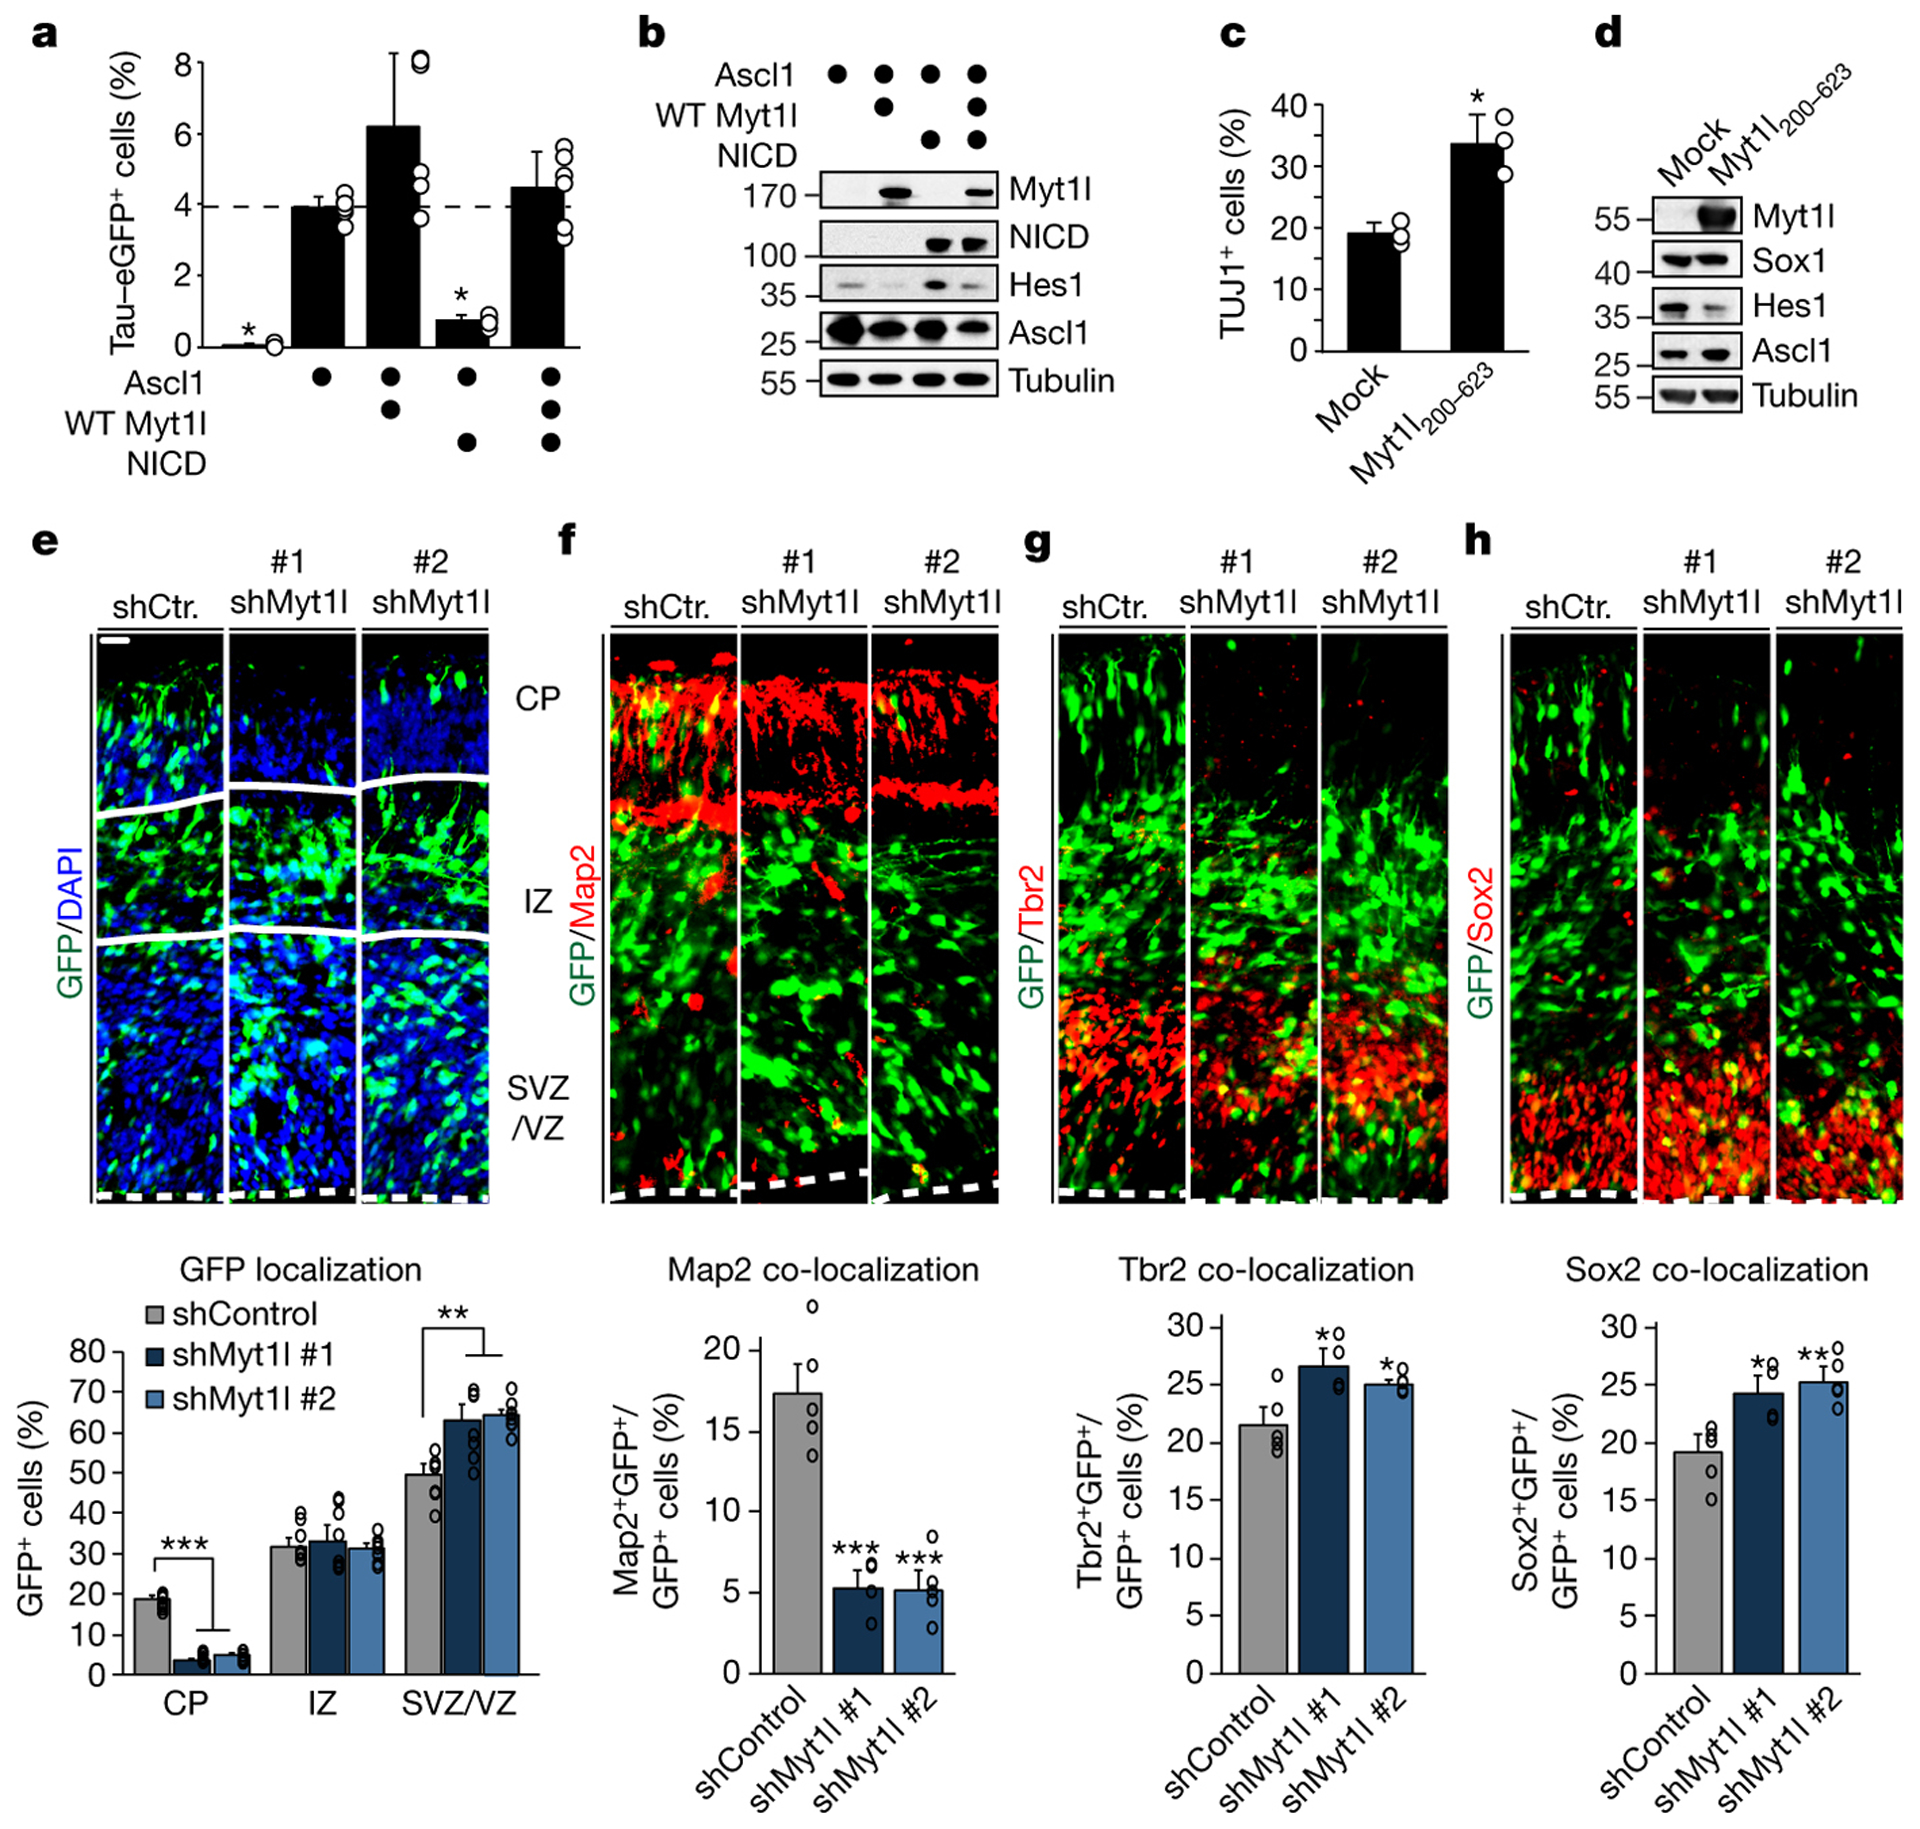
a, Fraction of TauEGFP-positive iN cells derived from MEFs upon reprogramming for 7 days with Ascl1 and either Myt1l wt, notch intracellular domain (+ NICD) or a combination determined by flow cytometry, n = 6, error bars = SD, t-test * p < 0.05. b, Western blot analysis of cells shown in A using indicated antibodies. c, Neuronal differentiation efficiency of mouse neural stem cells (NSCs) upon overexpression of rtTA (mock) or rtTA and Myt1l 200–623 for 7 days based on TUJ1-positive cells with neuronal morphology. n = 3, error bars = SD, t-test * p < 0.05. d, Western blot analysis of proliferating NSCs 7 days upon induction of rtTA (mock) alone or with Myt1l 200–623 using indicated antibodies. e, Myt1l knock-down cells exhibit cell positioning defects in utero. Control or Myt1l-shRNA constructs co-expressing GFP were electroporated into E13.5 embryonic mouse brains, and the mice were analysed at E15.5. The percentage of GFP-positive cells in each region is shown. CP, cortical plate; IZ, intermediate zone; VZ/SVZ, ventricular zone/subventricular zone (n = 8). f-h, Myt1l knock-down leads to in vivo neurogenesis defects. Cortices electroporated in A were examined at E15.5 by staining with antibodies against MAP2, TBR2, or SOX2 and the percentage of the GFP-positive cells that were also positive for the corresponding markers are shown. (source data Fig. 4, n = 5 for shControl and shMyt1l #2, n = 4 for shMyt1l #1). Scale bar 25 μm, error bars = SEM, t-test * p < 0.05, ** p < 0.005, *** p < 0.0005.
To explore the physiological function of Myt1l during normal neurogenesis we performed in utero electroporation of Myt1l-shRNA-GFP constructs into E13.5 mouse forebrains. Myt1l depletion led to a substantial reduction of electroporated cells in the cortical plate two days later, with a corresponding increase in GFP-positive cells in the ventricular and subventricular zones (Fig. 4e). Moreover, we found a reduced fraction of MAP2+ mature neuronal cells among GFP+ cells with a compensatory increase of GFP+ apical (Sox2+) and basal (Tbr2+) progenitors, indicating that acute Myt1l depletion impairs neurogenesis in vivo (Fig. 4f–h). Neural stem cells (NSC) exhibit oscillatory Hes1 expression that triggers anti-phasic expression of proneural factors like Ascl119. To test if Myt1l could repress Hes1 to trigger Ascl1 induction and neuronal differentiation we overexpressed Myt1l 200–623 in mouse NSCs and indeed observed increased neuronal differentiation (Fig. 4c, ED9f). Western blot analysis of NSCs maintained in proliferating conditions with FGF and EGF showed that Myt1l 200–623 overexpression strongly decreased Hes1 and slightly increased Ascl1 protein levels (Fig. 4d). Remarkably, even exogenous Ascl1 protein became stabilised upon Myt1l overexpression in MEFs during reprogramming, further suggesting that Hes1 blocks Ascl1 also post-transcriptionally (Fig. ED9e). In summary, these findings show that Myt1l can render cells insensitive to Notch signaling and provide a molecular explanation how newborn neurons can overcome the Notch anti-differentiation stimulus.
Finally, we sought to address if Myt1l represses many non-neuronal programs also in neurons. RNA-seq of cultured hippocampal neurons upon shRNA-mediated Myt1l depletion led to a striking de-repression of Myt1l target genes like Notch and Wnt pathway members and overall induced GO terms characteristic of non-neuronal tissues including cartilage, lung and heart (Fig. ED10i–j). Fibroblast, keratinocyte and hepatocyte-specific gene signatures were more highly enriched among induced than repressed genes (Fig. ED10g). Importantly, the de-repression of non-neuronal programs was associated with loss of neuronal gene expression and functional properties (Fig. ED10a–f). Moreover, sequence analysis showed that in contrast to REST, Myt1l motifs are substantially depleted at neuronal gene promoters, further supporting the “many-but-neuronal” repressive function of Myt1l (Fig. ED10h).
In this study we discovered a new kind of transcriptional repressor. Unlike conventional repressors that inhibit specific lineages, such as REST and Groucho, Myt1l appears to blocks a multitude of differentiation programs and lineage identities except the neuronal lineage. In combination with activating lineage master regulators such as Ascl1, the molecular repressor Myt1l acts in a perfect complementary fashion to enable cell fate determination. Similar pairs of activating and repressing transcription factors may yield optimal reprogramming also for other lineages. Finally, our data suggest that the physiological function of Myt1l is to establish and maintain the identity of neurons. To date, Myt1l is the only known transcription factor that is specifically expressed in all neurons throughout life indicating that active repression of non-neuronal programs is critical for maintaining the neuronal identity6. It is possible that the various Myt1l mutations recently identified in schizophrenia, major depression, intellectual disability, and psychomotor retardation may affect the neuronal maintenance function of Myt1l rather than neurogenesis21–24. This would provide an opportunity of curative interventions even in adult patients.
Extended Data
Fig. ED1: Myt1l antibody design and characterisation.
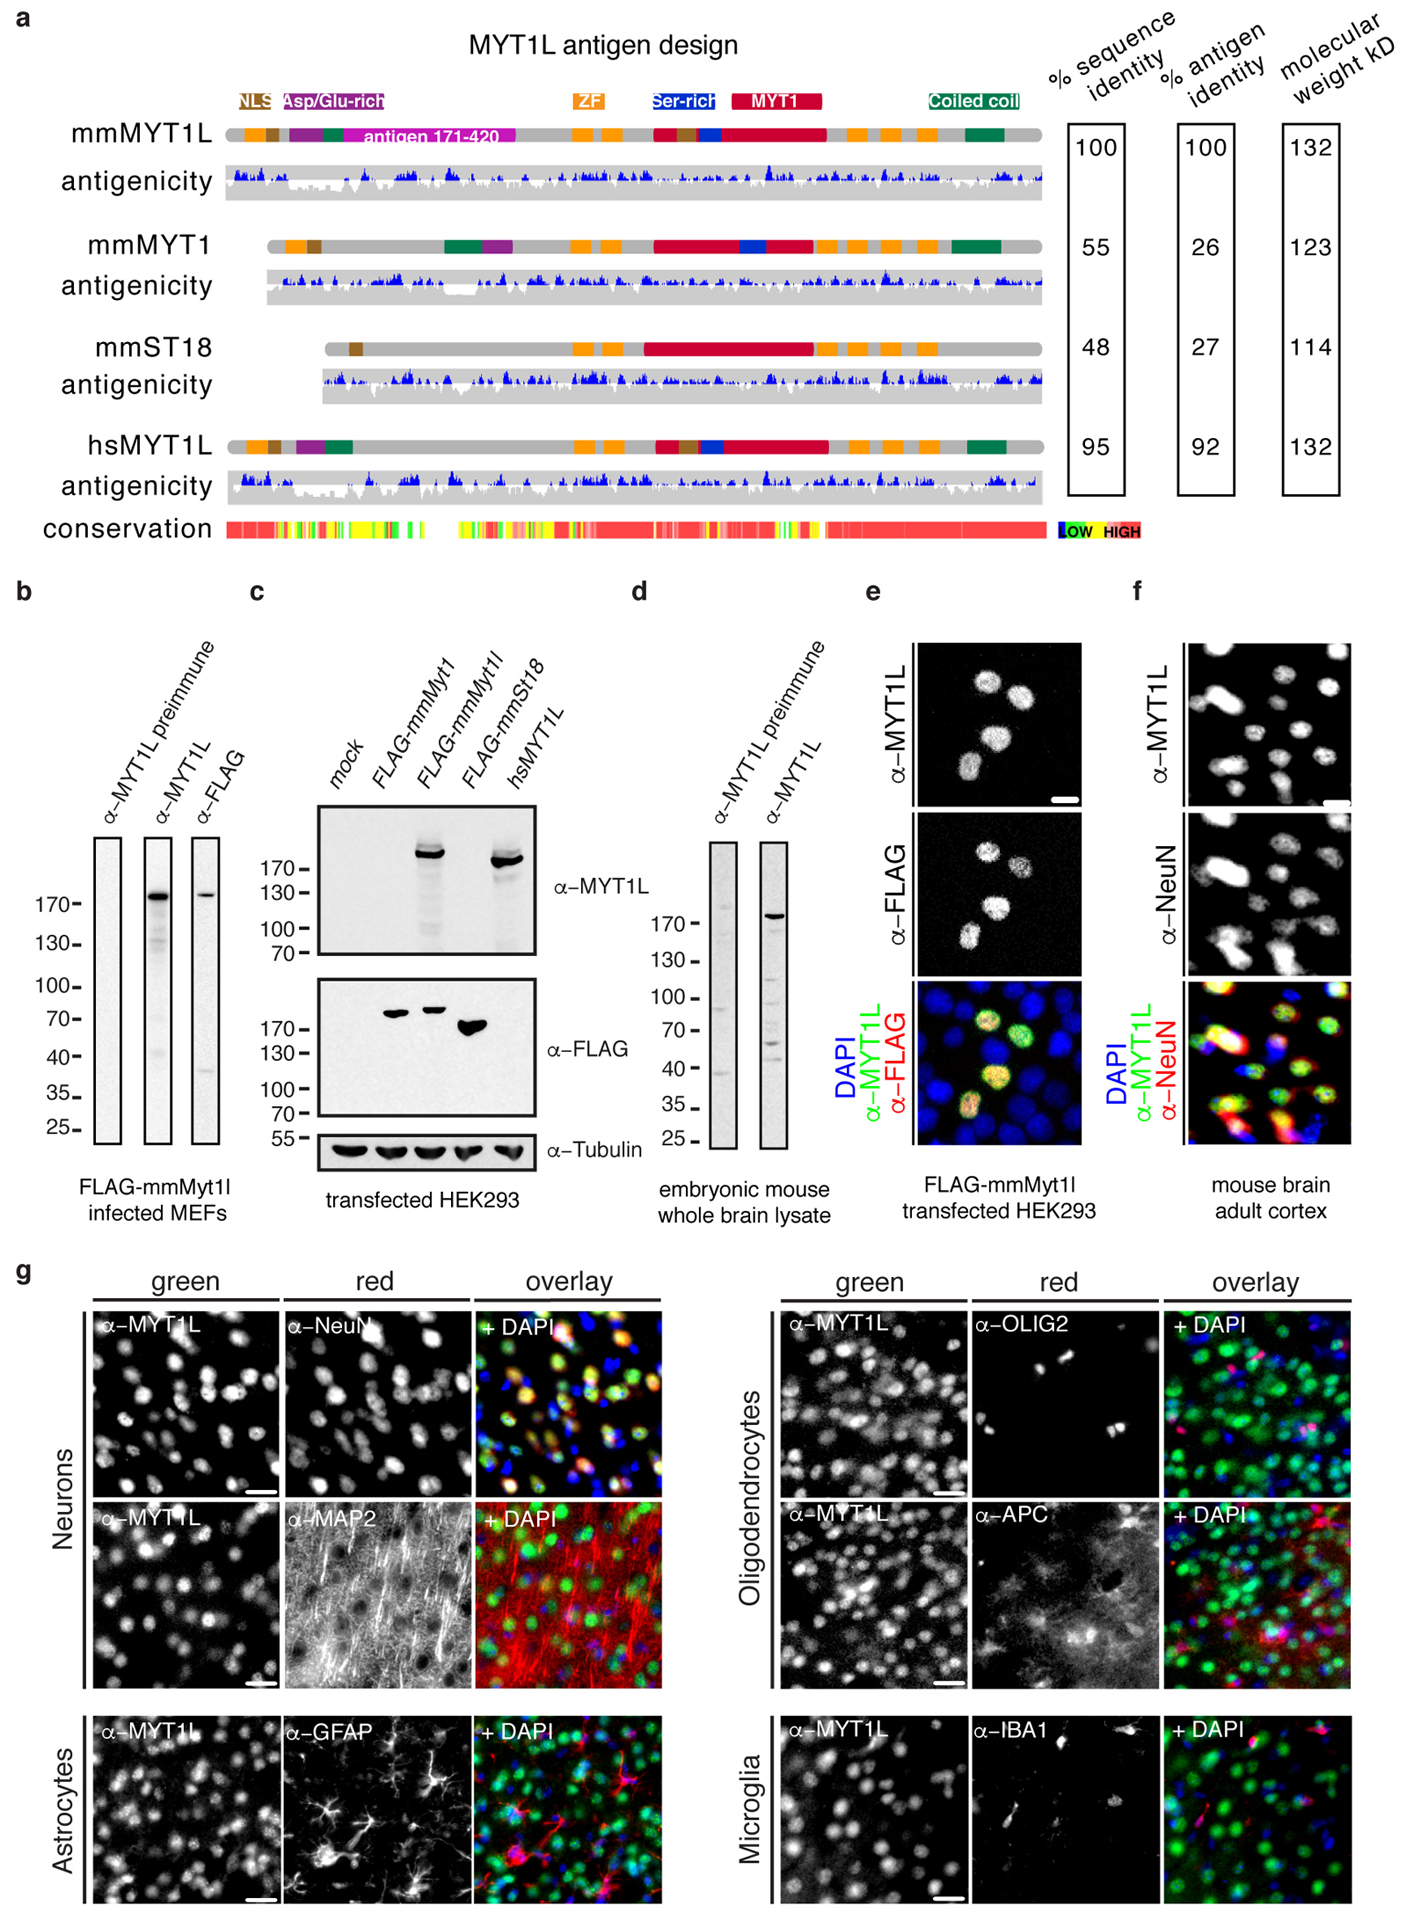
a, Schematic of mouse MYT1 family members mmMYT1 (Q8CFC2), mmMyt1l (P97500) and mmST18 (A5LFV3) as well as human hsMyt1l homologue (Q9UL68). Highlighted are the nuclear localisation signals (NLS), aspartic acid/ glutamic acid-rich (Asp/Glu-rich), serine-rich (Ser-rich), MYT1. coiled-coil domains and the CCHC-type zinc fingers (ZF). Also shown is the predicted antigenicity and the conservation between the proteins generated using EpiC and T-Coffee, respectively. Based on this a fragment of mmMyt1l 171–420 was used as antigen for antibody induction in rabbits. The sequence identities among the antigen regions and the full-length proteins, as well as the molecular weights are shown (right). b-d, Western blot of; b MEF cells upon induction of FLAG-tagged mmMyt1l, c HEK293 cells upon transfection of FLAG-tagged mmMyt1, mmMyt1l, St18, and untagged hsMyt1l, and d E13.5 embryonic mouse whole brain lysate using preimmune serum, antibodies against Myt1l, FLAG, and Tubulin. e, Microscopy images of HEK293 cells upon transfection of FLAG-tagged mmMyt1l followed by immunofluorescence using antibodies against FLAG (red) and Myt1l (green). f, Microscopy images of a section from adult mouse cortex upon immunofluorescence using antibodies against NeuN (red), Myt1l (green), and DAPI staining (blue). Scale bar 10 μm. g, Myt1l antibody specifically marks mouse brain neurons in vivo. Immunofluorescence microscopy images of adult mouse brain cortex sections using antibodies against neurons; NeuN and MAP2. Oligodendrocytes; OLIG2 and APC. As well as astrocytes (GFAP) and microglia (IBA1) all shown in red together with Myt1l (green) and DAPI staining (blue). Note that Myt1l only overlaps with neuronal markers. Scale bar 20 μm.
Fig. ED2: Genome-wide chromatin binding of Myt1l.
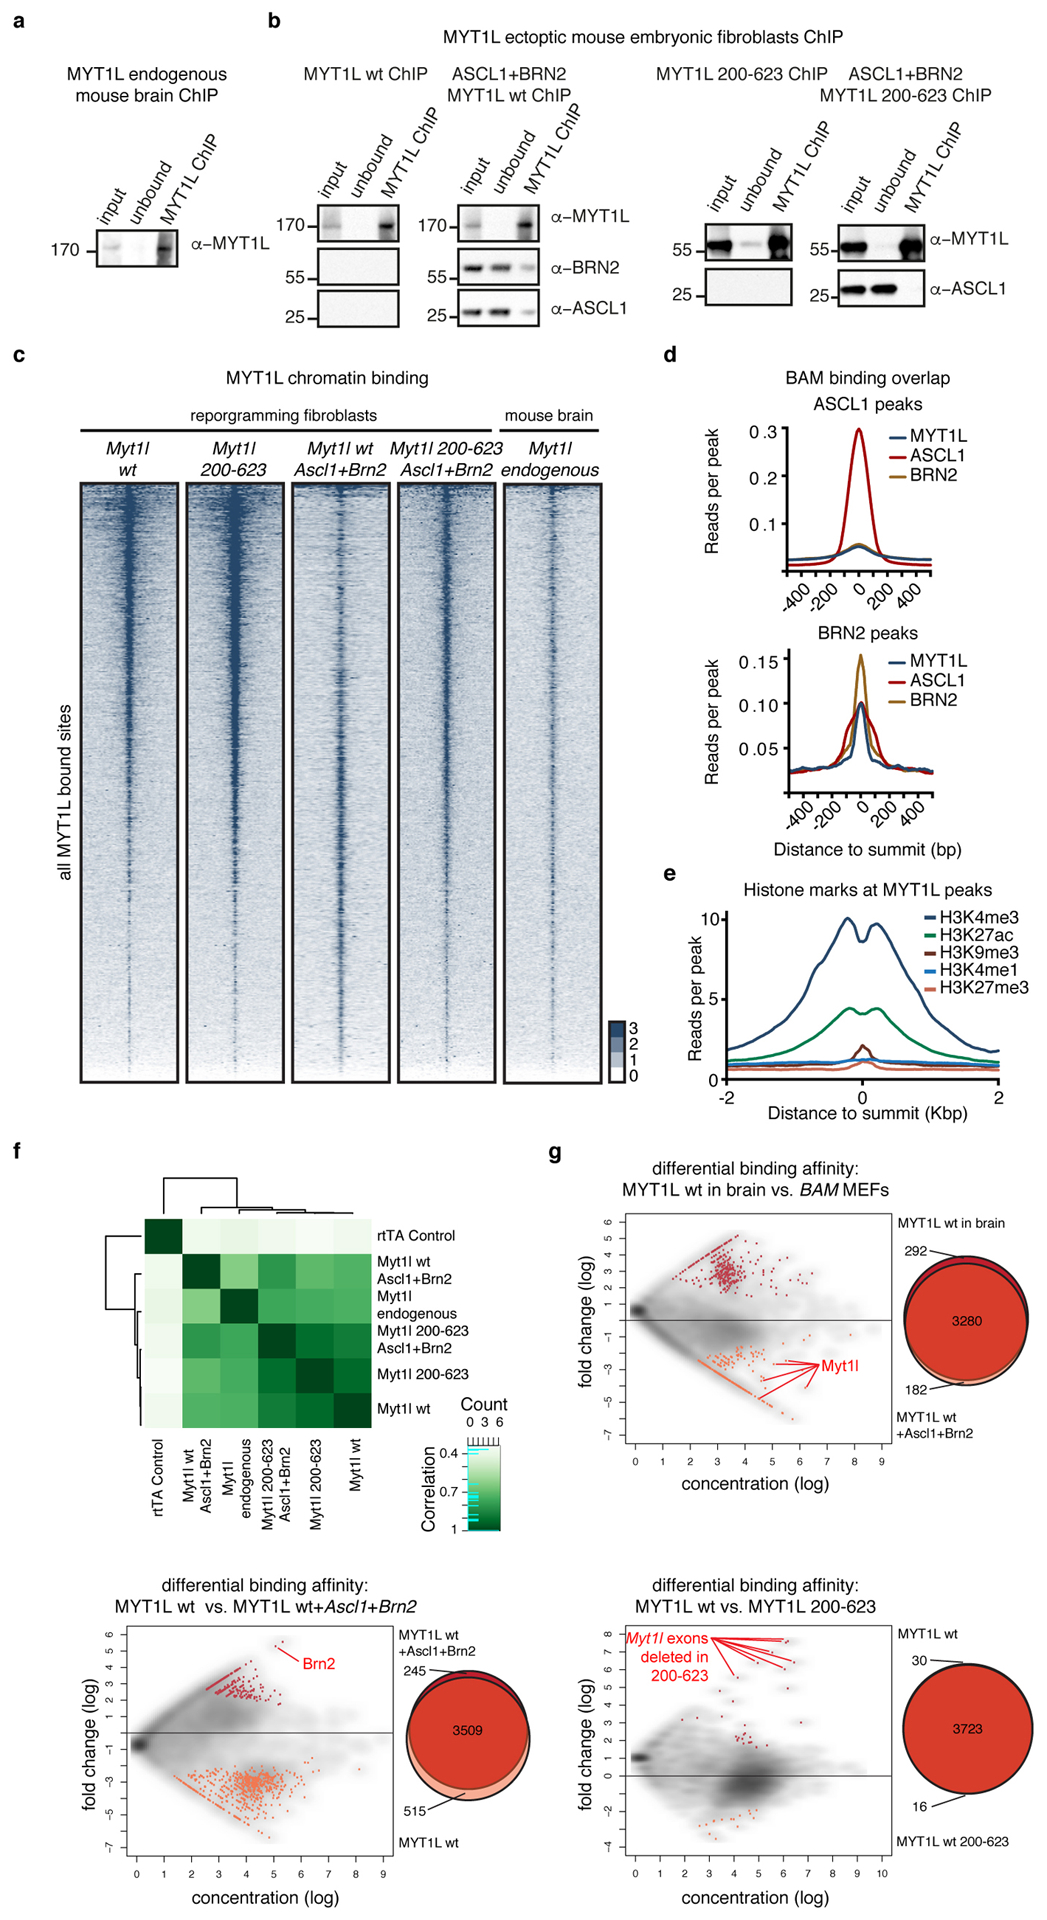
a-b, Chromatin immunoprecipitation (ChIP) of endogenous Myt1l from a E13.5 mouse brain or b of Myt1l wt (left) and 200–623 (right) transgenes from MEF cell lysates 2 days upon induction with or without Ascl1 and Brn2. Chromatin immunoprecipitates were analysed by Western blotting with Myt1l, BRN2, and ASCL1 antibodies. Input = 0.3% of ChIP input, unbound = 0.3% of ChIP flow-through, ChIP = 3% of ChIP eluates. c, ChIP-seq genome-wide occupancy of endogenous Myt1l in E13.5 mouse brains (n = 2) or Myt1l and Myt1l 200–623 in MEFs two days after induction with (n = 3) or without (n = 2) Ascl1 and Brn2. 6911 total peaks are sorted based on intensity and corresponding genomic regions are displayed across all data sets, signal is displayed ± 2 kb from summits. (See also Fig. 1). d, Chromatin reads for Myt1l, ASCL1, and BRN2 at ASCL1 (top), and BRN2 peaks (bottom)8. e, Chromatin reads of indicated histone marks in uninfected MEFs at the sites at which Myt1l is bound during reprogramming. Signal is displayed ±2 kb from peak summit. f, Pearson correlation and clustering analysis of ChIP-seq samples highlight high binding overlap between different conditions. g, MA plots from DiffBind and corresponding Venn diagrams showing the distribution of Myt1l ChIP-seq peak intensities between indicated conditions; endogenous Myt1l in mouse brain versus overexpressed Myt1l in BAM MEFs (top), Myt1l overexpression alone versus in combination with Ascl1 and Brn2 (BAM) in MEFs (bottom left), and Myt1l wt versus Myt1l 200–623 overexpression in MEFs (bottom right). Significantly different peaks are shown in color and numbers are annotated. Peaks that are significantly changed due to experimental setup are highlighted red.
Fig. ED3: Myt1l represses many but the neuronal transcriptional network.
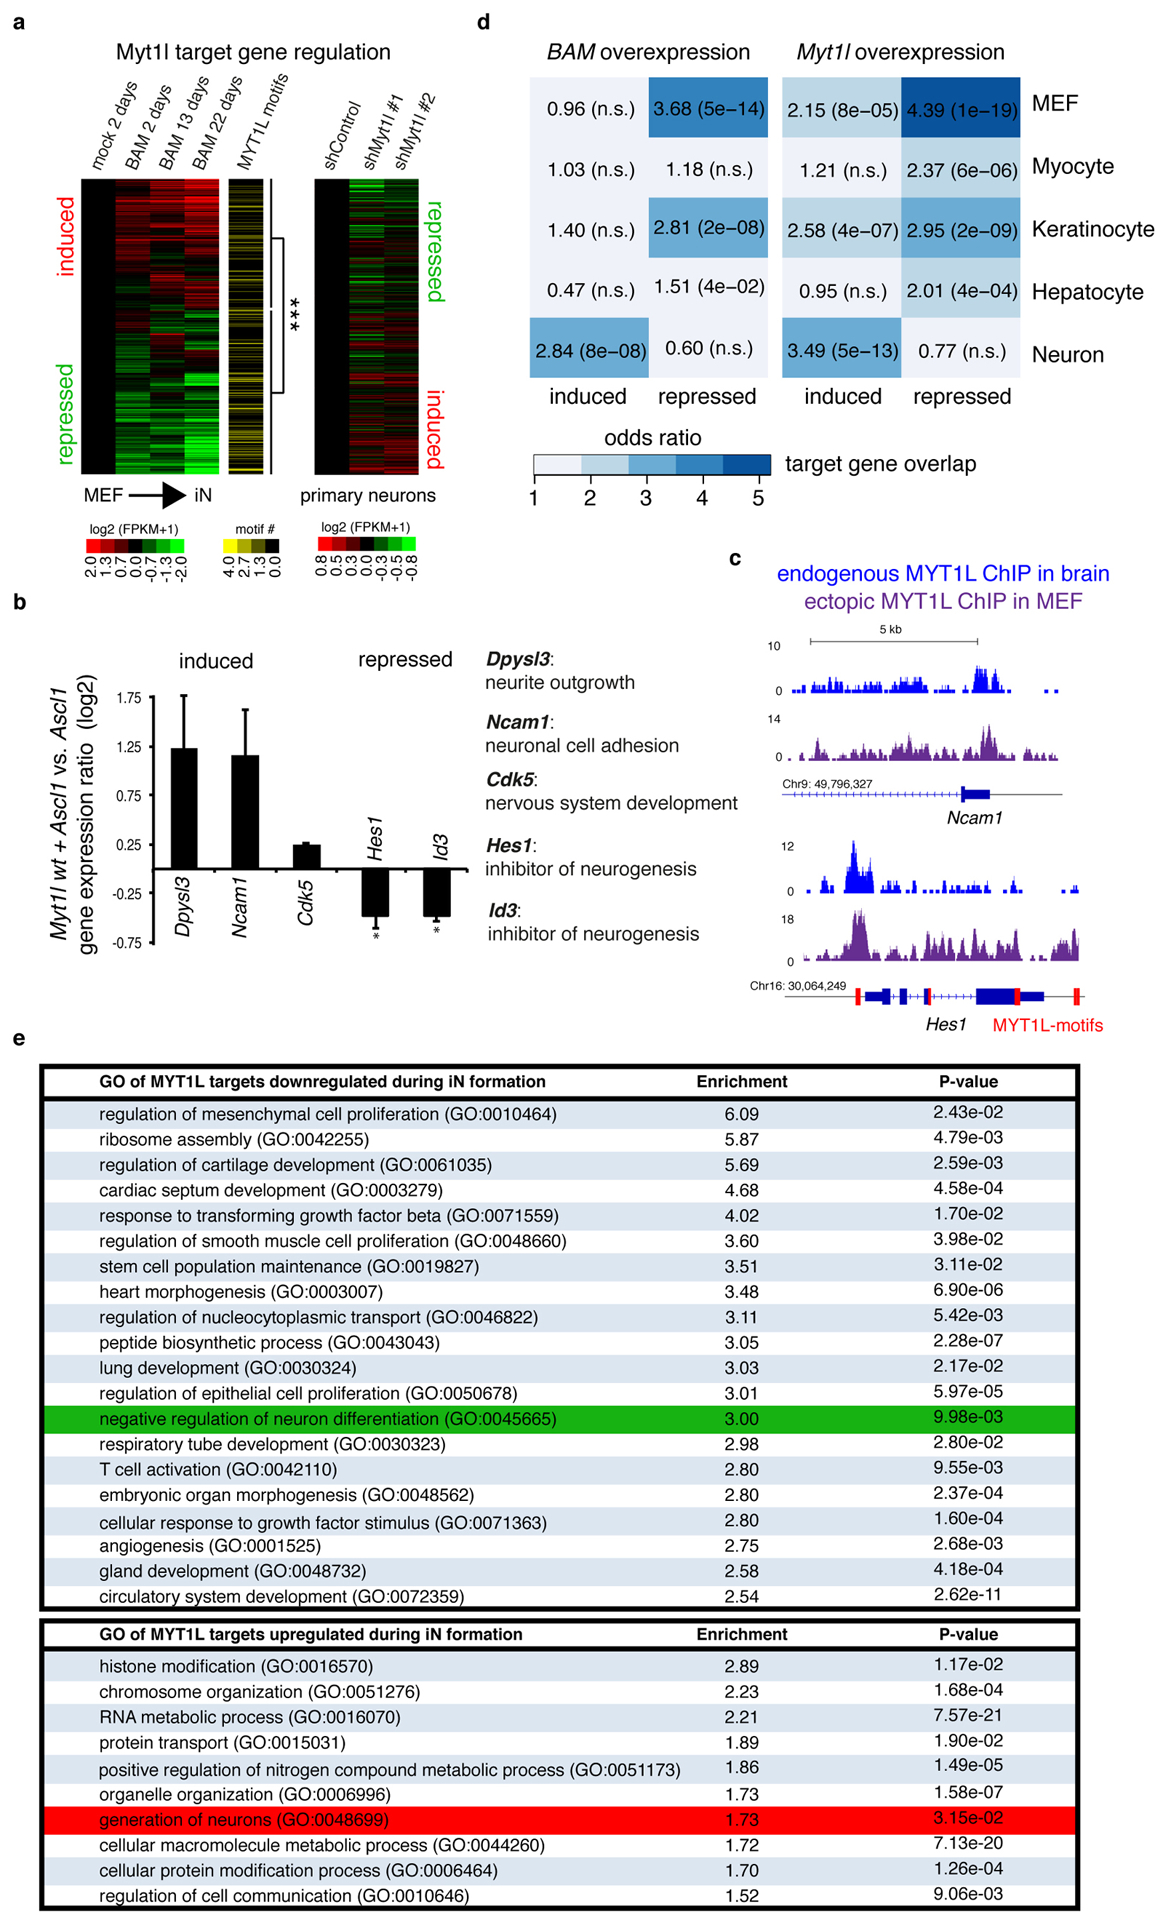
a, Heatmap of gene expression changes at promoter bound Myt1l target genes during iN cell conversion in MEFs at the indicated time points based on RNA-seq show significant enrichment of Myt1l motifs at repressed genes (p = 6.85×10⁻⁶), n = 28 (left) and inverse transcriptional effects upon Myt1l knock-down in primary hippocampal neurons (right). b, Mean expression levels of selected Myt1l target genes in MEFs upon induction of Myt1l wt together with Ascl1 for two days determined by quantitative real time PCR show significant repression of canonical inhibitors of neurogenesis by Myt1l. Names and annotated functions of tested genes are indicated, expression levels were normalised to Ascl1 only induction and GAPDH expression, n = 4 biological replicates (with 2 technical replicates each), error bars = SE, pair wise fixed reallocation randomisation test * p < 0.00126. c, Myt1l ChIP-seq profile at the Hes1 and Ncam1 promoter shows strong binding of endogenous Myt1l in E13.5 mouse brain and overexpressed Myt1l wt in MEFs two days after reprogramming, red bars mark multiple Myt1l AAGTTT-motifs present in repressed Hes1 promoter and gene body. d, Overlap of Myt1l bound target genes that are induced or repressed during MEF-iN formation upon overexpression of Myt1l with or without Ascl1 and Brn2 and indicated cell type specific expression signatures determined by GeneOverlap27. Odds ratio > 2 represents strong association, p-values are shown in brackets, n.s. = not significant. e, Selected top gene ontology (GO) terms of Myt1l targeted genes that are repressed (top) or induced (bottom) during reprogramming determined by PANTHER28. Enrichment scores and p-values are shown. Highlighted are the terms “negative regulation of neuron differentiation” (green) in the repressed cluster and “generation of neurons” (red) in the induced cluster. Both analyses show a striking enrichment of repressed Myt1l target genes within several non-neuronal programs. Of note several metabolic GO terms are among the upregulated target genes.
Fig. ED4: Myt1l blocks muscle differentiation in primary myoblasts.
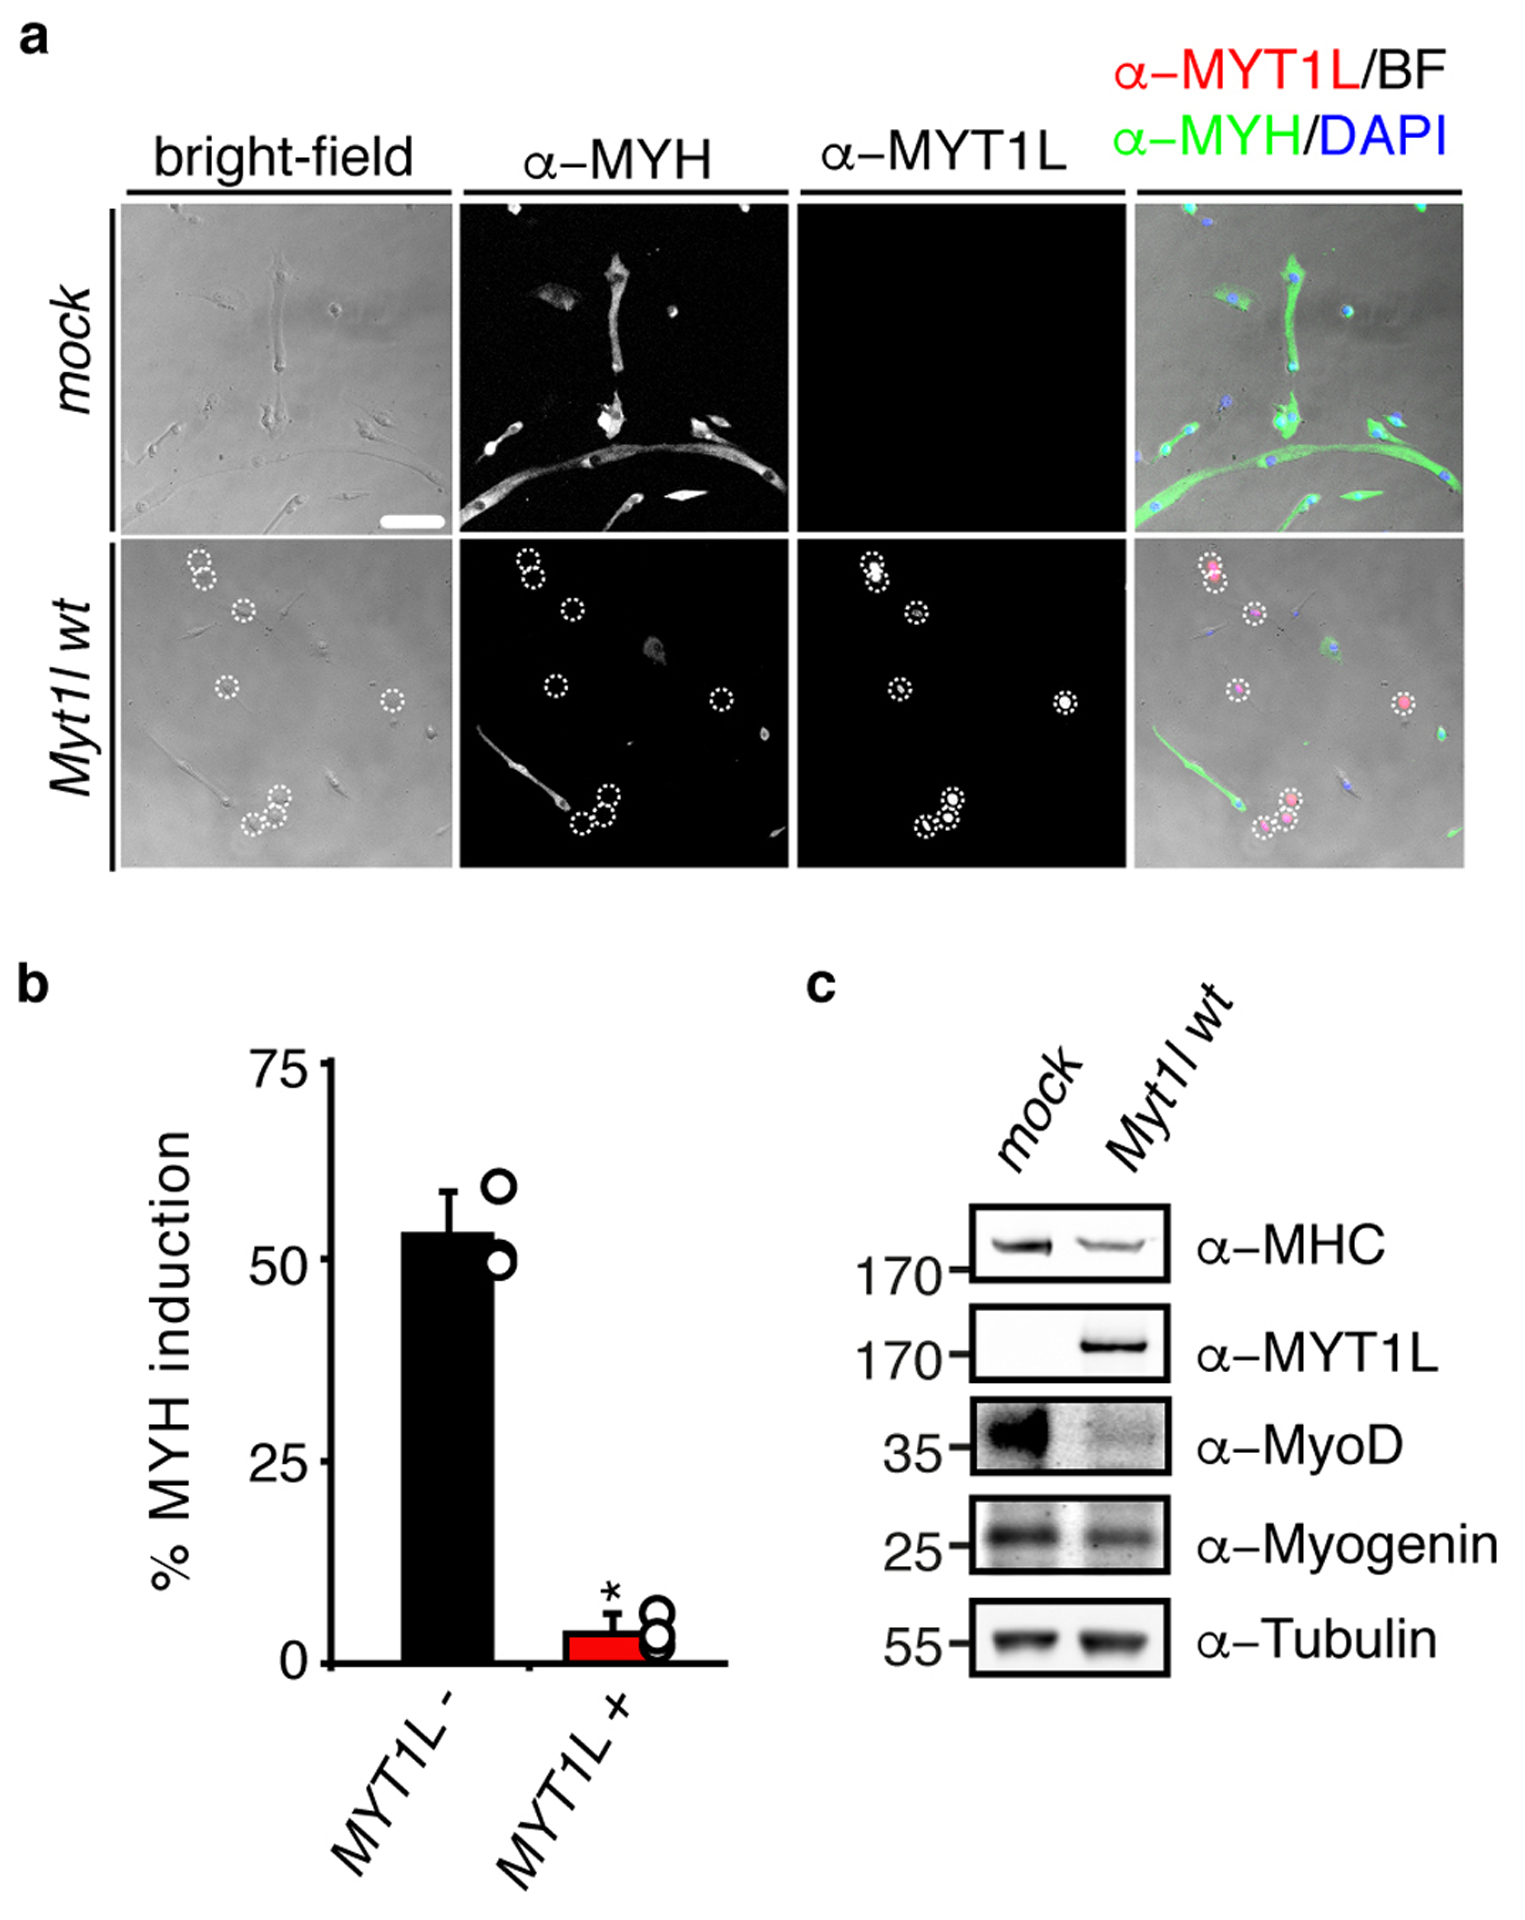
a, Representative micrographs of muscle cells derived from primary myoblasts upon differentiation for 4 days with with rtTA alone (mock) or in combination with Myt1l wt followed by immunofluorescence using antibodies against MYH (green), MYT1L (red) and DAPI staining (blue), scale bar 100 μm. b, Muscle differentiation efficiency of cells shown in A highlight the repressive effect of MYT1L expression (+) on MYH-induction compared to MYT1L negative cells (−). n = 3, error bars = SE, t-test * p < 0.005. c, Western blot of muscle cells shown in A using indicated antibodies show reduction of several muscle markers upon MYT1L overexpression.
Fig. ED5: Truncation screen identifies minimal neurogenic domains of Myt1l.
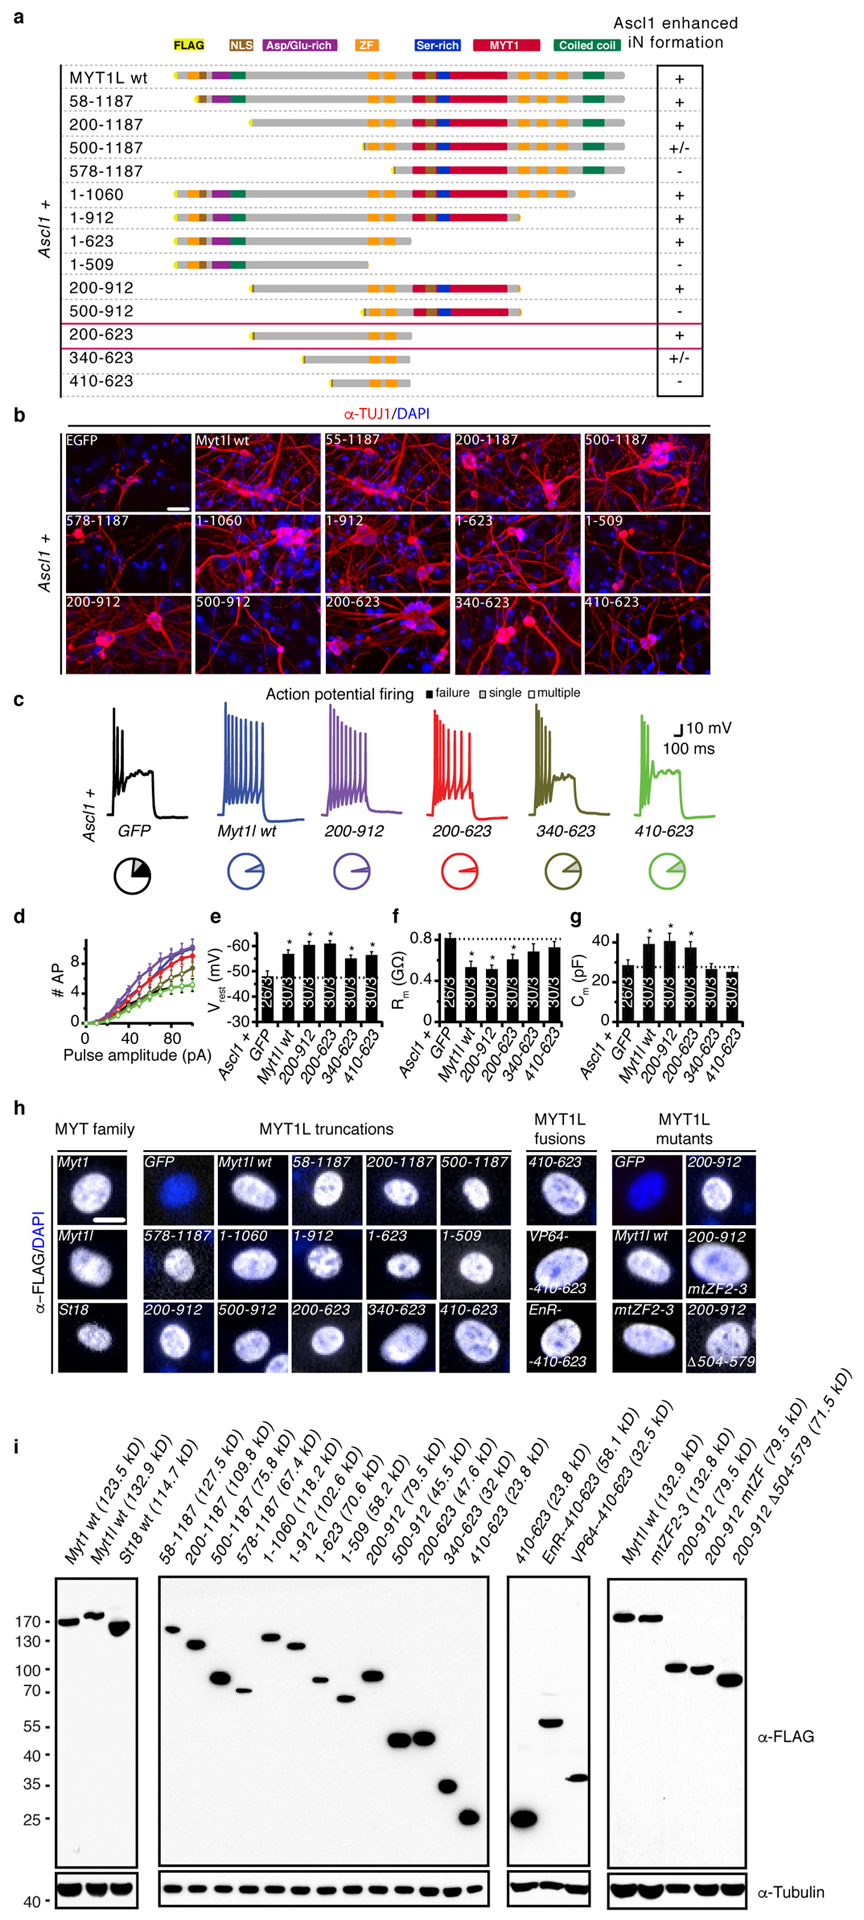
a, Schematic of FLAG and NLS-tagged Myt1l truncation proteins including amino acid positions. Ability to enhance neurogenic conversion together with Ascl1 is indicated by (+), minimal active truncation Myt1l 200–623 is boxed red (see also Fig. 3). Myt1l truncations with partial or without enhanced conversion activity are indicated with (+/−) and (−), respectively. b, Representative micrographs of iN cells derived from MEFs upon reprogramming for 14 days with Ascl1 together with the indicated transgenes followed by immunofluorescence using antibodies against TUJ1 (red) and DAPI staining (blue), scale bar 50 μm. c-g, Electrophysiological characterisation of iN cells derived in B upon maturation for 21 days on mouse glia. c, Representative action potential (APs) traces of iN cells upon reprogramming with Ascl1 together with indicated Myt1l truncation. Pie charts indicate fraction of cells firing single (grey), multiple (white), or no (black) APs. d, Mean number of APs fired plotted with respect to pulse amplitude measured at −60 mV holding potential. e, Mean resting membrane-potential (Vrest). f, Mean membrane resistance (Rm) and g capacitance (Cm) measured at −70 mV holding potential. Dotted line indicates intrinsic properties of Ascl1+GFP, n = 3 biological replicates (total number of individual cells measured indicated), error bars = SE, t-test * p < 0.05. h, Microscopy images showing nuclear localisation of all tested Myt1l truncations two days after induction in MEFs by immunofluorescence using antibodies against FLAG (grey) and DAPI staining (blue), scale bar 10 μm. i, Western blot analysis of HEK293 cells two days after transfection with the indicated transgenes confirms protein integrity using antibodies against FLAG and Tubulin.
Fig. ED6: Characterization of mouse and human iN cells generated with ASCL1 and Myt1l.
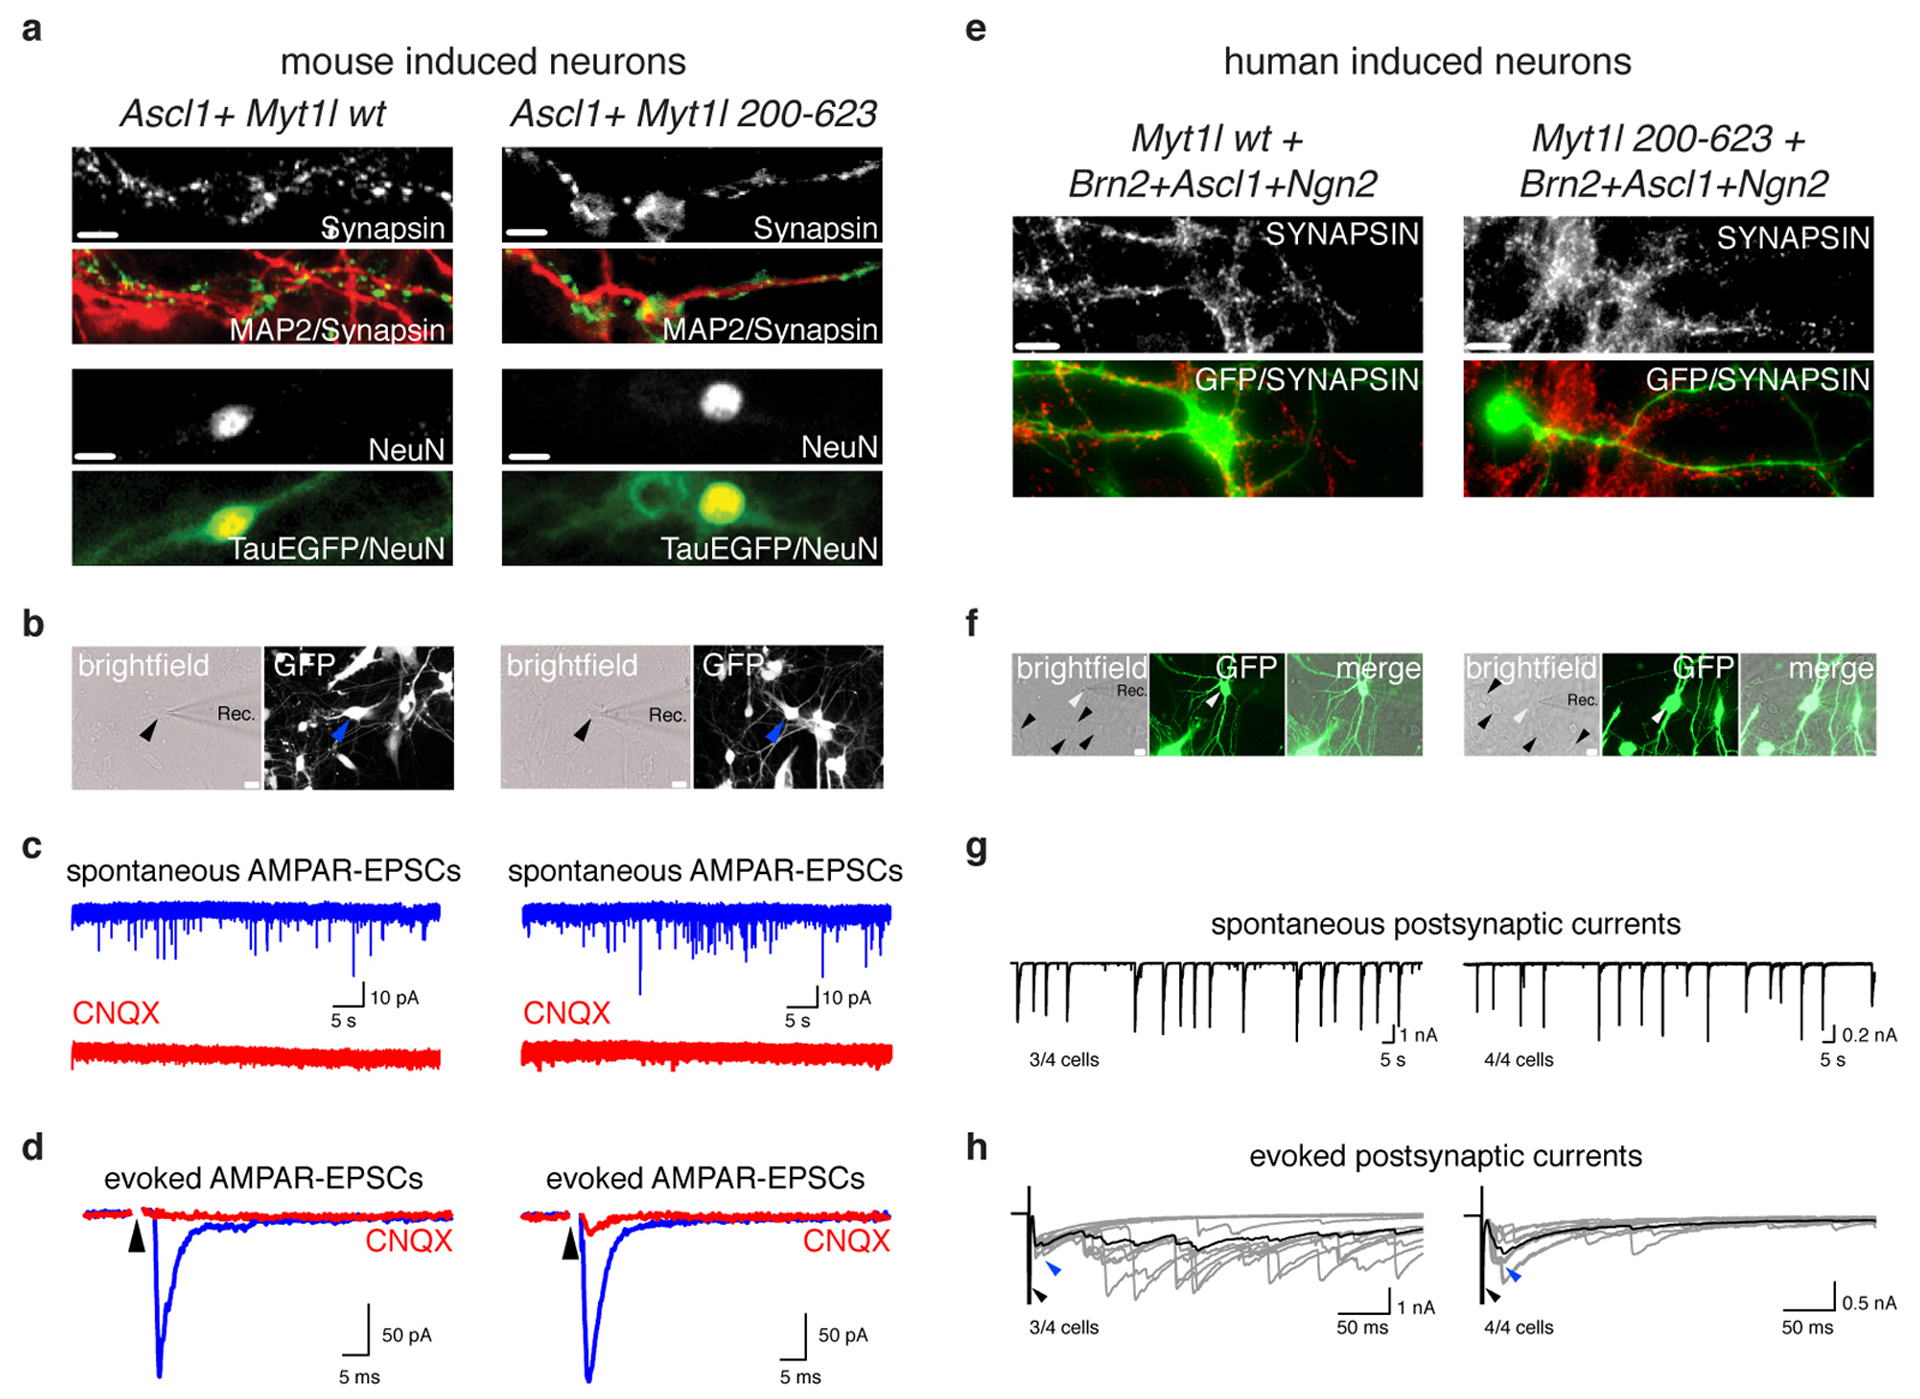
a, Microscopy images of iN cells derived from MEFs upon reprogramming for 21 days on mouse glia by overexpression of Ascl1 together with either Myt1l wt or Myt1l 200–623 followed by immunofluorescence using antibodies against MAP2 (red) and Synapsin (green) or NeuN (red) and TauEGFP (green), scale bar 10 μm. b, Synaptic recordings of TauEGFP-positive mouse iN cells shown in A. c-d, Spontaneous and evoked excitatory postsynaptic currents (EPSCs) were recorded at a holding potential of −70 mV (blue) and blocked by the addition of CNQX (red), indicating that the excitatory nature of the resulting induced neurons is mediated through AMPA-type receptors (AMPAR). e, Immunofluorescence images of iN cells derived from human embryonic fibroblasts upon reprogramming for 6 weeks by overexpression of GFP, Ascl1, Ngn2, Brn2 together with either Myt1l wt or Myt1l 200–623 and co-culture with primary cortical mouse neurons using antibodies against Synapsin (red) and GFP (green), scale bar 10 μm. f, Synaptic recordings of GFP-positive human iN cells shown in E. g-h, Spontaneous and evoked excitatory postsynaptic currents (EPSCs) were recorded at a holding potential of −70 mV, indicating synaptic competence of the resulting induced human neurons. n = 4 cells (fraction of active cells indicated).
Fig. ED7: Zinc fingers are essential or neurogenic function of Myt1l.
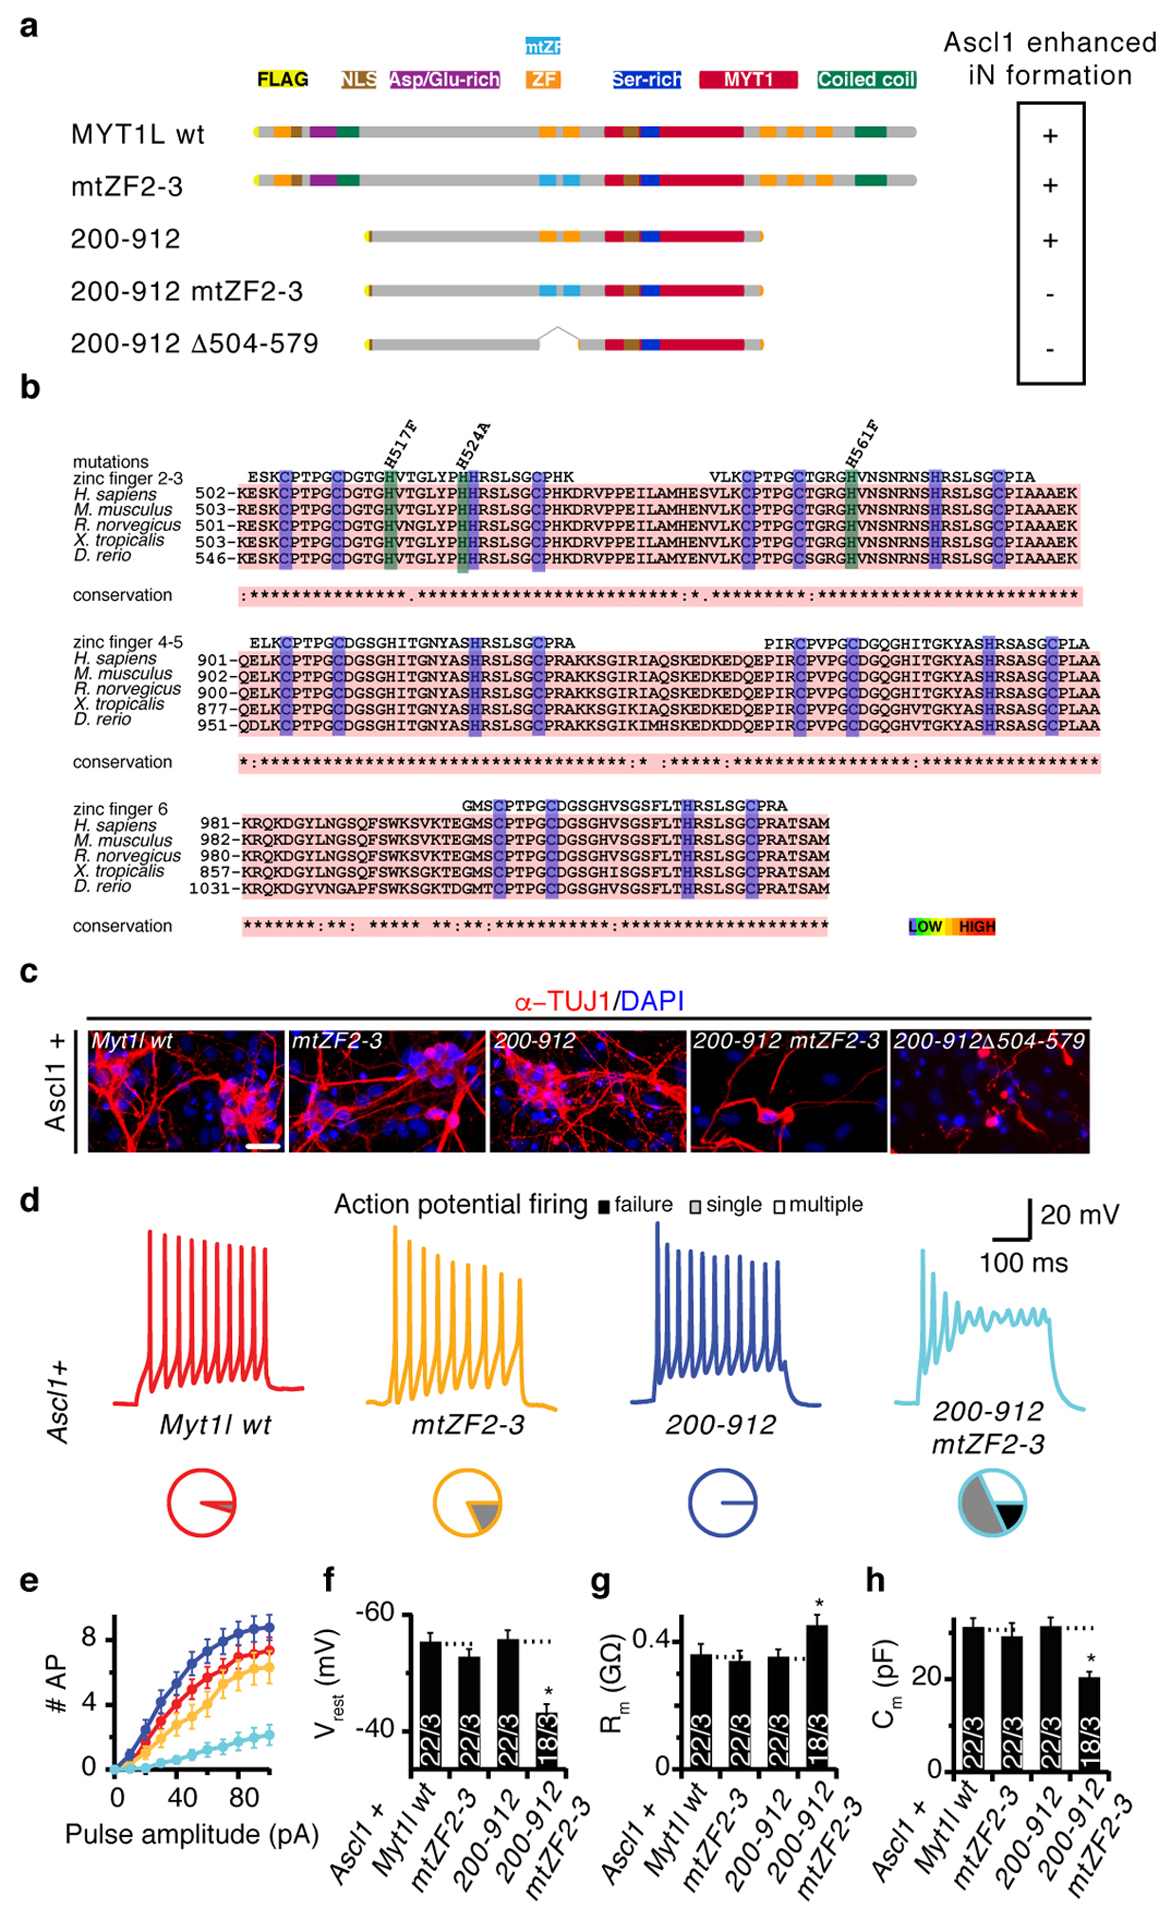
a, Schematic of Myt1l zinc finger 2–3 point and deletion mutants and their ability to enhance neurogenic conversion together with Ascl1 is indicated by (+), non-functional mutants are indicated with (−)(see also Fig. 3). b, Sequence alignments and conservation of CCHC-type zinc fingers from Myt1l; cysteine and histidine residues that can coordinate Zn(II) are highlighted in purple, non-coordinating mutated histidines are shown in green. c, Representative immunofluorescence of iN cells derived from MEFs upon reprogramming for 14 days with Ascl1 and the indicated transgenes; TUJ1 (red), DAPI staining (blue), scale bar 50 μm. d-h, Electrophysiological characterisation of iN cells derived in C upon maturation for 21 days on mouse glia. d, Representative action potential (AP) traces of iN cells generated with indicated transgenes, pie charts indicate fraction of cells firing single (grey), multiple (white), or no (black) APs. e, Mean number of APs fired plotted with respect to pulse amplitude measured at −60 mV holding potential. f, Mean resting membrane-potential (Vrest). g, Mean membrane resistance (Rm) and h capacitance (Cm) measured at −70 mV holding potential. Dotted line indicates intrinsic properties of Ascl1+Myt1l wt or Ascl1+Myt1l 200–912, n = 3 biological replicates (total number of individual cells measured indicated), error bars = SE, t-test * p < 0.05.
Fig. ED8: SIN3b binds Myt1l via N-terminal SID domains and is essential for reprogramming.
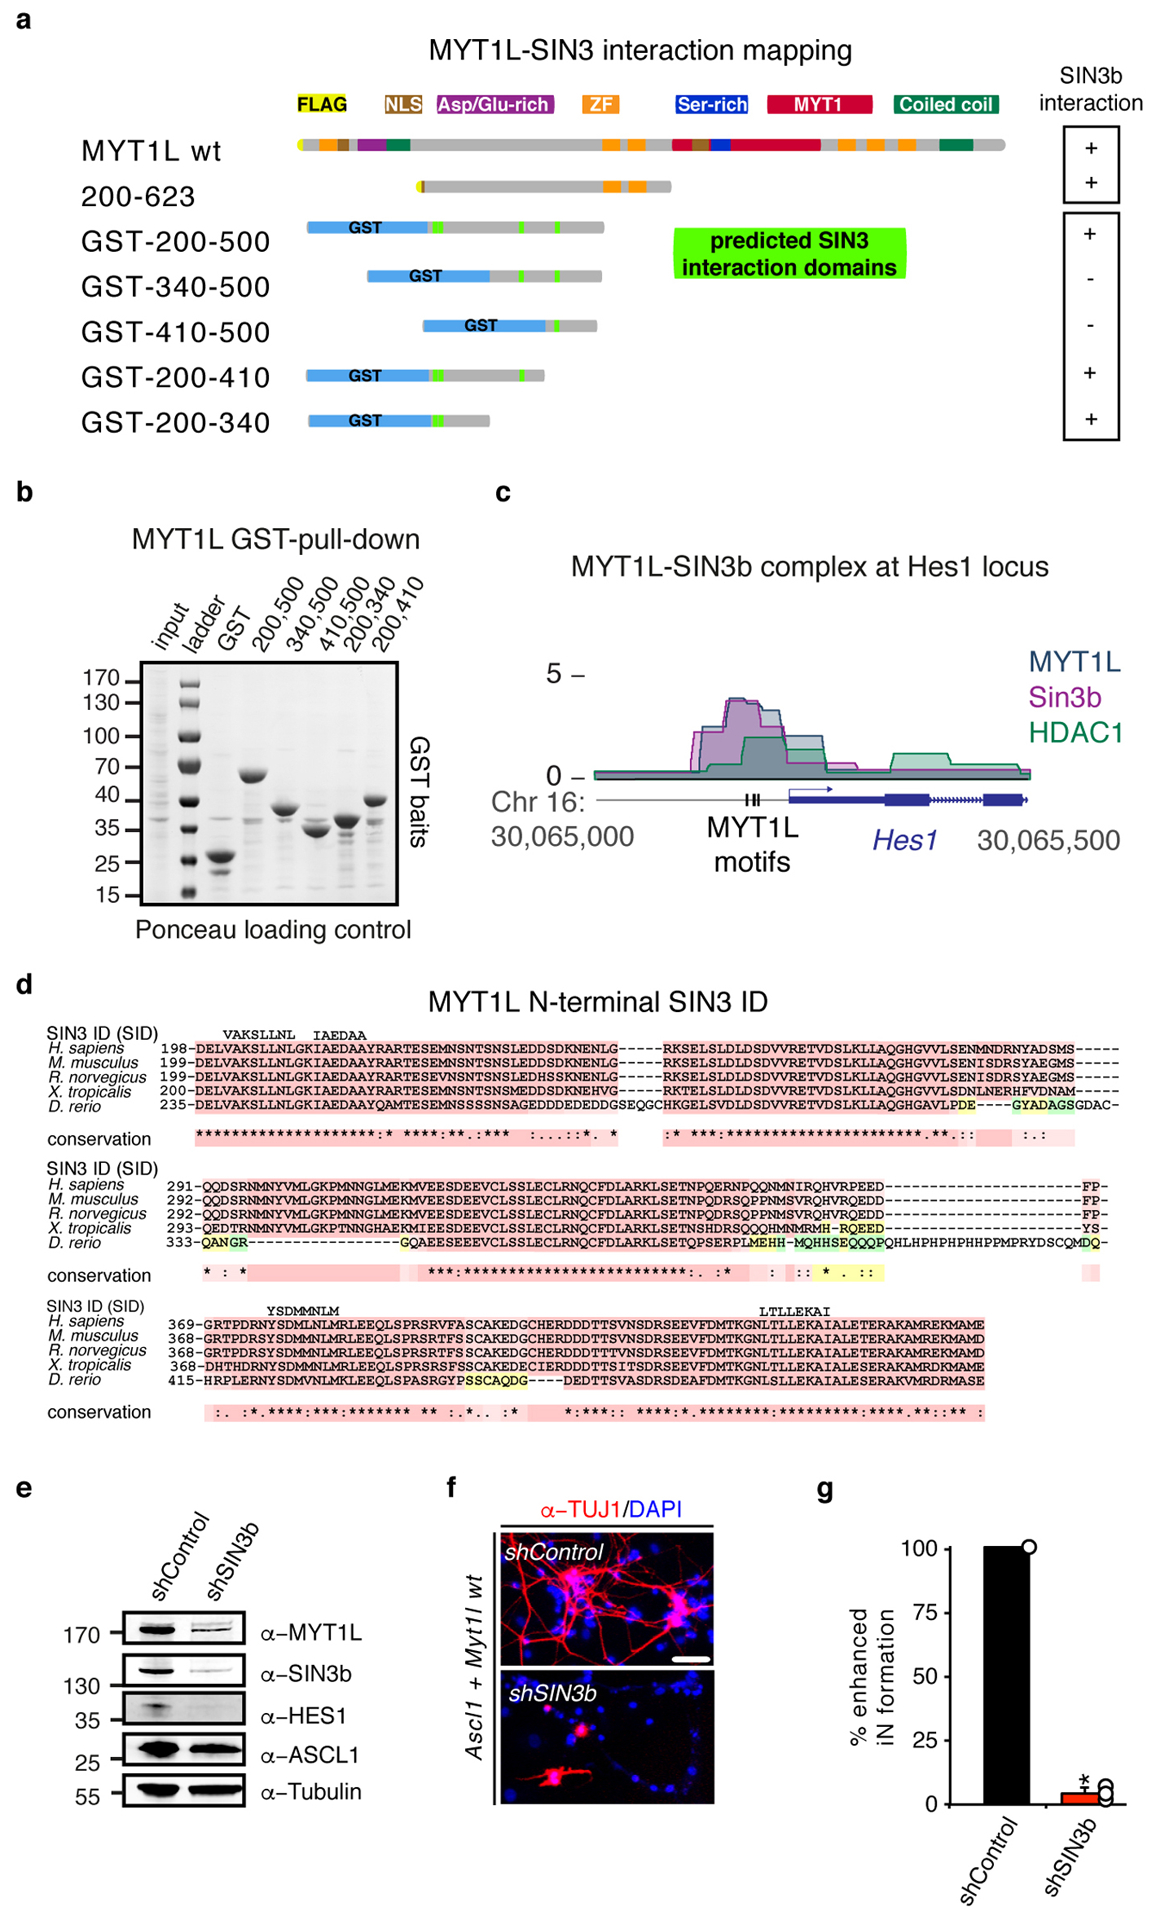
a, Schematic of FLAG and NLS-tagged Myt1l truncations and glutathione S-transferase (GST)-tagged Myt1l fusion proteins, highlighted are putative SIN3 interactions domains (SID)(See also Fig. 3). Ability to biochemically interact with SIN3b is indicated by (+) and (−), respectively. b, GST bait loading after pull down was controlled by Ponceau staining of the Western blot membrane. Input = 0.2% of pull down (PD) input, PD lanes = 20% of PD eluates. c, ChIP-seq tracks of SIN3b, HDAC1, and Myt1l shows binding at the Hes1 promoter two days after MEF reprogramming with Ascl1, Brn2, and Myt1l wt. Vertical bars mark Myt1l AAGTT-motifs. d, Multiple sequence alignments of the highly conserved putative SIN3 interaction domains (SID) within minimal functional region of Myt1l from selected eukaryotic species. The alignment was generated using T-Coffee and putative SID regions are shown above the alignment. e, Western blot of iN cells derived from MEFs upon reprogramming for 2 days with Ascl1, Myt1l wt together with either control or Sin3b-targeting shRNA constructs using indicated antibodies. f, Representative micrographs of iN cells derived in D upon reprogramming for 14 days followed by immunofluorescence using antibodies against TUJ1 (red) and DAPI staining (blue), scale bar 50 μm. g, Conversion efficiency of cells shown in D based on TUJ1-positive cells with neuronal morphology highlight the deleterious effect of Sin3b knock-down on iN formation. n = 3, error bars = SE, t-test * p < 0.005.
Fig. ED9: Myt1l acts upstream of HES1 to repress Notch signaling and stabilise ASCL1.
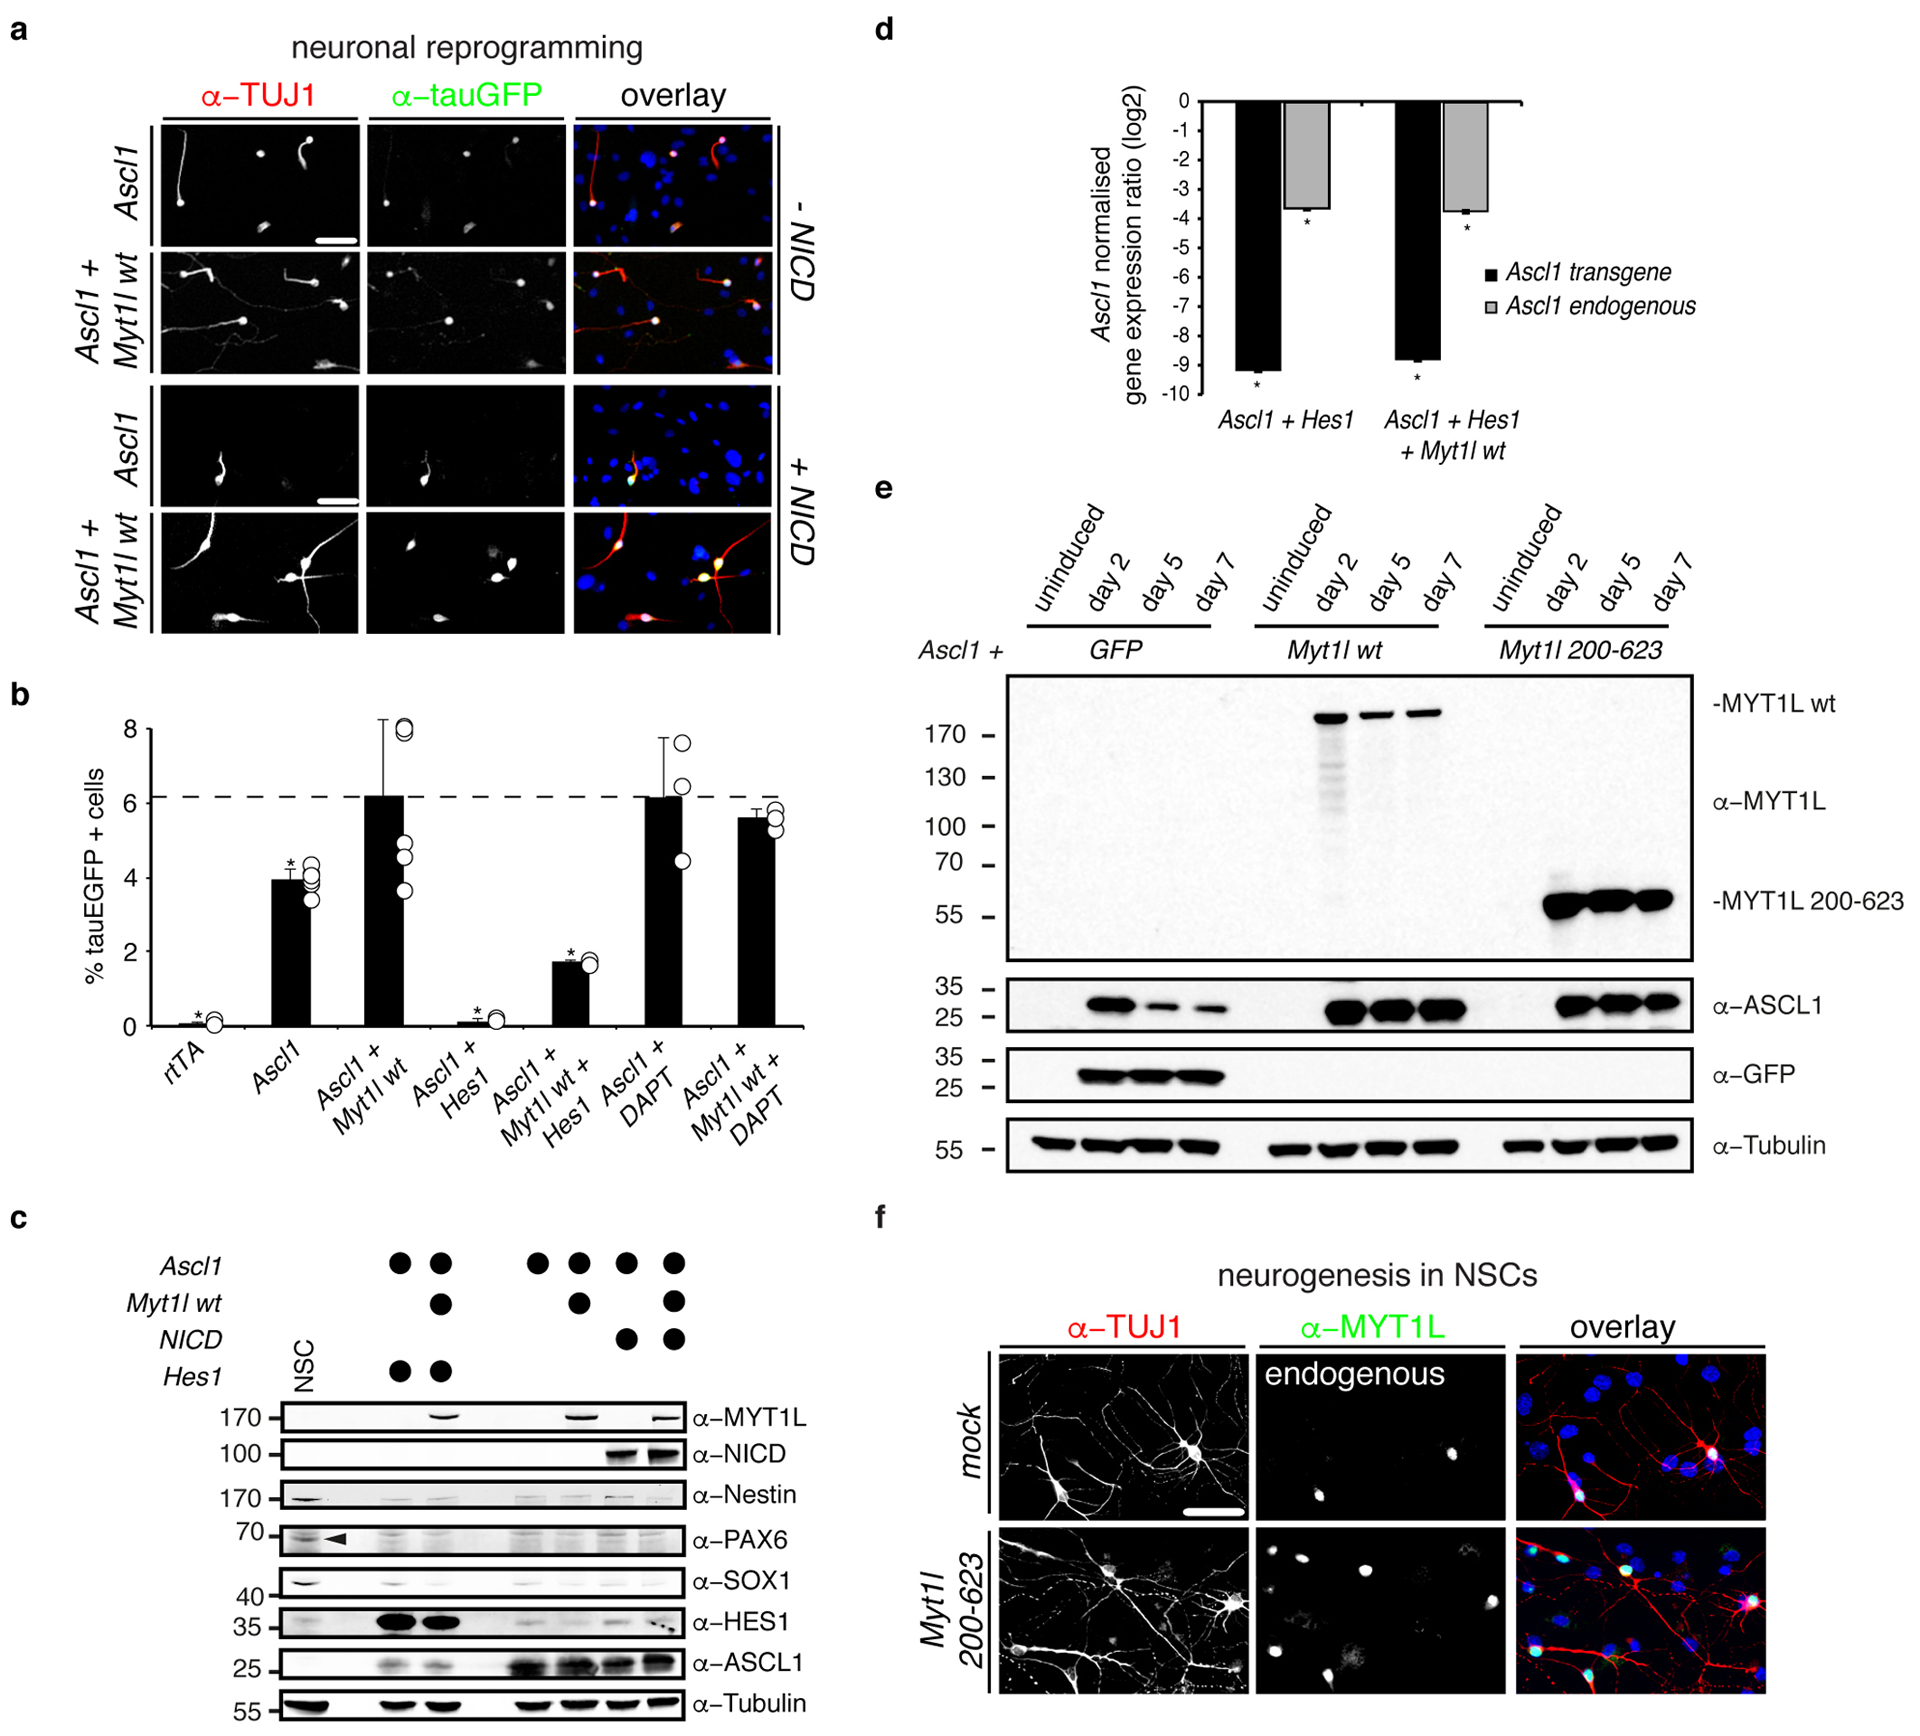
a, Immunofluorescence of iN cells quantified in Fig. 4a derived from MEFs upon reprogramming for 7 days with Ascl1 and either Myt1l wt, notch intracellular domain (+ NICD) or a combination; TUJ1 (red), tauEGFP (green), DAPI staining (blue), scale bar 50 μm. b, Neurogenic conversion efficiency of MEFs cells upon reprogramming for 7 days with Ascl1 together with either Myt1l wt (n = 6), Hes 1 (+ Hes1) (n = 3) or a combination of indicated transgenes or upon treatment with DAPT (10 μM) (n = 3) based on TauEGFP induction determined by flow cytometry. Dotted line indicates mean conversion efficiency of Ascl1+Myt1l, error bars = SD, t-test * p < 0.05. c, Western blot analysis of cells shown in A-B after two days of reprogramming and mouse neural stem cells (NSCs) using indicated antibodies shows no striking induction of the neural stem cell markers NESTIN, PAX6 (arrowhead) or SOX1 in any condition but strong reduction of ASCL1 upon Hes1 overexpression. d, Mean expression levels of endogenous and exogenous (overexpressed) Ascl1 transcript in MEFs upon overexpression of Ascl1 and Hes1 with or without Myt1l wt for two days determined by quantitative real time PCR show significant repression of both endogenous and exogenous Ascl1 by Hes1 overexpression independent of Myt1l. Expression levels were normalised to Ascl1 only induction and GAPDH expression, n = 4 biological replicates (with 4 technical replicates each), error bars = SE, pair wise fixed reallocation randomisation test * p < 0.00126. e, Western blot analysis of MEF cells upon induction of Ascl1 together with either GFP, Myt1l wt, or Myt1l 200–623 after 0, 2, 5, and 7 days upon reprogramming using antibodies against MYT1L, ASCL1, GFP, and Tubulin shows no striking induction of full length Myt1l upon overexpression of minimal fragment but stabilisation of ASCL1 levels. f, Immunofluorescence of neurons quantified in Fig. 4c derived from mouse neural stem cells (NSCs) upon differentiation for 7 days with rtTA alone (mock) or in combination with Myt1l 200–623; TUJ1 (red), Myt1l (green), DAPI staining (blue), scale bar 50 μm. Of note, all neurons formed in the control condition expressed endogenous Myt1l.
Fig. ED10: Myt1l maintains neuronal identity by repression of non-neuronal programs.
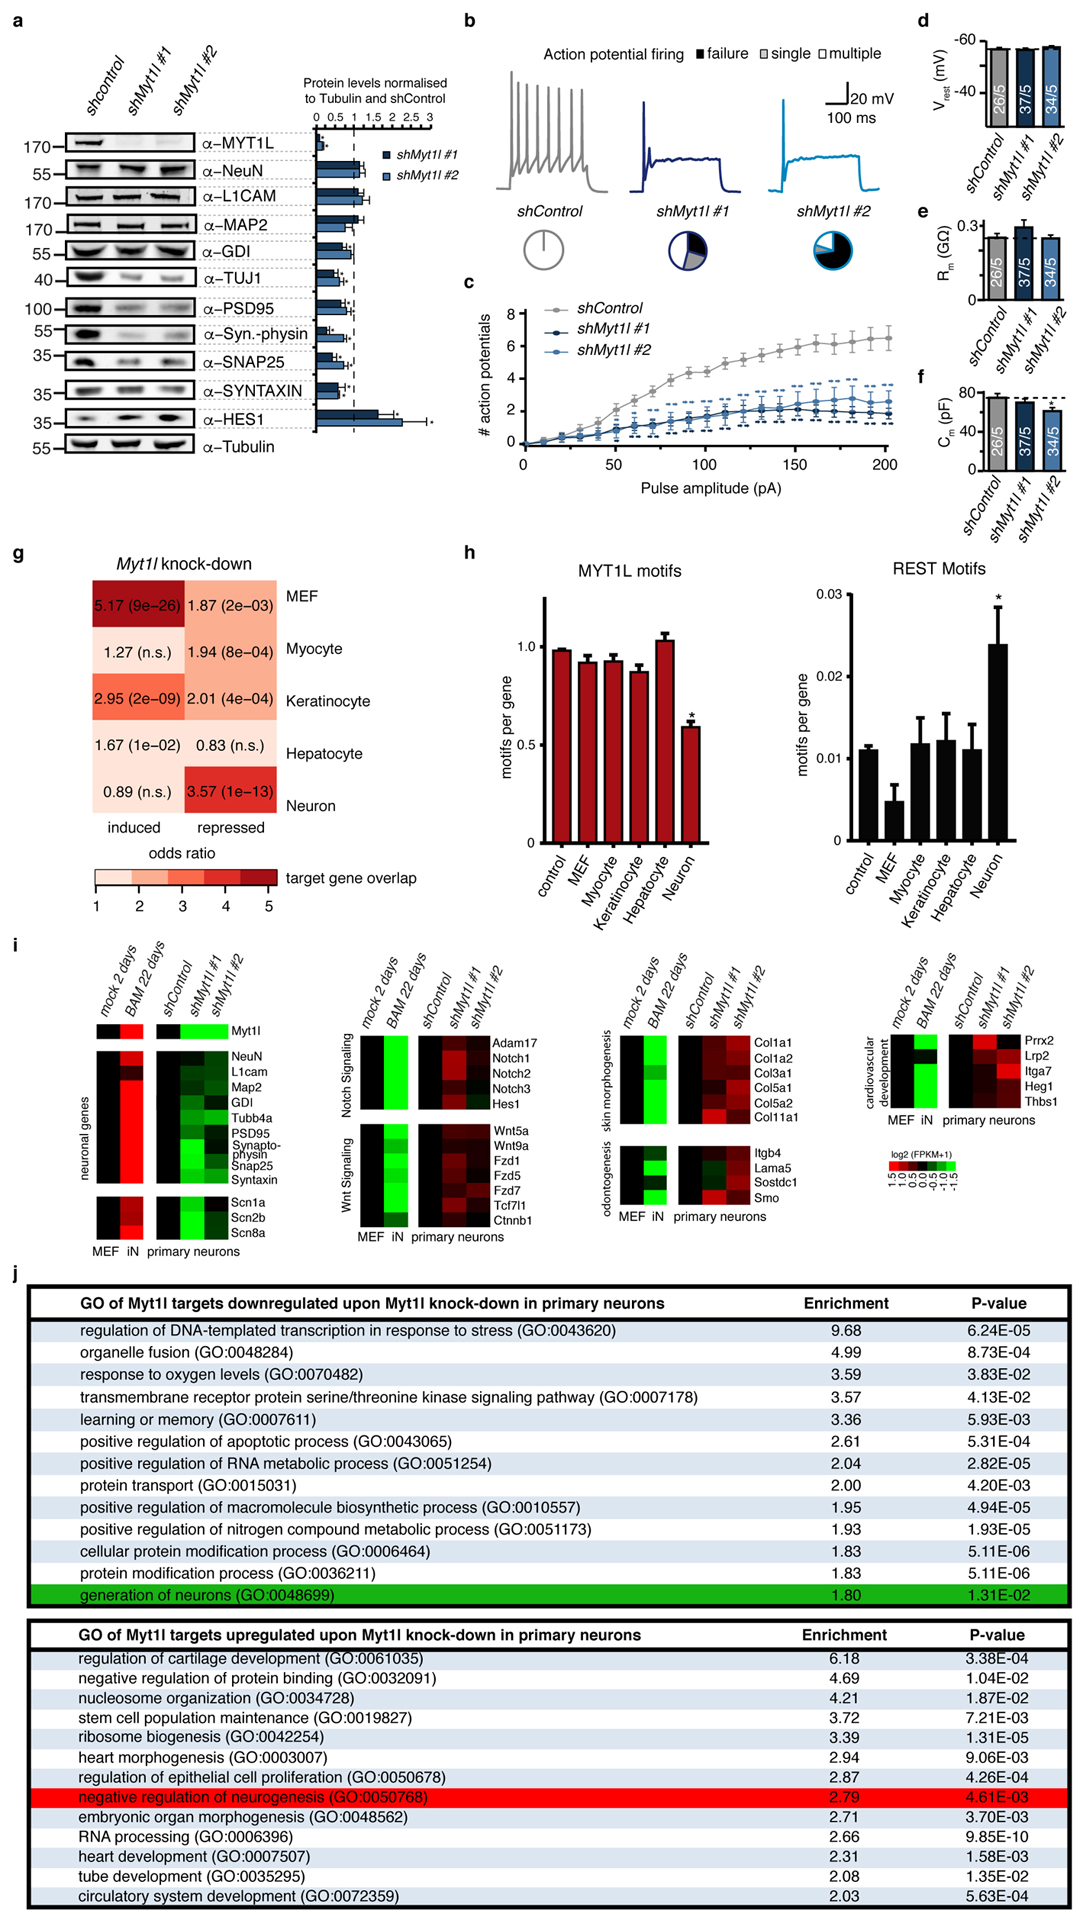
a, Myt1l knock-down in P0 mouse primary hippocampal neuronal cultures impairs neuronal maturation and maintenance. Cells were infected with shRNA-expressing lentivirus on third day of in vitro culture and analysed 11 days later by quantitative Western blot using indicated antibodies. While Tubulin served as loading control several neuronal markers are severely down-regulated by Myt1l depletion. Representative Western blot images are shown, n = 5, error bars = SEM, t-test * p < 0.05. b-f, Electrophysiological characterisation of Myt1l knock-down neurons derived in A. b, Representative action potential (AP) traces of hippocampal neurons upon indicated knock-down, pie charts indicate fraction of cells firing single (grey), multiple (white), or no (black) APs at the 90 pA pulse. c , Mean number of APs fired plotted with respect to pulse amplitude measured at −60 mV holding potential. d, Mean resting membrane-potential (Vrest). e, Mean membrane resistance (Rm) and f capacitance (Cm) measured at −70 mV holding potential. Dotted line indicates intrinsic properties upon shControl treatment, n = 5 biological replicates (total number of individual cells measured indicated), error bars = SE, t-test * p < 0.05. g, Myt1l knock-down in P0 mouse primary hippocampal neuronal cultures induces non-neuronal gene expression programs. Overlap of Myt1l bound target genes that are induced or repressed upon knock down of Myt1l in primary hippocampal neurons and indicated cell type specific expression signatures determined by GeneOverlap27. Odds ratio > 2 represents strong association, p-values are shown, n.s. = not significant. h, Relative number of Myt1l and REST DNA binding motifs at cell type specific genes highlight depletion of Myt1l and enrichment of REST motifs at neuronal genes, respectively (t-test * p < 0.005). i, RNA-seq analysis of genes shown in A, confirm decreased expression of neuronal genes upon Myt1l depletion. In addition several Notch and Wnt signaling factors that are direct targets of Myt1l are de-repressed (see also Fig. 2c). In addition transcription of several non-neuronal lineage specifiers is induced compared to the control. Shown are gene expression values of cells treated as in A based on RNA-seq, fold change is represented in logarithmic scale normalised to the shControl sample, n = 2. j, Selected top gene ontology (GO) terms of Myt1l targeted genes that are repressed (top) or induced (bottom) upon knock-down in primary hippocampal neurons determined by PANTHER28. Enrichment scores and p-values are shown. Highlighted are the terms “generation of neurons” (green) in the repressed cluster and “negative regulation of neurogenesis” (red) and in the induced cluster. In addition this analysis highlights induction of several non-neuronal gene expression programs upon Myt1l depletion.
Supplementary Material
Acknowledgements:
We acknowledge N.E. Davey for SID motif discovery, U. Litzenburger for initial in utero experiments and S. Marro and N. Yucel for primary cell preparations. We thank J.E. Johnson, T. Sudo, R. Kageyama, and T. Stearns for kindly providing antibodies and G. Mantalas, B. Passarelli, M. Miranda and M. Nguyen for sequencing. We thank A. Stark and Wernig lab members for ideas and discussions. Support was provided by the German Research Foundation to M.M., the NCI (#T32 CA09151), DHHS and the Spectrum Child Health Research Institute to M.S.K, the Swedish Research Council and Swedish Government Initiative for Strategic Research Areas (StemTherapy) to H.A., the National Institutes of Health and the California Institute for Regenerative Medicine. T.C.S. is a Howard Hughes Medical Institute Investigator. M.W. is a New York Stem Cell Foundation-Robertson Investigator.
Footnotes
Is available in the attached documents.
The authors declare no competing financial interests.
References:
- 1.Schäfer BW, Blakely BT, Darlington GJ & Blau HM Effect of cell history on response to helix-loop-helix family of myogenic regulators. Nature 344, 454–458 (1990). [DOI] [PubMed] [Google Scholar]
- 2.Terranova R, Pereira CF, Roure, Du, C., Merkenschlager, M. & Fisher, A. G. Acquisition and extinction of gene expression programs are separable events in heterokaryon reprogramming. J Cell Sci 119, 2065–2072 (2006). [DOI] [PubMed] [Google Scholar]
- 3.Xu J, Du Y & Deng H Direct lineage reprogramming: strategies, mechanisms, and applications. Cell Stem Cell 16, 119–134 (2015). [DOI] [PubMed] [Google Scholar]
- 4.Santisteban P, Recacha P, Metzger DE & Zaret KS Dynamic expression of groucho-related genes Grg1and Grg3in foregut endoderm and antagonism of differentiation. Dev Dyn 239, 980–986 (2010). [DOI] [PMC free article] [PubMed] [Google Scholar]
- 5.Schoenherr CJ & Anderson DJ The neuron-restrictive silencer factor (NRSF): a coordinate repressor of multiple neuron-specific genes. Science 267, 1360–1363 (1995). [DOI] [PubMed] [Google Scholar]
- 6.Matsushita F, Kameyama T, Kadokawa Y & Marunouchi T Spatiotemporal expression pattern of Myt/NZF family zinc finger transcription factors during mouse nervous system development. Dev Dyn 243, 588–600 (2014). [DOI] [PubMed] [Google Scholar]
- 7.Masserdotti G, Gascón S & Götz M Direct neuronal reprogramming: learning from and for development. Development 143, 2494–2510 (2016). [DOI] [PubMed] [Google Scholar]
- 8.Wapinski OL et al. Hierarchical Mechanisms for Direct Reprogramming of Fibroblasts to Neurons. Cell 155, 621–635 (2013). [DOI] [PMC free article] [PubMed] [Google Scholar]
- 9.Vierbuchen T et al. Direct conversion of fibroblasts to functional neurons by defined factors. Nature 463, 1035–1041 (2010). [DOI] [PMC free article] [PubMed] [Google Scholar]
- 10.Chanda S et al. Generation of induced neuronal cells by the single reprogramming factor ASCL1. Stem Cell Reports 3, 282–296 (2014). [DOI] [PMC free article] [PubMed] [Google Scholar]
- 11.Jiang Y et al. A novel family of Cys-Cys, His-Cys zinc finger transcription factors expressed in developing nervous system and pituitary gland. J Biol Chem 271, 10723–10730 (1996). [DOI] [PubMed] [Google Scholar]
- 12.Yee KS & Yu VC Isolation and characterization of a novel member of the neural zinc finger factor/myelin transcription factor family with transcriptional repression activity. J Biol Chem 273, 5366–5374 (1998). [DOI] [PubMed] [Google Scholar]
- 13.Besold AN, Oluyadi AA & Michel SLJ Switching Metal Ion Coordination and DNA Recognition in a Tandem CCHHC-type Zinc Finger Peptide. Inorg. Chem 52, 4721–4728 (2013). [DOI] [PMC free article] [PubMed] [Google Scholar]
- 14.Romm E, Nielsen JA, Kim JG & Hudson LD Myt1 family recruits histone deacetylase to regulate neural transcription. Journal of Neurochemistry 93, 1444–1453 (2005). [DOI] [PMC free article] [PubMed] [Google Scholar]
- 15.Spronk CA et al. The Mad1-Sin3B interaction involves a novel helical fold. Nat. Struct. Biol 7, 1100–1104 (2000). [DOI] [PubMed] [Google Scholar]
- 16.Grzenda A, Lomberk G, Zhang J-S & Urrutia R Sin3: master scaffold and transcriptional corepressor. Biochim Biophys Acta 1789, 443–450 (2009). [DOI] [PMC free article] [PubMed] [Google Scholar]
- 17.Vasconcelos FF et al. MyT1 Counteracts the Neural Progenitor Program to Promote Vertebrate Neurogenesis. Cell Reports 17, 469–483 (2016). [DOI] [PMC free article] [PubMed] [Google Scholar]
- 18.Bellefroid EJ et al. X-MyT1, a Xenopus C2HC-type zinc finger protein with a regulatory function in neuronal differentiation. Cell 87, 1191–1202 (1996). [DOI] [PubMed] [Google Scholar]
- 19.Kageyama R, Ohtsuka T, Shimojo H & Imayoshi I Dynamic Notch signaling in neural progenitor cells and a revised view of lateral inhibition. Nat. Neurosci 11, 1247–1251 (2008). [DOI] [PubMed] [Google Scholar]
- 20.Axelrod JD Delivering the lateral inhibition punchline: it’s all about the timing. Science Signaling 3, pe38–pe38 (2010). [DOI] [PubMed] [Google Scholar]
- 21.De Rocker N et al. Refinement of the critical 2p25.3 deletion region: the role of MYT1L in intellectual disability and obesity. Genet. Med 17, 460–466 (2015). [DOI] [PubMed] [Google Scholar]
- 22.De Rubeis S et al. Synaptic, transcriptional and chromatin genes disrupted in autism. Nature 515, 209–215 (2014). [DOI] [PMC free article] [PubMed] [Google Scholar]
- 23.Lee Y et al. Microduplications disrupting the MYT1L gene (2p25.3) are associated with schizophrenia. Psychiatr. Genet 22, 206–209 (2012). [DOI] [PMC free article] [PubMed] [Google Scholar]
- 24.Li W et al. Association study of myelin transcription factor 1-like polymorphisms with schizophrenia in Han Chinese population. Genes Brain Behav. 11, 87–93 (2012). [DOI] [PubMed] [Google Scholar]
- 25.Teif VB et al. Genome-wide nucleosome positioning during embryonic stem cell development. Nat Struct Mol Biol 19, 1185–1192 (2012). [DOI] [PubMed] [Google Scholar]
Associated Data
This section collects any data citations, data availability statements, or supplementary materials included in this article.


