

Abstract
Radio detection and ranging-based (radar) sensing offers unique opportunities for biomedical monitoring and can help overcome the limitations of currently established solutions. Due to its contactless and unobtrusive measurement principle, it can facilitate the longitudinal recording of human physiology and can help to bridge the gap from laboratory to real-world assessments. However, radar sensors typically yield complex and multidimensional data that are hard to interpret without domain expertise. Machine learning (ML) algorithms can be trained to extract meaningful information from radar data for medical experts, enhancing not only diagnostic capabilities but also contributing to advancements in disease prevention and treatment. However, until now, the two aspects of radar-based data acquisition and ML-based data processing have mostly been addressed individually and not as part of a holistic and end-to-end data analysis pipeline. For this reason, we present a tutorial on radar-based ML applications for biomedical monitoring that equally emphasizes both dimensions. We highlight the fundamentals of radar and ML theory, data acquisition and representation and outline categories of clinical relevance. Since the contactless and unobtrusive nature of radar-based sensing also raises novel ethical concerns regarding biomedical monitoring, we additionally present a discussion that carefully addresses the ethical aspects of this novel technology, particularly regarding data privacy, ownership, and potential biases in ML algorithms.
Keywords: Radar, machine learning, medicine, ethics, biomedical monitoring
I. Introduction
Early disease detection is crucial for successful treatment [1], [2], [3]. Therefore, simple and cost-effective biomedical monitoring tools are necessary, enabling a continuous assessment of a patient's state of health. Over the past decades, biomedical monitoring has transitioned from commonly invasive procedures, such as obtaining blood samples and subjective assessments based on human observation, to more objective, minimally – or even non-invasive – monitoring modalities, such as electrophysiology [4], motion capturing [5], [6], and wearable sensors [7], [8]. While these less disruptive methods allow the precise measurement of physiological parameters that enable reliable diagnosis and treatment monitoring, they have several limitations.
Even though current measurement setups are often non-invasive, they commonly still require the attachment of sensors, wires, or markers on the human body, which may interfere with human behavior during the measurement [9]. In addition, complex medical measurement devices, such as motion capture systems or polysomnographs (PSG), are cost intensive, and comprehensive examinations can often only be performed at locations with access to this technology. Furthermore, operating and maintaining these biomedical monitoring devices requires specially trained staff, which gives rise to considerable additional costs. Therefore, these measurements can only be conducted in major hospitals or outpatient specialized centers, thus solely allowing measurements at discrete points in time and only when the health condition is present in the patient. This hinders the seamless translation of laboratory measurements to more realistic, real-world environments. However, many chronic diseases would benefit from a continuous monitoring in real-world environments to better track disease progression and, consequently, adjust medication more efficiently [10].
In recent times, the trend in healthcare is advancing towards a widespread, technology-assisted, and personalized approach. This includes the introduction of continuous medical monitoring that fits seamlessly into everyday life and monitors peoples' behavior and their activities around the clock. This setup should reduce the patient's hospital stay and, at the same time, achieve better monitoring, thus enabling a better assessment of the health state [7], [11]. It has been demonstrated that measurements in a clinical setting do not necessarily reflect the values of measured parameters in a real-world setting [9]. One example of measurements influenced by the measurement setup is the so-called “white-coat hypertension”, in which a person's blood pressure readings are consistently higher when measured in a medical setting, compared to when it is measured in a more relaxed, non-medical environment [12]. Therefore, unobtrusive, or even unperceived, measurements have the potential to considerably enhance data quality.
In the dynamic field of biomedical monitoring, radio detection and ranging (radar) sensors play an important role in facilitating unobtrusive and contactless measurements. Their wave-based nature not only presents a significant alternative to traditional sensors but also mitigates obtrusiveness, thereby broadening the scope for gathering more comprehensive sets of real-world data [13]. Depending on the used frequencies, radar technology may be used for measurement applications in which the subject is occluded by clothing or other materials [14]. This distinct advantage over optical methods, in conjunction with the high sensitivity of radar-based methods, facilitates many applications that could only be addressed by wearable sensor solutions in the past. In contrast to wearables, radar systems enable long-term patient monitoring, thus allowing healthcare professionals to gain more insights into disease progression. In particular, technologically, highly advanced radar sensors are affordable for widespread use in home environments for everyday data collection. However, raw radar data are difficult to interpret, even for experts. Machine learning (ML) algorithms enable the recognition of patterns in radar data streams to extract various biosignals or analyze other inner states of humans. This not only allows the improvement of diagnostics but can also support medical staff in the prevention of diseases and improve biomedical monitoring.
Given the unique opportunities that radar-based sensing can offer for biomedical monitoring, we aim to bring this technology closer to the biomedical engineering community. For this reason, we present a tutorial on radar-based applications for biomedical monitoring, with special focus on applications that make use of ML to extract meaningful parameters. After introducing the fundamentals of radars (Section II) and ML (Section III), specific representations of radar data and its applications within medicine are introduced in Section IV. Section V gives an overview of the study planning to generate sufficient training data, which are essential for the ML process, and discusses the “dos and don'ts” within that scope. As with the introduction of every novel technology, the integration of radar technology into biomedical monitoring procedures raises ethical concerns. This aspect is discussed in Section VI, which highlights the ethical parameters and aspects of this technology. Then, Section VII addresses the categories of clinical relevance. Finally, Sections VIII and IX discuss the findings and conclude the tutorial paper, respectively.
II. Radar Fundamentals
Radar is a radiolocation technique that uses electromagnetic waves to determine distance, velocity, and the angle of objects relative to the radar site. The basic principle of a radar system can be easily explained. A microwave transmitter emits a radio signal – e.g., a short pulse-shaped wave via an antenna in the direction of an object. This signal is reflected by the object, and the reflected echo is received by the radar system [15]. By measuring the roundtrip time of flight (RTOF)  of the signal from the radar to the object and back – i.e., the time elapsed between transmitting the impulse and receiving the respective echo – the distance
  can be calculated using the following relationship:
 |
where  is the propagation speed of the electromagnetic wave, which is approximately
  in air. Therefore, the radar signal only needs
  to travel
  . The radar signal carrier frequency
  commonly used today is in the range of
  to
to  , with the vast majority of radar systems being used for biomedical sensing operating in the regulated industrial, scientific, and medical (IMS) frequency bands at
  [16],
[16],  [17], [18], [19], [20], [21], and
  [22], [23] or more recently also
  [24], [25] and
  [26], [27]. The wavelength
  of the radar signal is defined as follows:
 |
For a  radar, for instance, the wavelength is
  . The wavelength will be important in the further course of the explanations because, as we will see, it determines the radar accuracy, radar resolution, and applicability of radar systems. While this rather simple introduction may clarify the basic principle of radar operation, it reveals neither the most exciting measurement capabilities and characteristics of radar systems nor the actual hardware structure of the latter. To really understand biomedical radar systems, we take a closer look at the so-called continuous wave (CW) radar.
A. Continuous Wave (CW) Radar
The basic setup of a CW radar, also referred to as Doppler radar, is illustrated in Fig. 2. The oscillator generates a sine wave signal. With the angular frequency of the carrier signal  , amplitude
  , and zero phase
  , the transmit signal
  can be written as follows:
 |
Fig. 2.

Block diagram of the basic CW radar setup.
The receive signal  has the same form as the transmit signal
  ; however, it is delayed by the RTOF
  and has a notably lower amplitude. It is given as follows:
 |
The receive signal amplitude  depends on the target distance and the reflectivity of the object. In addition, we need to introduce a constant phase offset
  , first because the reflection from the object can cause a material-dependent phase change and second because of possible phase offsets in the radar hardware.
From a system theoretic perspective, the following mixing process that facilitates radar interpretation can be described as a simple complex-valued multiplication. Here, the receive signal is once multiplied with the transmit signal and once separately multiplied with its quadrature component shifted by  . Since the receive signal is a cosine term, a shift by
  transforms the quadrature component into a sine term. Based on trigonometric product-to-sum identities, this multiplication yields the so-called baseband signal
  , which is as follows:
 |
The low-pass filter after the mixer (Fig. 2) is used to suppress unwanted signal components at twice the carrier frequency.
The resulting baseband signal  is a constant, complex direct current value (i.e., a complex pointer) as long as the target distance
  is constant. However, if the target distance and, thus, the RTOF
  change with time, the phase argument of the baseband signal, which is given as follows, also changes:
 |
Considering the definitions of the wavelength (2) and the relation between travel time and distance, we see that a change of distance by only half a wavelength causes a phase rotation of  .
.
Measuring the phase with a statistical uncertainty of below  is usually not a problem in a well-designed radar [28], [29]. To better understand the relationship between the wavelength and phase, we present the following example using a radar system operating at a frequency of
  , resulting in a wavelength of
  : This means that a
  phase rotation corresponds to a distance change of about
  . This fine range sensitivity makes it possible, for instance, to detect microscopic movements on the body surface caused by pulsating blood flow [30]. In addition to capturing microscopic movements, it is also possible to measure larger motions, such as those involving limbs or other parts of the body. However, one drawback of the CW radar is the extremely low unambiguous range for tracking distance changes. This refers to the maximum target range measurable by the radar system while an unambiguous association with a specific distance can be ensured. For CW radar technology, this maximum unambiguous range is
  and, therefore,
  with respect to the prior example. Thus, tracking certain motions can span multiple phase cycles. Therefore, phase changes need to be tracked with a sufficient sampling rate fitted to the motion speed in order to reconstruct the total path length of the displacement. For instance, to measure the total displacement of the chest due to respiration (multiple centimeters) with a
  radar system, the Doppler phase needs to be sampled at least at every
  point of motion.
B. Doppler Principle
The phase argument of the baseband signal  is called the Doppler phase
[31], [32]. The derivative of the Doppler phase, given as
is called the Doppler phase
[31], [32]. The derivative of the Doppler phase, given as
 |
is called instantaneous Doppler frequency. If the target moves with constant radial velocity (i.e., only the vector component in the direction of the radar) toward or away from the radar, the Doppler phase changes linearly with time, and thus, its derivative is constant. If this is the case,  is constant and one can derive a scalar Doppler frequency value – e.g., by a Fourier transform (FT) of the baseband signal. In this case, we have the following:
 |
Thus, measuring the Doppler frequency is perfectly suited for measuring the target speed. Note that with a single antenna, only the radial velocity can be measured. The maximum unambiguous velocity, which describes the maximum speed that can be accurately measured without encountering velocity ambiguity, is limited by the sampling rate of the Doppler phase. Hence, to unambiguously measure the velocity of a foot kicking a ball at a maximum speed of  following the example of a
  signal frequency, the sampling rate of the Doppler phase needs to be at least at
  , which depicts twice the maximum occurring Doppler frequency.
It is important to precisely distinguish between the instantaneous Doppler frequency and the Doppler frequency. A Doppler frequency is the average value of the instantaneous frequency over a certain observation period. Very often, the Doppler frequency is determined by an FT, where the averaging is inherently done by the Fourier integral. However, an FT only provides a meaningful frequency estimate if the frequency values of the signal components are almost constant during the integration time. In an FT, the integration (or averaging) time equals the length of the signal that is Fourier transformed.
In biomedical applications, the target velocity – e.g., the cardiopulmonary body movements or the movement of the limbs, among others – is usually not constant or at least not constant over a meaningful observation time. Therefore, the determination of Doppler frequencies over longer sections of the CW radar baseband signal with the FT is rarely useful in biomedical settings. Instead, the baseband signal is divided into short sections, where the time duration  of the sections chosen is so short that constant velocities of all targets can be assumed in this observation period. In the so-called short-time Fourier transform (STFT), each signal section is Fourier transformed separately. If the temporal change of these individual spectra is plotted over time, it leads to a Doppler spectrogram [33].
The temporal change in the spectral composition of the radar baseband signal is called the micro-Doppler signature of a moving or rotating target [34], [35]. In Fig. 3(a), a typical Doppler spectrogram of a person moving with near-constant velocity away from the radar is illustrated. The characteristic micro-Doppler signature is clearly visible. While the person's torso exhibits an almost constant velocity, the limbs yield an undulating pattern. Whereas the most accurate representation of the target micro-Doppler signature is the direct use of the Doppler phase  or of the instantaneous Doppler frequency
  , the STFT is a suitable tool to estimate
  . It is especially useful when there is more than one moving target within the radar's detection range. This aspect will be discussed in Section II-C of this article.
Fig. 3.
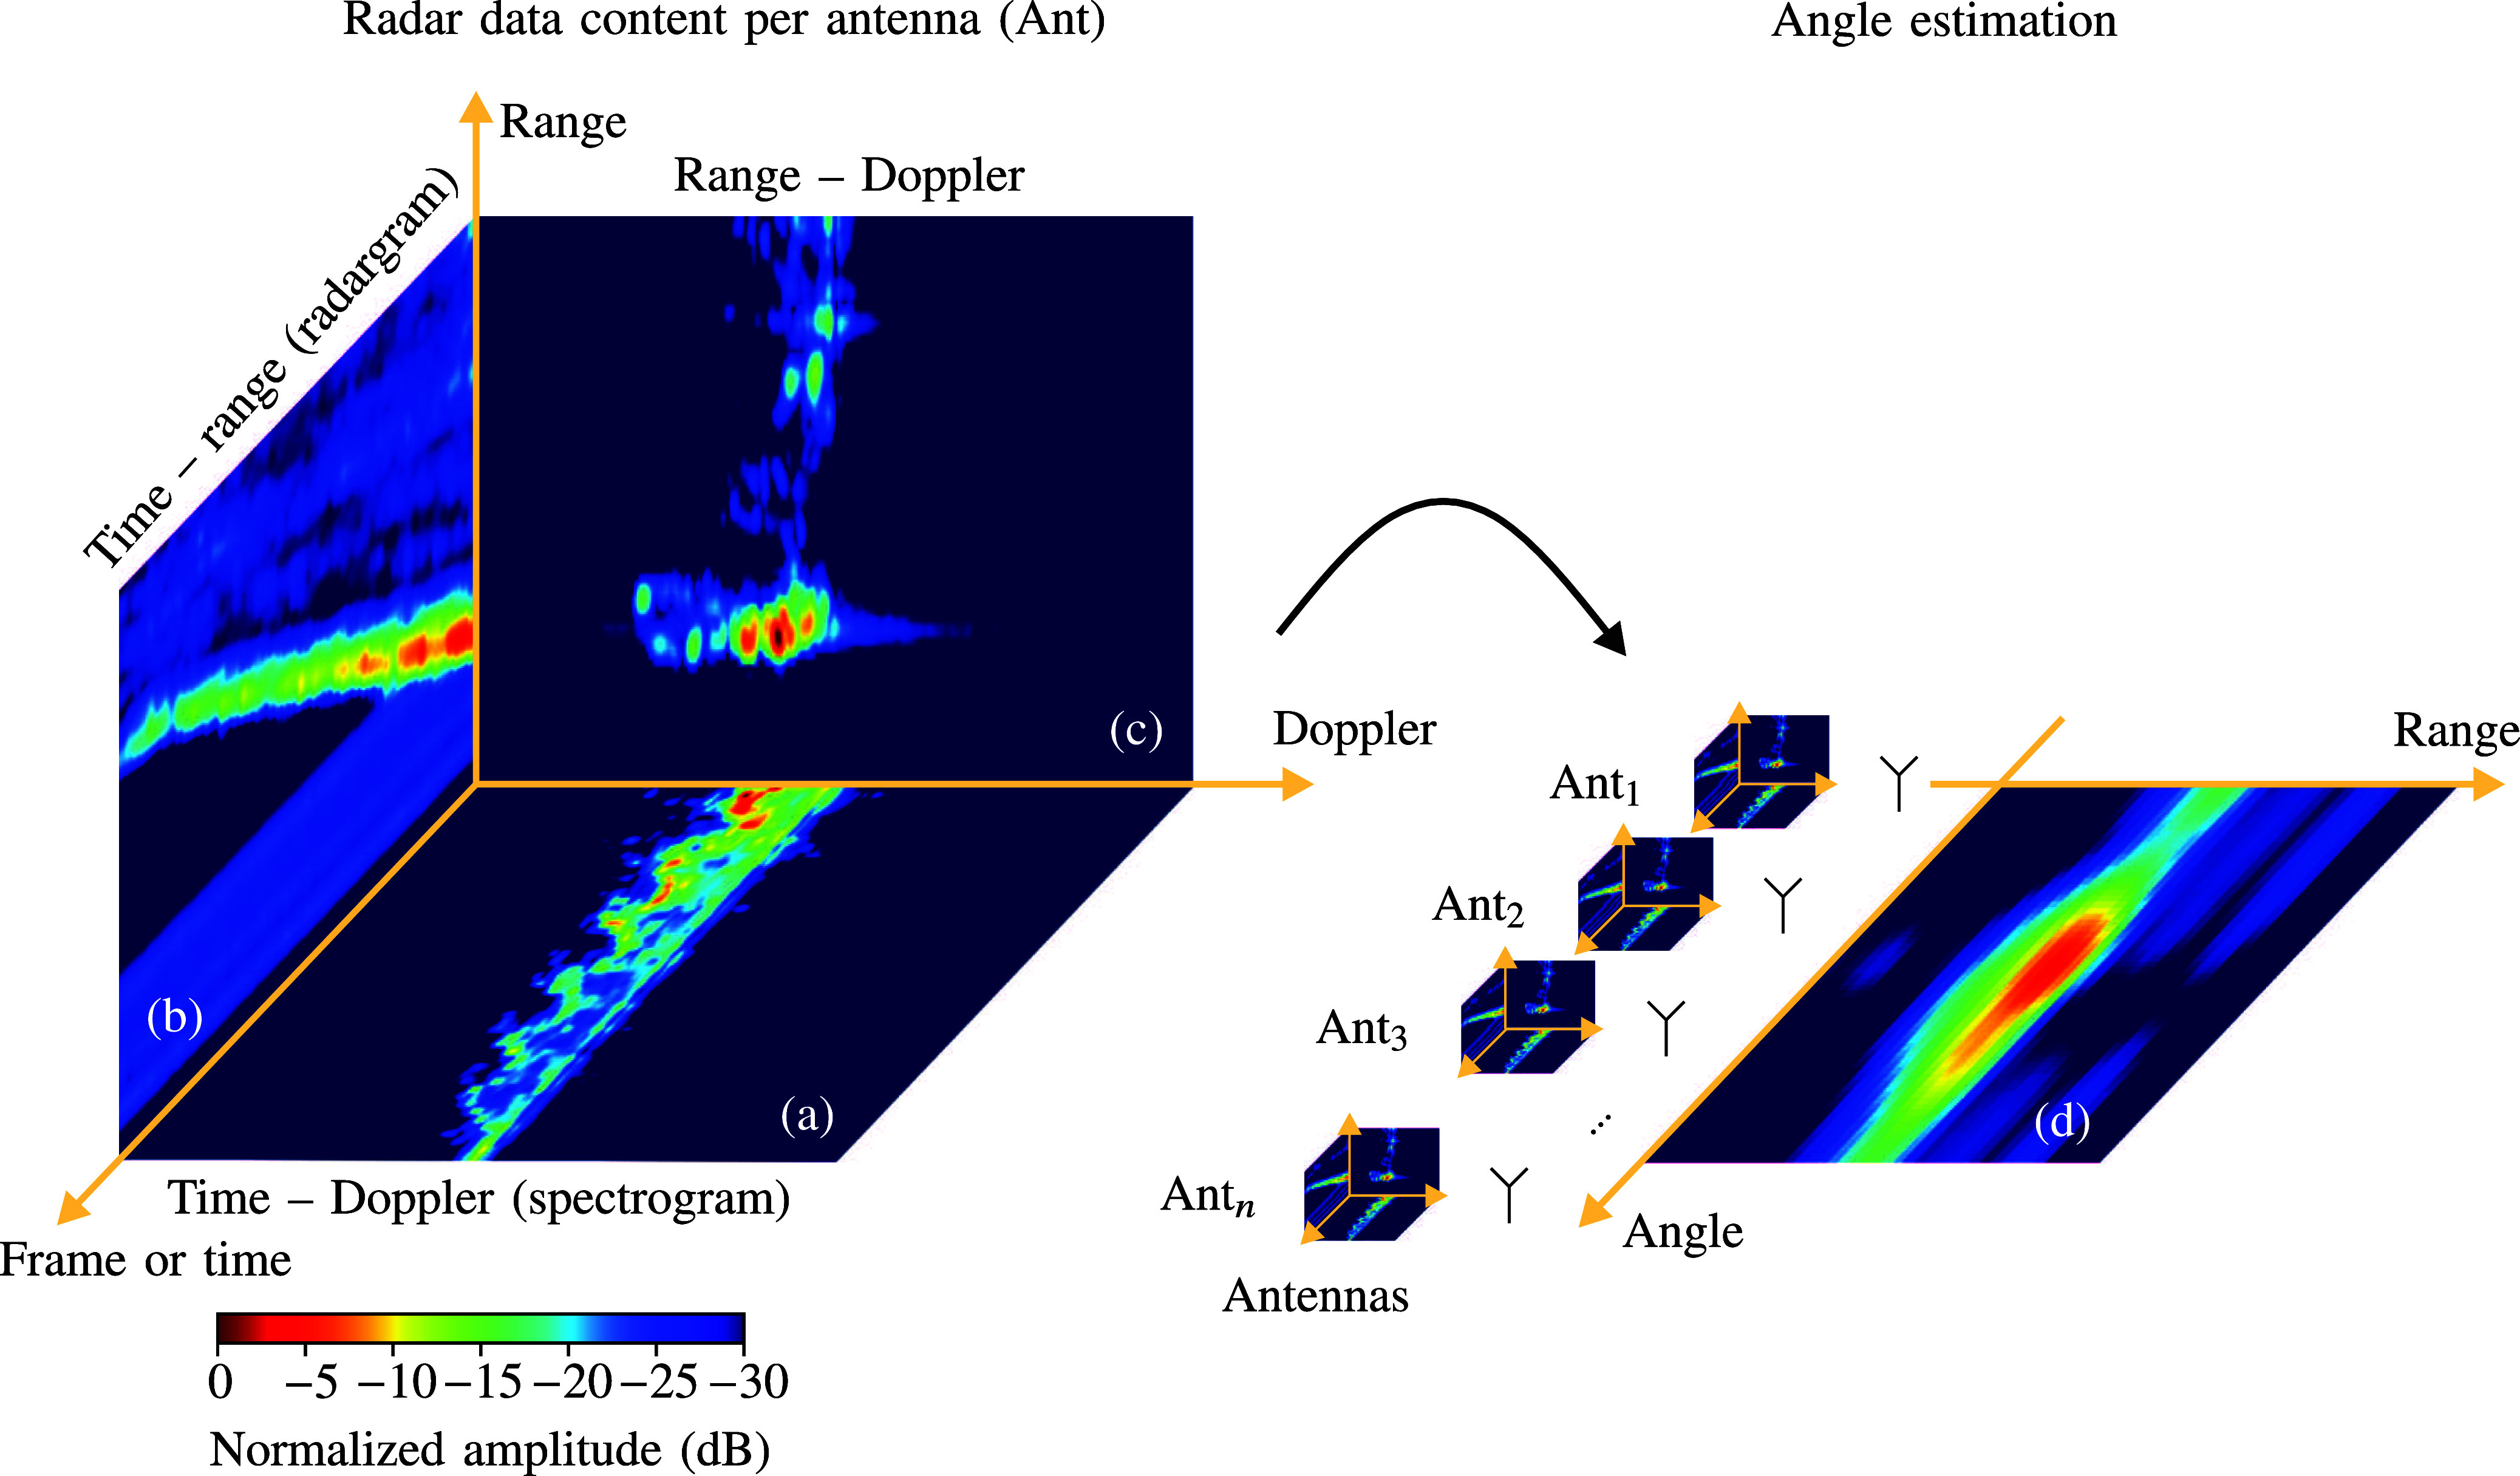
Radar data content overview: Here, a person is moving away from a radar system with almost constant velocity of approximately  . The sectional images are generated by summing up the remaining dimension. Stationary objects were removed using static clutter removal algorithms. (a) illustrates an exemplary Doppler spectrogram. The distinctive micro-Doppler signatures resulting from various body reflections with different velocity components during the walking activity are easily discernible. In (b), an exemplary radargram depicts the target's distance from the radar system over time. Reflections occurring beyond the dominant scatterers are attributed to multi-path effects. Further, undesirable horizontal smears stem from the hardware characteristics of the radar system. (c) illustrates an exemplary range – Doppler diagram. The superimposition of multiple reflections from distinct body parts, each exhibiting varied velocity components (e.g., torso or swinging arms), gives rise to micro-Doppler effects. Reflections extending clearly behind dominant body parts are attributable to multi-path effects. In (d), an angle image corresponding to the range – Doppler image in (c) is presented. The examination of the data from multiple antennas allows an accurate angle estimation.
C. Radar Resolution and Radar Data Content
If there is more than one moving target or scattering structure within the radar's detection range, the micro-Doppler signatures of all scattering structures will overlap. Thus, it is necessary to separate or resolve the different scattering structures. The ability to separate closely spaced structures is defined as the resolution of a radar. The available separation dimensions are instantaneous Doppler frequency, the radar viewing angle to the target, and the distance to the target. If a target can be resolved in one dimension, all attributes of the other dimensions corresponding to that specific target can be assigned.
If the above STFT is used, two targets can be separated if they have a velocity that differs more than the Doppler resolution  . The Doppler resolution when using STFT is inversely proportional to the time duration
  of the signal sections and can be estimated as follows [36]:
 |
The precise value of  depends on the used window function of the applied Fourier processing. If the Doppler frequencies of two targets differ by at least this value, they lie in the spectrum at different frequency bins and can, therefore, be distinguished.
The radar viewing angle facilitates the separation of the Doppler signatures of several body parts and prevents overlapping. Therefore, the radar signal is focused in an angular direction on a specific point of the body. The ability to focus a wave is determined by the size  of the radar antenna aperture related to the wavelength. The aperture is an equivalent area from which the waves emanate or on which the wave is received. Two targets can be separated in an angular dimension if their angle to the radar differs by more than the angular resolution
  . The latter is given as follows [36]:
 |
To obtain a good angular resolution, a radar system should have apertures with  . As a rule of thumb, an angular resolution of
  would require an aperture size of
  .
.
An aperture can be created by one physical antenna or by an antenna array. In medical applications, it is not always practical to mechanically direct a large physical antenna or antenna array to a specific point on the body. While this manual alignment may still be possible in stationary applications, where the person is sitting quietly on a chair or lying in bed, it is not applicable to scenarios where a person is moving. One solution to this problem is digital aperture synthesis. With the suitable selection of all transmit signal phases in an array or with a computational superposition of all receive signals of an array in a reconstruction algorithm, the radar signal can be focused on certain spatial areas. The most powerful variants are multiple-input multiple-output (MIMO) array apertures and synthetic aperture reconstruction algorithms [37], [38], by which a variety of different RTOFs is evaluated by many different antenna positions. This reconstruction process can be seen as an imaging process. By separating all scattering structures in the lateral dimension, an image of the target in lateral dimension is created. Commonly utilized MIMO radars employ the time-division multiplexing (referred to hereon as TDM-MIMO) principle, where each transmit antenna sequentially transmits its signal resulting in lower update (frame) rates and a decreased maximum unambiguous velocity. The unambiguous angle of a radar system is defined by the angle range where an unambiguous association of the target to a specific angle can be made. It is determined by the spatial spacing between antenna elements. To obtain a resolution in range, an impulse-shaped or modulated broadband radar signal is necessary.
A comprehensible way to understand how radar ranging and the target separation in the range is done is to look at a radar system concept referred to as coherent impulse Doppler radar
[15], which is depicted in Fig. 4. Compared to the simple Doppler setup in Fig. 2, a pulse generator that modulates the sinusoidal carrier signal with a pulse-shaped envelope  has been added. The impulse transmitted by the radar is given as follows:
 |
Fig. 4.

Setup of a coherent impulse Doppler radar.
Using the same mathematics as before, the final baseband signal can be calculated as follows:
 |
If there are  targets within the radar's detection range, the so-called radar echo profile is a superposition of the echoes of all
  reflecting structures, which all have different RTOFs:
 |
The echoes can be separated in range if their maxima are still recognizable from the superimposition of the envelopes, resulting in a distinct maximum for each target. It can be shown that the width of the envelope  is inversely proportional to the signal bandwidth
  of the baseband signal
  in (12). Thus, the radial range resolution
  of a radar system is given as follows [15],
 |
The exact value of the range resolution depends on the actual envelope shape and other signal properties. Furthermore, it becomes clear that CW radar systems do not offer any range resolution as they lack system bandwidth. Based on the above formula and also by looking at Fig. 5, it is obvious that the distance to the targets can be determined by evaluating the envelope positions alone. When the targets move, their echo envelopes move as well. When a successively measured sequence of echo profiles and the variation of the echo positions are plotted over time, this two-dimensional representation is called a radargram. A typical radargram from a person moving away with almost constant velocity from the radar is visualized in Fig. 3(b).
Fig. 5.

Envelope and phase of an exemplary radar echo profile.
The unambiguous range that can be measured is determined by the pulse repetition interval, which is defined by the time delay between successive pulse emissions. A longer pulse repetition interval allows for an unambiguous association of the pulse with a specific distance. Therefore, in contrast to CW radars, an impulse Doppler radar offers an unambiguous range information that is proportional to the pulse repetition interval.
As we can derive from (13), each radar echo does not only have an envelope  but also a phase
  . The phase is exactly the one discussed in the CW radar section. Thus, if sequential radar measurements are done, all of the above Doppler evaluations can also be performed. It is required that the measurements are performed in such a rapid succession that the sampling theorem for the highest occurring Doppler frequency is not violated. Otherwise, ambiguities in the velocity measurement may1 occur. When the range profile is plotted in one dimension and the STFT over the Doppler signature in the other dimension, this is called a range–Doppler diagram. A typical range–Doppler diagram is depicted in Fig. 3(c).
It is very important to note that the mentioned radar resolution values have to be strictly separated from the technical terms “measurement accuracy” and “precision”. As soon as a target can be resolved, the measurement precision and especially the accuracy of the measured distance, angle, and velocity values are orders of magnitude better than the resolution limits in a well-designed and well-calibrated radar. The possible accuracy can be estimated via the Cramer Rao lower bound, which is influenced by the radar resolution; however, ultimately, it is limited only by the signal-to-noise ratio of the baseband signal [39], [40].
It should also be noted at this point that the coherent impulse Doppler radar principle is by far not the most frequently used concept in the field of medical technology. In this article, we chose this principle because it is the easiest to understand and allows us to derive common radar signal representations. The most commonly used commercial radar principle today is the frequency modulated continuous wave (FMCW) or stepped frequency continuous wave (SFCW) radar [15], [41]. If impulse radar systems are used in the medical area, very often, ultrawideband (UWB) systems are used, and the so-called sequential sampling impulse radar concept is applied [33], [42].
In simple terms, FMCW or SFCW radars use the same impulse response measurements as impulse radars; however, this does not happen in the time domain but in the frequency domain. Thus, a wide signal bandwidth is achieved by modulating the transmitted frequency as opposed to relying on short pulses, which also exhibit a high signal bandwidth when transformed into the frequency domain. From the system theory, it is known that one can switch back and forth between the two domains (i.e., system impulse response vs. system transfer function) at any time via a Fourier transformation. Thus, after Fourier transforming the baseband signal of an FMCW radar, one gets nearly the same echo profile as represented in (13). Since the evaluation of the distance to the target in FMCW radar takes place in the frequency domain, a frequency shift induced by the Doppler effect is superimposed on the signal. Therefore, Doppler effects must be considered already within a single measurement. This is the only small difference; however, it is relatively easy to take into account. If many successive FMCW measurements are carried out one after the other and evaluated together, it is called the FMCW chirp sequence radar or fast chirp radar method [43], [44]. In this case, the range–Doppler diagram can be computed efficiently from the two-dimensional Fourier transform of the raw radar data. In terms of resolution and sensitivity, which describes the radar's ability to detect small distance changes, this is one of the best-performing radar variants today. However, CW radars may outperform this type of radar in terms of sensitivity due to the lower noise contribution of their components.
If range resolution is combined with lateral resolution, it is even possible to obtain a 3D image of the target scene. In addition, as explained above, each voxel can be assigned a Doppler frequency or a micro-Doppler signature. This results in a multidimensional raw radar data representation in the form of a hypercube, which is referred to as radar cube. To offer a visual representation of the content of a radar cube, Fig. 3 provides a comprehensive overview. Each frame is equipped with information on the range, Doppler, and amplitude through a single antenna. By assessing the phase changes across multiple antennas, the system can also perform an angle estimation, as shown in Fig. 3(d). A comprehensive comparison of the common radar principles relevant to human motion detection is presented in Table I. For a general overview, the most important terms related to radar are summarized in Table II.
TABLE I. Comparison of Common Radar Concepts Used for Human Motion Detection: Continuous Wave (CW), Impulse Doppler, Frequency Modulated Continuous Wave (FMCW), Stepped Frequency Continuous Wave (SFCW) and Time-Division Multiplexing Multiple-Input Multiple-Output (TDM-MIMO) FMCW. Metrics:  : Excellent;
  : High;
  : Moderate;
  : Low;
  : Number of Transmit Antennas.
| Radar Concepts used for Human Motion Detection | |||
|---|---|---|---|
| 1) CW | 2) Impulse Doppler / FMCW / SFCW | 3) TDM-MIMO combined with FMCW | |
| Velocity resolution | Yes | Yes | Yes |
| Range resolution | No | Yes | Yes |
| Angle resolution | No | No | Yes |
| Unambiguous velocity |

|

|
 (dependent on (dependent on  ) ) |
| Unambiguous range |

|

|

|
| Sensitivity |

|

|

|
| Update rate |

|

|
 (dependent on (dependent on  ) ) |
TABLE II. Overview of Technical Radar Terms and Definitions.
| Overview of Technical Radar Terms and Definitions | |
|---|---|
| Doppler frequency | Instantaneous Doppler frequency averaged over a specific observation period for a target moving at constant speed |
| Doppler phase | The instantaneous phase of a radar echo |
| Doppler spectrogram | The representation of the change of velocity spectrum over time |
| Instantaneous Doppler frequency | The derivative of the Doppler phase |
| Micro-Doppler signature | The temporal course of the instantaneous Doppler frequency or Doppler phase characteristic for a moving object |
| Precision | Statistical variation of several measurements under identical conditions |
| Radargram | The representation of the change of radar echo profile over time |
| Radar accuracy | How close a measurement is to its true value |
| Radar Doppler spectrogram | The representation of the change of Doppler spectrum over time |
| Radar echo profile | The representation of the echo amplitude and/or phase over distance |
| Radar resolution | The ability to separate closely adjacent targets in range, angle, or Doppler dimension |
| Radar sensitivity | The ability to detect small distance changes |
| Range – angle profile | The two-dimensional display of the target distance (dim. 1) and the azimuth or elevation angle (dim. 2) |
| Radar cube | Radar data hypercube representation with its dimensions amplitude, range, azimuth/elevation angle, and Doppler |
| Range – Doppler profile | The two-dimensional display of the target distance (dim. 1) and the Doppler frequency (dim. 2) |
| Unambiguous range | The maximum distance that the radar is able to measure unambiguously |
| Unambiguous velocity | The maximum target speed that is unambiguously measurable by the radar |
| Update rate | The frequency at which the radar system provides a new measurement frame |
It is obvious that this radar cube contains an enormous information content. Most of the information relevant to biomedical measurements is contained in the micro-Doppler signatures. Unfortunately, this part is mostly inaccessible for human visual perception because our brain is primarily trained for two-dimensional optical imaging. Neural networks, however, give us the ideal tool to comprehensively evaluate the multidimensional data treasure that radar technology offers. To better understand how ML can be used to extract meaningful information, we will introduce the fundamentals of ML and deep learning (DL) in the following section.
III. Machine Learning and Deep Learning Models
Due to the multidimensional nature of the underlying radar data, one of the most promising ways to process and evaluate them is the use of ML algorithms. Generally, ML is one sub-field of artificial intelligence (AI) that enables computers to learn and improve without being explicitly programmed [82]. This involves the development of algorithms that enable machines to make predictions or identify patterns based on data. The general approach, which is visualized in Fig. 6, includes data pre-processing, feature extraction, and classification [82]. As DL models can inherently learn features and pre-processing steps, this is represented by dashed lines. Conversely, classical ML approaches commonly require explicit pre-processing and expert feature engineering. These single steps will be explained in the following sections.
Fig. 6.
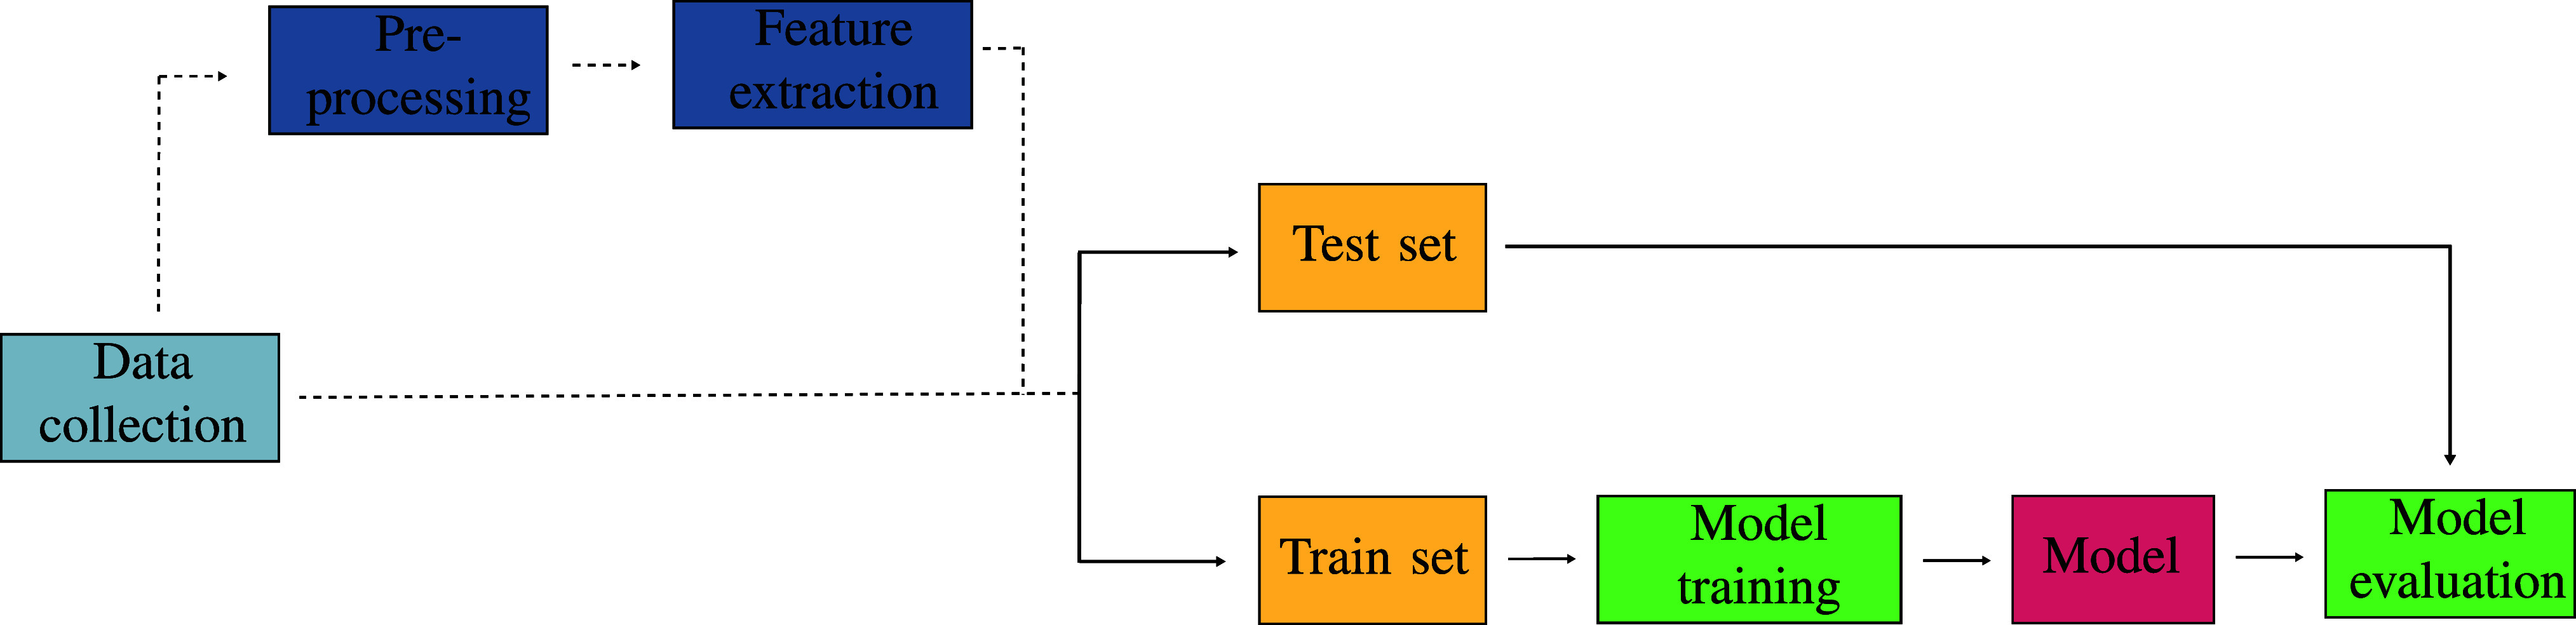
The typical ML pipeline consists of data collection and pre-processing, followed by feature extraction to enhance input features. As DL models can inherently learn features and pre-processing steps from raw sensor data, this is represent by dashed lines. Following this, the model is trained using the training data and evaluated on a separate test set.
A. Pre-Processing and Feature Extraction
The first crucial step in creating robust models is pre-processing the raw radar data. This should include filtering, noise suppression, and the handling of outliers, as well as dealing with missing data points and the synchronization of data streams. As raw sensor data is often complex and contains redundant information, the extraction of features containing relevant information for the specific task is essential. Expert knowledge plays a key role in this process as handcrafting proper features can enhance the models' ability to discover relevant patterns and to make accurate predictions [82].
Some ML algorithms rely on distance metrics to calculate the distance between different data points in an n-dimensional feature space. Those algorithms commonly lack prediction performance when incorporating high-dimensional features. One reason for this is that data points become increasingly sparse in high-dimensional spaces, which makes meaningful distance calculations more difficult. Thus, dimensionality reduction techniques are required [61], which, among others, can involve applying algorithms such as the principle component analysis or feature selection methods that rank features according to their information content and the redundancy (e.g., correlation between features, chi-square test, or mutual information) [82]. Furthermore, ensuring that the features are on a consistent scale is a critical aspect of feature engineering in distance-based algorithms. Scaling methods, such as min-max scaling or z-score normalization, mitigate the impact of features with different magnitudes [82].
B. Supervised Vs. Unsupervised Learning
To create ML models, training is required, which can be performed in a supervised and an unsupervised approach. For supervised learning, the correct output for the training data is known, and the model is trained to determine these outputs as accurately as possible. Therefore, to train supervised ML algorithms, each data point needs to have an associated label. During the training phase, the algorithm optimizes its parameters to minimize the disparities between its predictions and the actual target labels [83]. In unsupervised learning, this information is not available. Thereby, the primary use case is to discover patterns, relationships, and inherent trends within a dataset [83]. For most applications in radar-based biomedical monitoring, ML models are trained with radar data that is recorded in combination with ground truth data. Therefore, we focus on supervised ML in the rest of this section.
C. Classification or Regression Problems
In supervised learning, most ML algorithms can be used for classification or regression tasks. In classification, the outcome is represented as a discrete label, while regression tasks provide continuous output [83]. This continuous output can then be rounded to discrete values such as disease severity scales.
In the context of biomedical monitoring, classification tasks are commonly used for diagnostic purposes, whereas regression tasks can help to monitor the disease progression by estimating the disease severity over time.
D. Choice of ML Algorithms
In simple terms, ML algorithms can be grouped into classical ML and DL techniques. The classical ML models typically have a simpler architecture with fewer parameters to optimize, while DL models can have a deep and hierarchical architecture with multiple layers. Because DL models are fundamentally inspired by the human brain, composed of interconnected neurons, these models are also referred to as neural networks. Each connection between the different neurons has an associated weight, which determines the impact of the connection [84]. Tables III and IV give an overview on frequently used classical ML and DL algorithms, while Fig. 7 displays a selection of greater relevance of those ML (k-nearest neighbor algorithm (kNN), random forest algorithm) and DL (autoencoder, long-short-term memory (LSTM), convolutional neural network (CNN)) algorithms.
TABLE III. Frequently Used Classical ML Algorithms in Radar-Based Applications for Biomedical Monitoring With Relevant Papers in the Rightmost Column.
| Overview of classical ML algorithms. | ||
|---|---|---|
| K-nearest neighbors (kNN) | The kNN algorithm is a simple but computationally efficient algorithm used mainly for classification tasks. The algorithm clusters the training data into subsets and assigns new data to the class with the majority of nearest neighbors. Mostly, the classifier is used due to its simplicity and short computation time. However, complex relationships are difficult to learn [45]. A schematic explanation of the algorithm can be found in Fig. 7(a). | [46], [47], [48], [49], [50] |
| Random forest | random forests are frequently used ML algorithms used for both regression and classification tasks. They describe the combination of multiple randomized decision trees, where the predictions are determined by a majority vote for classification tasks and by averaging for regression tasks [51]. A visual representation of the random forest algorithm is provided as found in Fig. 7(b) | [52], [53], [54], [55] |
| Naive Bayes | The naive Bayes algorithm is a probabilistic classification algorithm based on Bayes' theorem. Thereby, Bayes' theorem is used to determine the probability of a label based on prior knowledge of conditions associated with the event. The term naive comes from simplifying the computation with the assumption that the features used are input independent of each other [56]. | [49], [50], [53] |
| Logistic regression | Logistic regression is used for binary classification tasks, where the output is a categorical variable with two classes. As a decision based on a linear function is highly susceptible to outliers, it will not perform well in classification tasks. Therefore, the output values are fed to a sigmoid function that returns probabilities. Based on a pre-defined threshold, we can obtain the classification [57]. | [49], [53], [58] |
| Linear regression | Linear regression is one of the simplest ML algorithms and is used to model a continuous output variable (dependent variable) based on one or more input features (independent variable) as a linear equation [59]. | [50], [60] |
| Support vector machine (SVM) | SVMs are used for classification tasks. The decision function of an SVM determines a linear or non-linear hyperplane that can be used to predict the class label for unseen data. In this process, the decision function aims to maximize the margin between the class labels. As SVM classifiers typically work worse in high-dimensional feature spaces, feature selection methods should be applied [61]. The regressor counterpart of an SVM is named support vector regression. | [49], [50], [53], [54], [55], [62] |
TABLE IV. Frequently Used DL Algorithms in Radar-Based Applications for Biomedical Monitoring With Relevant Papers in the Rightmost Column.
| Overview of DL Algorithms | ||
|---|---|---|
| Autoencoder | Autoencoder are neural networks that are used to efficiently process data. By introducing a bottleneck between the encoder and decoder structure, a low-dimensional representation is imposed that can be used for data compression, feature extraction, denoising, or data generation. Special attention needs to be paid to the bias-variance trade-off that balances the reconstruction and generalization capabilities [63]. | [64], [65] |
| Long short-term memory (LSTM) | LSTMs are a special type of RNN focussing on long-term dependencies, making them suitable for sequence prediction tasks. The network commonly consists of three gates: The forget gate determines how much information of the previous time stamp is to be remembered; the input gate introduces new information from the current time step, whereas in the output gate, the updated information is passed to the next time step [66]. | [54], [55], [67], [68], [69] |
| Convolutional neural network (CNN) | CNNs are feed-forward neural networks inspired by biological neurons, which are frequently used to find patterns in images, but also for classifying audio, time series, and other biosignal data. Typically, a CNN consists of different layers: Convolutional layers with only local connections and pooling layers to perform downsampling and dimensionality reduction; this results in a smaller number of parameters and faster convergence. The fully connected layers at the end are used to specify the intended output [70]. | [55], [71] |
| U-Net | U-Net is a neural network based on a fully convolutional network with an encoder–decoder structure, which is commonly used for efficient medical image segmentation. By using skip connections from the encoder to the decoder part, it combines the high-level feature maps from the decoder and the corresponding low-level details from the encoder [72]. | [49] |
| Transformer | Transformers are neural networks for sequence-to-sequence tasks that are well suited to learning long-term dependencies. This solves the common problems of RNNs such as vanishing gradients or maintaining old connections in long sequences. By introducing self-attention layers that weigh each input sequence by its importance, the vanishing gradient problem can be solved. Furthermore, as the attention layers are independent of each other, parallelization can be applied, reducing the duration of training [73]. One special type of Transformer is called Vision Transformer, where input images, such as feature maps from radar data, are split into patches and linearly embedded to create a sequence of vectors. These are then further processed by Transformer encoder layers to capture both local and global relationships. The main advantages of using VITs are the better understanding of global contexts as well as the scalability. Furthermore, as to the self-attention maps can be overlaid with the input image, it is visible which regions of the image are considered most important. This makes it easier to understand and interpret the models' decision [74]. | [75], [76], [77], [78], [79] |
| Multilayer perceptron (MLP) | MLPs are fully connected feed-forward neural networks used for regression and classification tasks. They consist of an input layer, an output layer, and one or more hidden layers. After each training step, the respective weights are updated using back-propagation to minimize a cost function. MLPs can handle large amounts of data and model complex non-linear relationships between input and output data [80]. | [75], [81] |
Fig. 7.
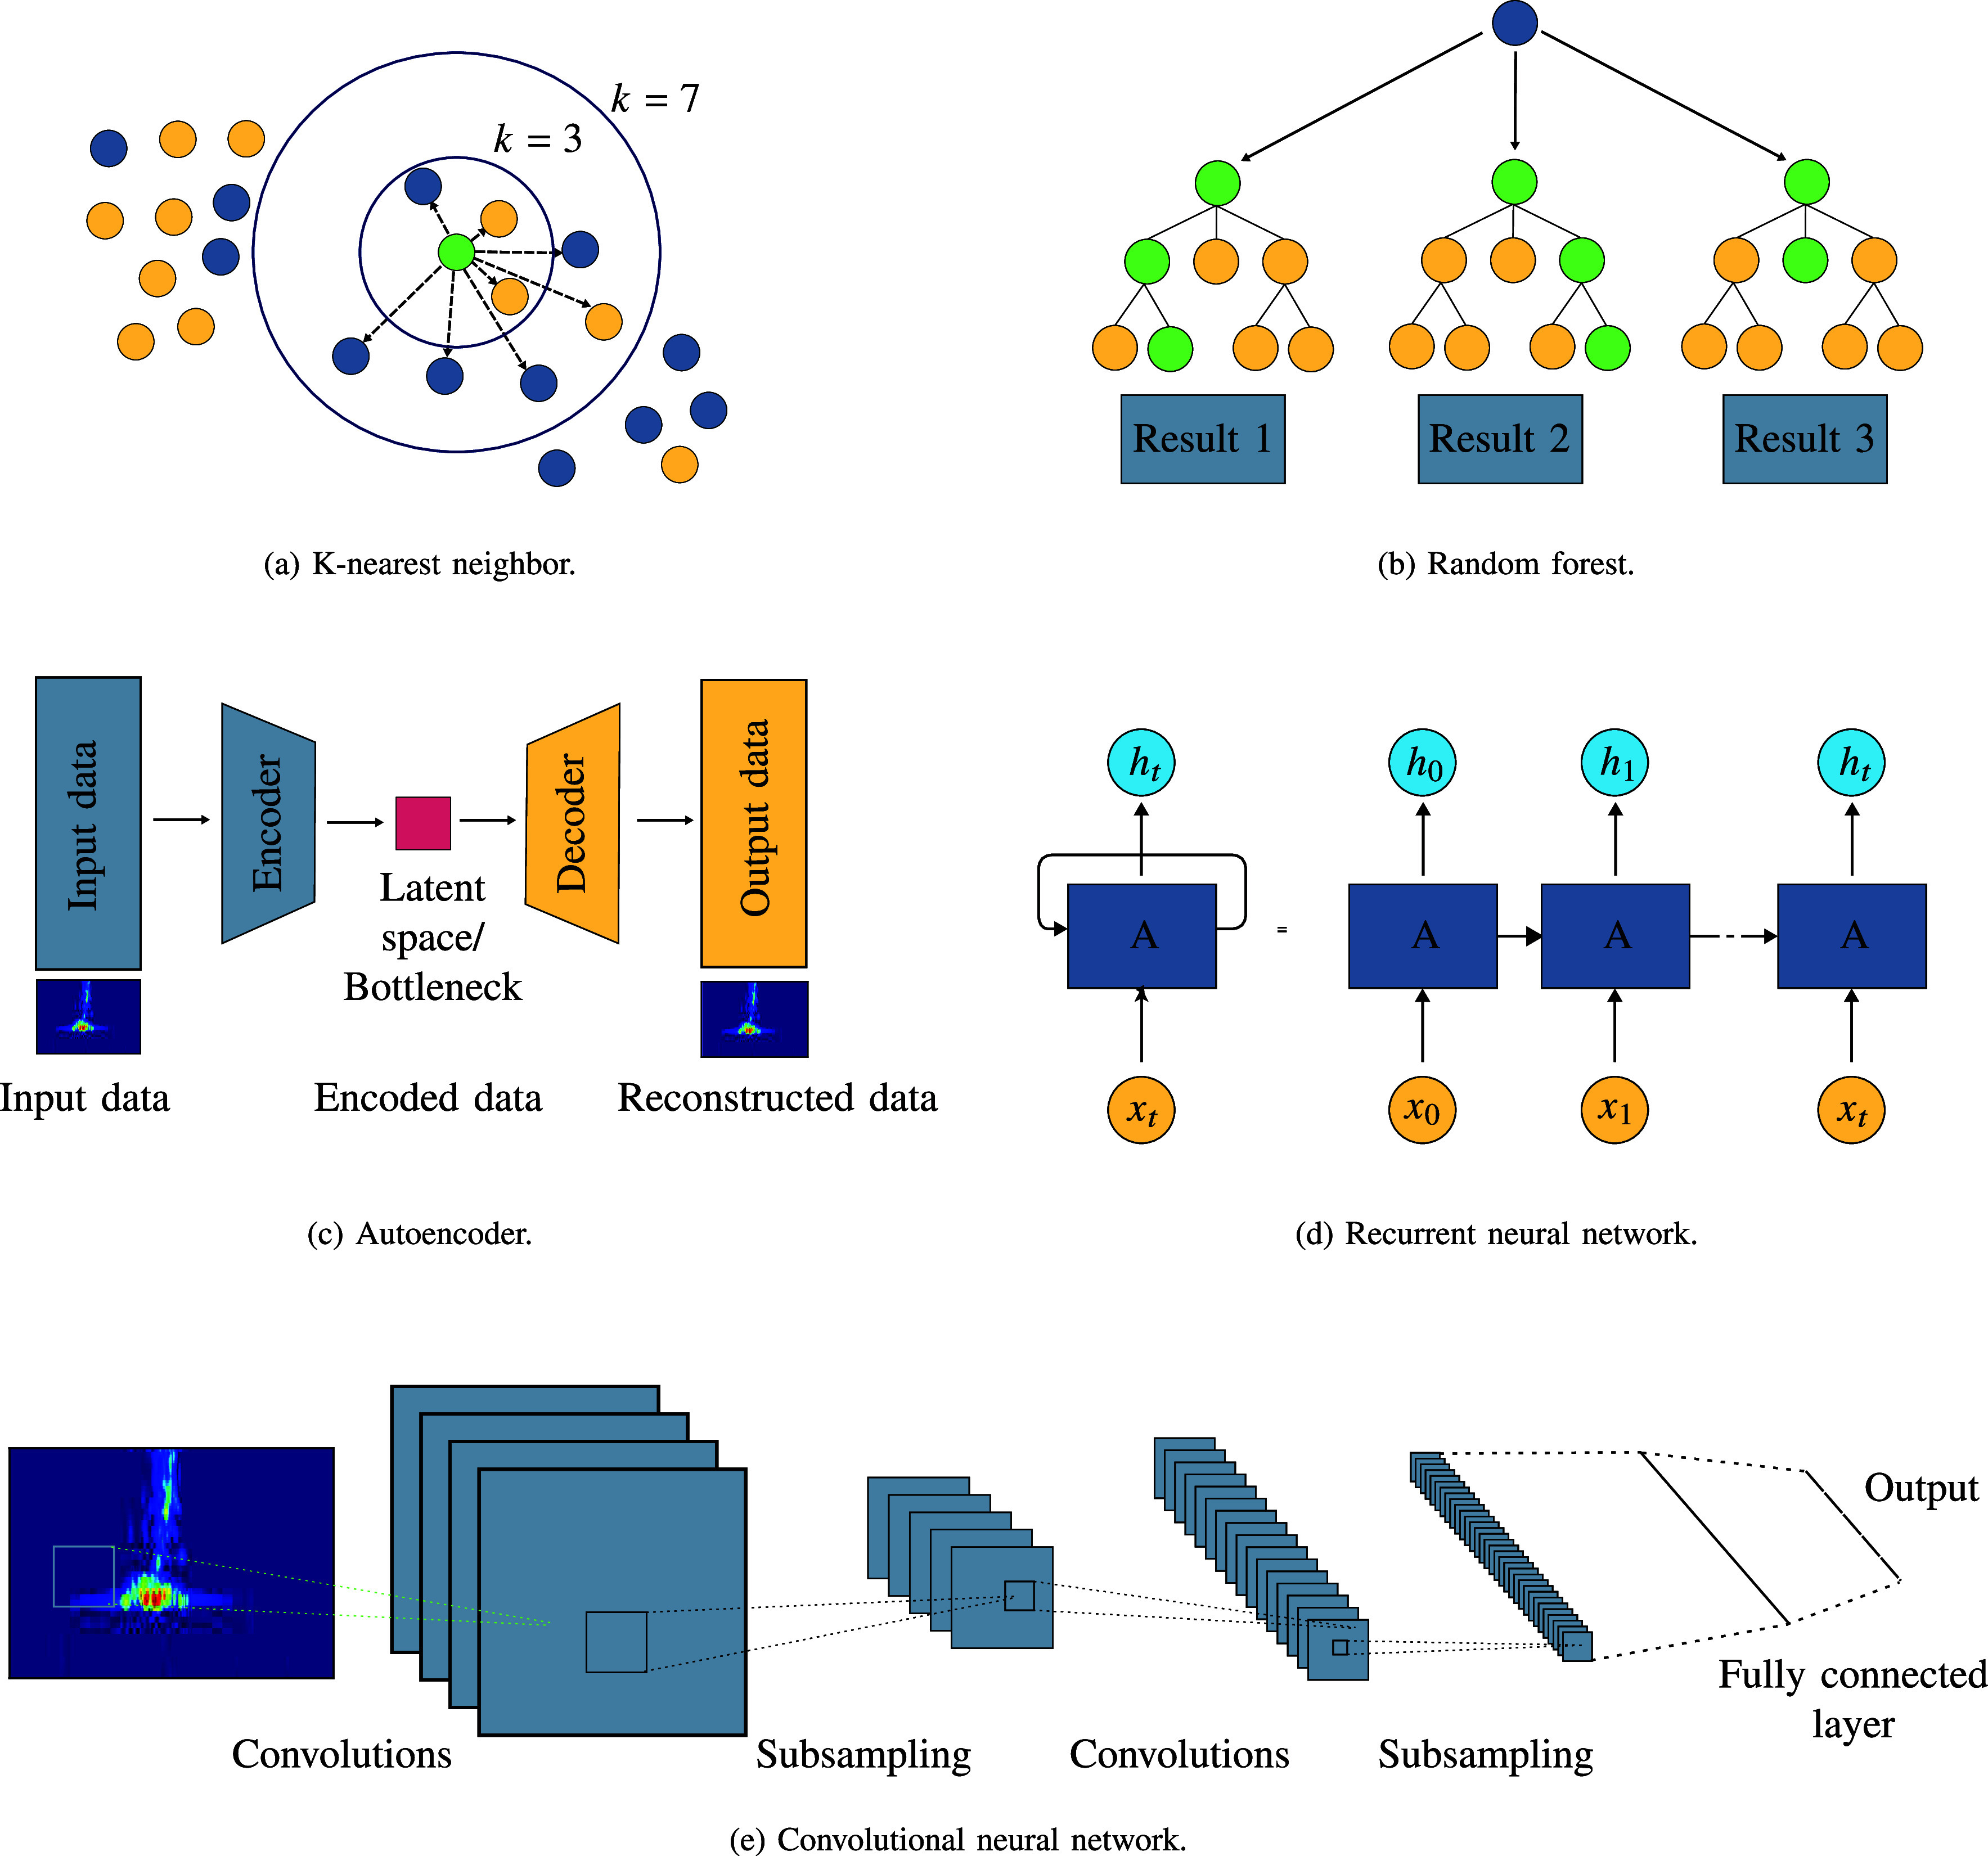
Frequently used ML algorithms: (a) K-nearest neighbor: The algorithm assigns new data points to the class with the majority of nearest neighbors; (b) Random forest Algorithm: Predictions are determined by the combination of multiple decision trees. Frequently used DL algorithms: (c) Autoencoder: By inducing a low-dimensional representation between the encoder and decoder structure feature extraction or data generation can be performed; (d) Recurrent neural network: By storing information from previous inputs memory information is induced to learn long-term dependencies; (e) Convolutional neural network (CNN): Typically a CNN consists of convolutional, pooling and fully connected layers.
The choice of the most suitable ML algorithm depends on the specific problem, available data, and computational resources.
Classical ML algorithms commonly rely on handcrafted features extracted from the data, requiring expert domain knowledge to identify relevant features [82]. As explained in Section III-A, distance-based algorithms require dimensionality reduction in the pre-processing step to reach good prediction results. The training process of tree-based ML algorithms, characterized by decision-making through a hierarchical tree-like structure, typically incorporates inherent feature selection, making the model training less vulnerable to high-dimensional feature spaces [51], [82]. In contrast, the input data for DL algorithms are typically raw or only slightly processed, as the models can handle complex high-dimensional data such as images, audio, and text. Due to the multi-layered network architecture, DL algorithms are able to automatically learn relatively complex hierarchical features, making manual feature selection obsolete [85].
Another advantage of neural networks is their superiority in handling time-series data. While time dependency in classical ML models is typically induced by engineering time-dependent features that are incorporated into the models, there are DL architectures that were particularly designed to handle time-series data, such as recurrent neural networks (RNNs), including models such as LSTMs or gated recurrent units (GRUs) [66], [85].
However, the aforementioned advantage of DL models to learn the complex relationship from (raw) data also bears a downside: The decision process of DL models is often less interpretable compared to classical ML algorithms, where feature engineering is typically performed using expert knowledge [86]. Thus, DL models are often referred to as “black-box models” that can be troublesome for biomedical monitoring, where a transparent way of decision-making is particularly important and can even prevent clinical application.
As the feature engineering in classical ML algorithms is performed with expert knowledge, patterns are created, making the algorithms effective for small- to medium-sized datasets. Therefore, classical ML algorithms are suitable for tasks with limited computational resources such as on-device or real-time applications. In contrast, DL algorithms often require substantial amounts of data for training, which makes them computationally expensive and requires special hardware, such as graphics processing units (GPUs) [84].
E. Training Process
ML models require a training process in which the internal model parameters are adjusted through optimization techniques. For most classical ML algorithms, this means optimizing their internal parameters to minimize an error between predictions and actual target labels.
Neural networks are trained using a process called back-propagation. This involves feeding input data into the network, calculating the output, comparing it with the actual output, and adjusting the weights to minimize the error. This process is repeated iteratively using optimization algorithms such as gradient descent [84].
To achieve generalizability, this training process should be performed on a designated subset of the dataset, which is referred to as the training set. The performance should then be evaluated on a separate test set that was never used in the training process to ensure generalizability and make the model suitable for real-world applications [82].
Due to complex data acquisition and labelling, biomedical radar datasets are often only small-scale datasets. Therefore, the amount of data might be insufficient for establishing a train-test split in which the model optimization does not heavily depend the data to which the model is optimized. As this split is commonly performed randomly, the classification performance might heavily depend on the random split.
To mitigate this issue, cross validation can be used, in which multiple train-test splits are conducted on the same dataset and the resulting prediction performance in averaged. This can help to diminish the impact of a single arbitrary split and to get a more robust result [82].
If the dataset contains several recordings of the same participant, the train-test split should be conducted on a participant level to ensure that data from one participant are only in the training or test set, respectively. This helps to prevent information leakage from the test set into the training process. Furthermore, it is important to ensure that both train and test sets do not contain confounders [87]. For instance, if the control group primarily consists of young, healthy adults while the intervention group is predominantly composed of elderly individuals with Parkinson's disease, the model may learn to classify based on age rather than the intended target, which is Parkinson's disease.
IV. Radar Data Representations and Their Applications in Biomedical Monitoring Using Machine Learning
Raw radar data are complex time series, which are often multidimensional. As mentioned in Section II, even comparatively simple monostatic radar setups in which the sender and transmitter are co-located, such as FMCW or pulse-Doppler, already yield a three-dimensional radar data cube that consists of the dimensions: frames, range, and Doppler (see Fig. 3). For pure CW radars, a range determination is not possible due to the lack of signal bandwidth. However, the Doppler dimension – i.e., the occurring velocity components – can still be measured excellently. In the case of a MIMO setup, which leads to additional spatial information, the dimensions of the radar cube rise to 4D, multiplied by the number of antennas. By choosing the antenna position in two orthogonal spatial directions, the antenna dimension can be further expanded by two dimensions to facilitate the processing procedure. The radar data cube then results in a 5D hypercube.
A. Choice of Radar Data Representation as ML Input
While raw radar data can be directly used as an input for ML models, further signal processing steps can also be applied to extract relevant information from the raw data. Feeding raw radar data directly into an ML network may be quite challenging, as it can lead to a very large and complex network. One reason for this is the high dimensionality of the radar data, which leads to many input parameters and, therefore, more weights. If the raw data also contains complicated patterns that the network has to learn, it may need more parameters to represent these relationships. On the one hand, those large and complex network architectures may be more powerful, as they contain all the present information. On the other hand, they are more susceptible to training errors, may not converge properly, and may lead to unacceptable training times. For that reason, often, only a moderate fraction of the radar cube is fed directly into ML networks as, for instance, 1D or 2D data. While the reduction of the data dimension is a valid method, this can also lead to the loss of relevant information. If, for instance, only the velocity components are analyzed over time and the spatial dimensions are combined into one dimension, a local separation of the occurring signals can no longer be achieved. Thus, it is not possible anymore to detect in which area of the considered scenery the velocity components are present and only the ensemble of all components is available. If the location or position of the signal to be measured is already known before the measurement or if the radar's field of view is restricted accordingly in advance, it is largely sufficient to use the strongest occurring measurement signal. However, it becomes much more difficult if velocity components have to be additionally resolved spatially. However, depending on the use case, it can be advantageous to feed raw radar data directly into an ML framework. In the following section, we summarize different approaches that use raw radar data based on previous work.
B. Applications Using Raw Radar Data
Several examples in the literature have extracted small body movements from raw radar data to predict vital signs, such as respiration and heart sounds, which are mostly recorded with the radar phase profile over time. For instance, Khan et al. [88] used raw radar data for the contactless monitoring of photoplethysmography (PPG) by measuring chest and heart movements. To achieve this, they used a self-attention DL network with an encoder–decoder structure to generate a prediction for the PPG waveform. Shi et al. [67] predicted heart rate variability (HRV) by feeding raw radar data into a bidirectional LSTM network. In addition, the phase was evaluated to record small body vibrations.
The extraction of vital signs was also utilized in other applications. For instance, several approaches for classifying sleep phases from raw radar data (also referred to as “sleep staging”) were presented [48], [53], [68]. In this work, biosignals were extracted from radar sensors placed next to the bed, and different ML and DL algorithms were applied to predict individual sleep phases. In a different application, Ha et al. [52] proposed a contactless stress monitoring setup using an FMCW radar. HRV, respiration, and expert movement features were extracted from the raw radar signal and used to predict the stress level using a random forest-based approach.
A model to classify sleep postures using different DL models is presented by Lai et al. They used IR-UWB radar data from three perspectives, and resized the data to images after several pre-processing and denoising steps.They found that the vision transformer in combination with the radars from side and top reached the best performance [78].
A fall detection application is presented by Hanifi et al. [50] where time- and frequency-domain features computed from raw radar data were fed to different traditional ML models. Another application using radar technology was proposed by He et al. [49], in which the blood oxygen levels of participants were estimated from radar-based respiration measurement using a bidirectional transformer and U-Net approach. The detection and assessment of Parkinson's disease was presented by Yang et al. [89]. Here, a customized DL network architecture was used to extract nocturnal breathing signals from radar data.
The aforementioned multidimensional comprehensiveness of raw radar data makes it difficult to interpret it all at once, even for radar experts. Therefore, other representations of radar data are often preferred, such as 2D sectional images or heatmaps. The representations have the advantage of being better understandable and interpretable representations of the multidimensional radar cube and allow one to gain more information about the scenery. In the past, certain representations have been shown to be more suitable than others for extracting the target information. Therefore, it is necessary to choose the right representation carefully. In the following sections, the most prevalently used sectional images are presented. In addition, we introduce examples from the literature that apply appropriate ML algorithms to respective sectional images.
C. Applications Using Doppler Spectrograms
Doppler spectrograms (see Table 2) are widely used for motion recognition, as radars usually provide an excellent velocity resolution, and even a relatively simple monostatic CW radar is sufficient to acquire this information. Specific motions result in unique so-called micro-Doppler signatures, which are also explained in Table 2. An exemplary Doppler spectrogram is given in Fig. 3(a). Previous work has used Doppler spectrograms for analyzing different types of movements, from large movements or gestures of people [54], [64], [75], [90], [91] to their smaller movements, such as chest movements induced by respiration and heart beats [92], [93].
Furthermore, several methods have been proposed that use Doppler spectrograms as input data for ML algorithms. In fact, Dey et al. [75] converted the magnitude of time-range plots and Doppler spectrograms to RGB images and applied a vision transformer to perform fall classification. Huan et al. extracted features from the Micro-doppler map via feature pyramid extraction and used a a lightweight hybrid vision transformer for classification of various daily life tasks and fall detection [76]. Jokanovic et al. [64] converted the Doppler spectrogram to a gray-scale image and applied stacked autoencoders for feature extraction. Based on these features, they classified fall events using softmax regression. In contrast, He et al. [49] manually extracted different features from time-range and Doppler spectrograms and compared different state-of-the-art ML classifiers to detect fall events. Additionally, Seifert et al. [46] extracted features from Doppler spectrograms based on a sum-of-harmonics analysis and used a nearest neighbor model to classify gait abnormalities. In [92], Yamamoto et al. used Doppler spectrograms as the input for a convolutional LSTM network to detect heart beats.
D. Applications Using Range – Doppler Images
Range – Doppler images simultaneously provide information about the distance and the velocity of the radar targets. Similar to Doppler spectrograms, only a monostatic setup is necessary to create a range – Doppler image; however, here, the acquisition of additional range information is required. Range – Doppler images do not inherently comprise time dependency and angular information about the target toward the radar. Range – Doppler images are widely used for scene interpretation – e.g., in automotive radar or object and person detection since the resolution of range – Doppler images is usually higher compared to angle resolution, even for low-cost radars. An example of a range – Doppler image is depicted in Fig. 3(b).
Bhavanasi et al. [55] used range – Doppler images as an input for a CNN-based network structure together with a softmax classifier to perform patient activity recognition in a hospital environment. Time-integrated range – Doppler images were used in Erol et al.’s [62] study for human motion classification. From gray-level representations, they extracted 13 different statistical features and performed the classification using a support vector machine (SVM). Zhao et al. used range – Doppler images measured by five UWB radar systems to classify nine different activities in arbitrary directions. Therefore, they applied a vision transformer and found initial results below CNN algorithms. However, they indicated that vision transformers might generalize better on unseen individuals [77].
E. Applications Using Range – Angle Images and Spatial Heatmaps
If several antennas (e.g., MIMO arrays) are used instead of just one, the spatial resolution of the scene is also possible. In general, spatial resolution improves with an increasing aperture size, especially with the number of antennas used. To generate spatially resolved images from raw radar data, the dimensions range and antennas are required because the change of the phase over the antennas needs to be evaluated. The resulting data is usually angle dependent and provides information about the angular position between the radar and the radar echo. Therefore, 2D sectional images can be created using the dimensions range and angle (e.g., azimuth and/or elevation; see Fig. 1), as depicted in Fig. 3(d). The images can be converted into spatial heatmaps in Cartesian coordinates, providing the target's position in x, y, and z coordinates. Range – angle images or heatmaps do not inherently comprise information about time dependency and velocity; they are primarily employed to obtain the position of radar echoes in the room. For instance, Yue et al. [81] used range – angle images from radar technology to estimate human poses. A combination of range – Doppler, range – angle, and Doppler-angle images was used in [94] to automatically detect activities of daily living within a palliative care environment.
Fig. 1.

Radar coordinate system: The red area determines the field of view of the radar system.
V. Study Planning and Data Acquisition
A planned data acquisition needs to be tailored to the specific motion and ML task. Different radar types have advantages and disadvantages (as listed in Table I). For example, in the analysis of microscopic motion, CW radars are sufficient, as they make the continuous tracking of small distance changes possible, and the small system bandwidth allows for a higher signal-to-noise ratio (SNR) compared to broadband systems. On the other hand, capturing the range information of macroscopic motion usually requires different signal shapes (e.g., impulse Doppler, FMCW, or SFCW). To also retrieve angle information, multiple antennas need to be used. When multiple body parts are involved in the motion, range and angle resolution help to distinguish between the different targets. However, in TDM-MIMO radars, the maximum frame rate is inversely proportional to the number of transmit antennas, which restricts unambiguous Doppler (velocity) measurements and, therefore, the types of movement that can be captured.
The data acquisition procedure is also influenced by the choice of the ML model, as the amount of the required training data strongly depends on the number of trainable parameters within the model. Therefore, classical ML typically requires less training data than DL [95]. Furthermore, even with sufficient data, DL does not necessarily outperform classical ML [96].
Most previous radar – ML studies focused on supervised learning, necessitating labeled training data. Whenever feasible, it is advisable to gather synchronized ground truth reference data. This facilitates the potential for automatic labeling but can also serve as a basis for manual labeling. For instance, in a gait analysis, the participants were given the task of performing specific movement patterns [47], [54], [58], [65]. In contrast, sleep stages were labeled based on gold standard PSG recordings, either by experts [60], [68] or through software [48]. Further, precise time synchronization between radar sensors and reference systems needs to be adequately addressed. Long-term synchronization can be achieved by recording a synchronization signal in both the gold standard and target signal [67] or by implementing a synchronization invariant loss function [88]. If the ML task allows it, rough synchronization – e.g., using time-stamps – can be sufficient [60].
The recording of a high amount of training data is not necessary in the case of unsupervised or self-supervised ML tasks. By utilizing deep contrastive learning, Chen et al. [97] dealt with the task of separating radar responses caused by vital signs from signal components generated by macroscopic motions. However, it is worth noting that a significant portion of published work relies on supervised learning, emphasizing the critical role of generating high-quality training data.
The generation of sufficient training data can be challenging. Primarily, this stems from the tasks associated with labeling and the need to ensure a data set that represents the complexities and diverse scenarios of real-world biomedical conditions as best as possible. In this regard, radar simulations are a vital approach, as they allow automatic labeling, while the variability within the simulation model enhances the diversity of the generated data [94], [98], [99]. Furthermore, with this approach, unavailable radar hardware can be simulated, aiding in the identification of the most suitable radar sensor for the respective biomedical application.
VI. Ethical Analysis of Machine Learning-Enabled Radar-Based Biomedical Monitoring
While numerous ethical papers are available that have examined the use of ML for biomedical monitoring, there is still a scarcity of ethical investigations into radar-based ML applications for monitoring. The ethics of these technologies are currently facing numerous methodological and application-related questions. As clear as the basic line seems to be that this emerging technology should be used in such a way that it serves people, it quickly becomes unclear what this can mean in concrete terms. Central to this is the development of ethical criteria that are both context sensitive and clearly evaluable.
So far, the ethics of ML have been very much focused on data processing and data use [112], [113]. There has not been an equal focus on the methods and modes of data acquisition. However, when employing radar-based systems for biomedical monitoring, the new forms of data acquisition pose important ethical questions. This is why our ethical analysis focuses in particular on the new data acquisition procedures. On the one hand, forms of data collection that involve physical contact with the body of the respected person can lead to uncomfortable experiences. Radar-based applications, on the other hand, present a form of data collection without physical contact. Some scholars, such as Fioranelli and Le Kernec [114], highlight the enormous advantages that such systems may have to not compromise the bodily integrity of the patients: “The advantage of radar sensing comes from its contactless and non-intrusive nature. The subjects do not need to wear or carry or interact with devices, which can be an advantage for users' compliance, especially for those affected by cognitive impairments. Furthermore, radar sensors do not generate plain images or videos of people and their environments, which can be an advantage for users' acceptance in term of privacy.” [114]. At the same time, however, the question arises whether radar-based applications are really less impairing if they measure in a contactless and, in a sense, invisible manner, which makes transparency about the measurement and the time of measurement an additional challenge.
We conducted a narrative literature review [115] to examine the ethical criteria discussed in the literature concerning radar-based systems. We utilized the ethics principles of AI discussed in Jobin et al.'s [100] study and assessed which of these are discussed with respect to radar-based systems. We developed the following search strategy: intitle:radar AND intitle:biomedical AND [ethical principle]. We used the term ”biomedical” to filter the results with regard to those radar-based systems that are used for data collection in biomedicine and to rule out papers on radar systems that have applications in non-medical and non-human industrial contexts (e.g., weather radars). Jobin et al. [100] identified a total of 11 different ethical principles. As ethical principles are not always referred to by the same phrase, we also included their synonyms defined by Jobin et al. [100]. For instance, in the case of the ethical principle of transparency, the search strategy looks as follows: intitle:radar AND intitle:biomedical AND (transparency OR explainability OR explicability OR understandability OR interpretability OR communication OR disclosure OR showing). If the scope of the terms was too large because verb forms were also included or the synonyms of the ethical principle contained more than one word, inverted commas were used (e.g., for “communication” or “show”). The database search was conducted on Google Scholar on September 29–30, 2023.
The results of our narrative literature search are summarized in Table V. In total, we found  papers that contained at least one of the ethical principles mentioned by Jobin et al. [100] and radar-based biomedical monitoring. Papers that matched more than one ethical principle are listed in each matching category.
TABLE V. Results of the Search for the Employment of Ethical Principles According to [100] in the Context of Radar-Based Systems for Biomedical Monitoring.
| Overview of Ethical Principles | |||
|---|---|---|---|
| Ethical principle | Included terms (cf. Jobin et al.; frequencies) [100] | Results | Especially relevant papers |
| Transparency | Transparency ( ), explainability ( ), explainability ( ), explicability ( ), explicability ( ), understandability ( ), understandability ( ), interpretability ( ), interpretability ( ), communication ( ), communication ( ), disclosure ( ), disclosure ( ), showing ( ), showing ( ) ) |

|
|
| Justice and fairness | Justice ( ), fairness ( ), fairness ( ), consistency ( ), consistency ( ), inclusion ( ), inclusion ( ), equality ( ), equality ( ), equity ( ), equity ( ), (non-) bias ( ), (non-) bias ( ), (non-)discrimination ( ), (non-)discrimination ( ), diversity ( ), diversity ( ), plurality ( ), plurality ( ), accessibility ( ), accessibility ( ), reversibility ( ), reversibility ( ), remedy ( ), remedy ( ), redress ( ), redress ( ), challenge ( ), challenge ( ), access and distribution ( ), access and distribution ( ) ) |

|
Detection bias due to psychological stress can be eliminated [101], diversity [102], accessibility [102] |
| Non-maleficence | Non-maleficence ( ), security ( ), security ( ), safety ( ), safety ( ), harm ( ), harm ( ), protection ( ), protection ( ), precaution ( ), precaution ( ), prevention ( ), prevention ( ), integrity (bodily or mental) ( ), integrity (bodily or mental) ( ), non-subversion ( ), non-subversion ( ) ) |

|
Safety [102], [103], prevention [104], [105], prevention [106] |
| Responsibility | Responsibility ( ), accountability ( ), accountability ( ), liability ( ), liability ( ), acting with integrity ( ), acting with integrity ( ) ) |

|
|
| Privacy | Privacy ( ), personal or private information ( ), personal or private information ( ) ) |

|
Privacy [101], [102], [104], [107] |
| Beneficence | Benefits ( ), beneficence ( ), beneficence ( ), well-being ( ), well-being ( ), peace ( ), peace ( ), social good ( ), social good ( ), common good ( ), common good ( ) ) |

|
Benefit [102], [105], [108], [109], [110], [111] |
| Freedom and autonomy | Freedom ( ), autonomy ( ), autonomy ( ), consent ( ), consent ( ), choice ( ), choice ( ), self-determination ( ), self-determination ( ), liberty ( ), liberty ( ), empowerment ( ), empowerment ( ) ) |

|
|
| Trust | Trust ( ) ) |

|
|
| Sustainability | Sustainability ( ), environment (nature) ( ), environment (nature) ( ), energy ( ), energy ( ), resources (energy) ( ), resources (energy) ( ) ) |

|
|
| Dignity | Dignity ( ) ) |

|
|
| Solidarity | Solidarity ( ), “social security” ( ), “social security” ( ), cohesion ( ), cohesion ( ) ) |

|
|
In the brief analysis along the principles of the ethics of AI identified by Jobin et al. [100], it became apparent that central ethical questions concerning the method of data collection have, so far, played an underreported role or none at all. It is surprising, however, that questions of trust, dignity, and solidarity have so far hardly been discussed concerning radar-based systems. The fact that trust, dignity, and solidarity only occur once or not at all in relation to radar-based systems in the biomedical field is noteworthy. For the principle of solidarity, a possible explanation might be that this aspect has, so far, been a rather less discussed topic of ethics with regard to AI/ML ethics [116]. Concerning the principle of dignity, which is often associated with human rights, Jobin et al. also note that it appears very rarely in the guidelines analyzed and has not yet been defined [100]. In this respect, the absence of the principle of dignity may also be due to the fact that it has so far played a subordinate role as a principle in the overall discourse on AI. It could certainly be argued here that the emphasis on dignity as an essential principle can be seen very differently in different cultures and countries.
Although the principles of transparency, freedom and autonomy, and sustainability are mentioned more often, they lack ethical reflection and argumentation. With regard to the term transparency, there are 26 papers on the term communication and nine papers on the term showing. In both cases, the terms are used very unspecifically either as verb forms or to describe technical facts. Only Paolinis works mention the aim to “enable tridimensional localization of tagged people [...] in the most transparent and non-invasive way” [106], [117]. The same applies for the search for freedom and autonomy. The terms are used to describe technical specifications, e.g., “m-1 degrees of freedom” [118]. With regard to the principle of sustainability, the term energy is mentioned in relation to energy sources and environment refers to the surroundings of the data collection (e.g., a sleep laboratory or a realistic environment). The terms are used to describe technical matters and not to reflect issues of sustainability from an (environment-related) ethical perspective.
A different picture emerges in the ethical principles justice and fairness, non-maleficence, privacy, and beneficence, starting with beneficence: In addition to technical benefits, the results analyzed also mention medical benefits [108], [109], [119], economic benefits [102], regulatory benefits [111], and social-ethical benefits. The latter arise, for instance, from avoiding privacy issues [102], [119], addressing social needs in healthcare [108], and enabling outdoor or home monitoring [102]. Nahar describes medical benefits “[...] in terms of convenience and accuracy in diagnosis, treatment, and detection of emergency situations in home and clinical environments” [105]. In the context of non-maleficence, prevention and primary care in clinical and home environments are mentioned as other important benefits of radar technologies [104], [105]. This analysis is confirmed in the analysis of the categories of clinical relevance presented in the following chapter (e.g., avoiding the “lab gait”, specifying measurements, and enabling the improvement of emergency detection in the home environment, among others).
Radar technology is often promoted as being less privacy-invasive than common methods of vital sign measurements. While some authors do not see any breach of privacy in the use of radar systems at all [102], [119], radar-based monitoring is often compared to camera- or video-based devices, for which privacy concerns are raised [105], [108], [110], [119], [120]. Others highlight the possibility of reducing the invasion of privacy [101] or naming the preservation of privacy as one of its unique advantages [107]. From an ethical point of view, it has to be considered that privacy encompasses more dimensions than the debate about video recording suggests (e.g., the question of consent and control over and security of health data).
With regard to the principle of justice and fairness, the need for diverse datasets [102] and the possibility of less detection bias due to contactless measures [101] appear in the literature. In addition, the possibility of having access to one's own data at any time is described as a technical challenge [102]. The analysis shows that many important ethical principles have not yet been explored in relation to radar-based ML applications for biomedical monitoring, even though the technology promises benefits in numerous areas of clinical application.
VII. Categories of Clinical Relevance
The potential of combining contactless radar measurements with ML applications to extract meaningful information opens numerous applications that promise to enhance clinical practices and improve patients' health condition outcomes. The following section introduces some application examples.
A. Sleep Analysis
Poor sleep quality is directly associated with various physical and physiological diseases. For this reason, accurate sleep monitoring is essential for the prevention, diagnosis, and treatment of such [121]. Currently, the gold standard for accurate sleep analysis is PSG which is usually conducted in a sleep laboratory. During an overnight PSG measurement, various biosignals such as electroencephalography, electrocardiography (ECG), and electromyography are recorded, allowing a reliable diagnosis of sleep disorders. However, longitudinal measurements are impractical since PSG measurements are cost and resource intensive. Furthermore, the unfamiliar and intrusive laboratory environment can affect the sleep quality of patients, causing unrealistic sleep patterns [122]. Radar-based sleep analysis offers an unobtrusive alternative to enable longitudinal sleep analysis. Several researchers have investigated the estimation of sleep stages using different types of radar. They all extract body movements and vital signs from raw radar data. While Kwon et al. [68] fed data from a  UWB radar into an attention-based LSTM, a special form of a RNN meant to predict sleep stages, Rahman et al. [53] and Hong et al. [48] used CW radar sensors and compared the prediction performance of different conventional ML algorithms such as naive Bayes, logistic regression, SVM, random forest, bagged trees, and subspace kNN networks. Another option is to diagnose and analyze the course of diseases. For instance, Yang et al. predicted the diagnosis of Parkinson's disease from longitudinally recorded nocturnal breathing patterns extracted from an FMCW radar and predicted the associated Hoehn and Yahr scale, which determines the severity of Parkinson's disease [89].
B. Gait and Motion Analysis
Gait can be considered as the sixth vital sign [124]. In a clinical setting, gait analysis is often performed using optical motion capture, in which markers are attached to a participant's bony landmarks(i.e., where the bone locations are palpable on the skin – e.g., the iliac crest). Then, movement is recorded by infrared cameras, often in combination with force plates. These experiments are time intensive, as both the marker placement and labeling are manual processes. Furthermore, minimal clothing and the presence of markers can alter gait behavior [123]. Radar–ML-based gait analysis has the potential to speed up the execution of experiments by eliminating tedious preparation and post-processing and by allowing clothes to be kept on, ultimately allowing more natural movement to be captured. Fig. 8 outlines a typical measurement setup to evaluate human gait parameters extracted from radar data against ground truth data – e.g., those acquired from a marker-based motion capture system.
Fig. 8.

Setup for the extraction of biomechanical parameters in gait analysis using Doppler radar. The motion capture cameras offer the ground truth data of the movements. This figure is adopted from [123].
In radar-based motion analysis, most studies have focused on detecting different healthy or affected gait modes. Usually, single antenna (FM)CW radars were set up in the sagittal plane. The resulting range – Doppler maps or spectrograms were then classified as healthy or impaired gait using classical ML [47], [58] or DL [54], [65] methods. To our knowledge, spatio-temporal gait analysis with radar technology has only been performed with heuristic algorithms so far [123], [125].
Moreover, an accurate and reliable full-body 3D pose estimation could be used as a direct replacement of optical motion capture. Several publications have proposed pose-estimation algorithms applying DL models on MIMO-generated spatial heatmaps [126], [127], [128], [129], [130]. However, the proposed works still need to be validated for their applicability in gait analysis.
C. Continuous Biomedical Monitoring for Emergency Detection
Continuous patient monitoring is standard in hospital and homecare environments but requires significant infrastructure. While in emergency medical scenarios, the addition of a wired ECG presents minimal complications due to the presence of other critical devices, continuous monitoring can be intrusive for patients admitted to regular wards. Elderly care often involves wearables or emergency buttons, necessitating patient action during emergencies. Especially for these applications, radar-based methods can pose significant advantages. Because of radar-based methods' inherently low spatial resolution, they bypass traditional privacy concerns, making them appropriate for areas with increased privacy requirements. Notably, FMCW radar combined with ML has already demonstrated efficacy in fall detection, a crucial component in home care [131], [132]. Beyond fall detection, the radar enables the detection and classification of movements and activity. Fan et al. demonstrated daily activity tracking for continuous monitoring at home using FMCW radar in conjunction with a CNN [133]. Furthermore, Braeunig et al. combined a CNN with an LSTM with data from an FMCW MIMO radar system to recognize different activities in a palliative care context [94]. The possibility of capturing vital signs enables many more applications. Patients can be continuously monitored in their beds without attaching devices to their bodies. Wen et al. showcase the continuous monitoring of infants for apnea to prevent possible hypoxia using CW radar [134], demonstrating the effectiveness of this technology. By employing ML techniques, the automatic detection of critical medical conditions and faster access to medical help are achievable.
D. Stress and Mental Health
Work-related chronic stress is considered to be one of the most challenging–and growing–occupational safety and health concerns [135]. While the human body is capable of adapting to an acute stress situation by activating and deactivating biological stress pathways, repeated acute stress exposure can lead to the dysregulation of these pathways [136]. If not prevented, this can ultimately lead to chronic stress and its known negative effects on mental health, such as post-traumatic stress disorder, burnout, or depression [137]. Thus, it is crucial to better understand the transition from acute to chronic stress, which can help to find suitable interventions to prevent not only our biological stress pathways from dysregulating but, consequently, also the progression of stress-related mental health diseases [138].
In addition, acute stress assessment is typically performed using laboratory protocols (e.g., using the Trier Social Stress Test [139]) that aim to systematically and repeatedly induce acute stress, while established markers are collected to quantify the biopsychological stress response. Amongst others, this involves the collection of inflammatory or neuroendocrine markers from blood or saliva [140], [141], electrophysiological markers from measuring ECG or electrodermal activity (EDA) [142], as well as psychometric markers from self-reports and questionnaires. However, this “traditional” approach is increasingly reaching its limits since the procedures are often invasive and laboratory-based. Thus, the measurement frequencies can only be scaled to a limited extent and can hardly be transferred outside the laboratory [143]. For this reason, there is a direct need to develop novel digital biomarkers that can be employed outside the laboratory and can be used as an extension of established laboratory biomarkers.
Radar-based biomedical monitoring techniques have the potential to fill the gap in stress and mental health research by enabling the acquisition of a more holistic picture of human behavior during different psychological states, particularly outside the laboratory. As a first step, Shi et al. [67] demonstrated the feasibility of radar-based sensing during acute stress scenarios in the laboratory by proposing a contactless heart rate (variability) assessment approach using a CW sensor and an LSTM-based ML model. Broader approaches for end-to-end stress detection using FMCW radar have been proposed, for instance, by Ha et al. [52], Liang et al. [144], and Muhammad et al. [145]. Fig. 9 outline the scheme of a stress level classification using radar by measuring stress-related biometrics. In addition, Han et al. [146] showed that different mental states can be predicted by using a combination of a UWB radar and a kNN-based ML algorithm. While these approaches are a promising step toward the contactless assessment of stress and mental health in general, there is still a considerable amount of research required, especially regarding the possibility of not only detecting different psychological states, but also quantifying the magnitude of underlying physiological responses.
Fig. 9.

Setup for a stress level classification using radar by measuring stress-related biometrics. This figure is adopted from [52].
VIII. Discussion
The integration of radar technology with ML applications in biomedical monitoring scenarios offers high potential: Due to the contactless wave-based character of radar signals, an unperceived monitoring of patients' health conditions is enabled. Therefore, it provides an opportunity to continuously collect real-world data without affecting daily routines. In this way, data quality is enhanced, and continuous data acquisition is made feasible. Compared to hospital settings, where patients often tend to dissimulate and sugarcoat the actual disease status, a more realistic health condition can be captured. Furthermore, hospital assessments are often only performed several times a year at discrete points in time, which makes it more difficult to accurately track disease progression. Moreover, as highly sophisticated radar sensors are becoming more and more affordable, they can be applied in a more widespread manner.
However, radar sensors are not yet part of medical experts' routine diagnostics, as the technology has not been established in the healthcare sector so far. Until several years ago, radar sensors were comparably expensive with lower accuracy and reliability in data collection compared to gold-standard techniques. Recent advances in research and development [147], [148], [149] enabled radar sensors to be performant and more affordable, making them a promising alternative to conventional biomedical monitoring systems. The comprehensive data from the radar cube, on the one hand, provides an accurate and precise data set including information on the position, speed, and direction of movement all at once. On the other hand, the complex and multidimensional data structure poses a challenge to the interpretation and extraction of meaningful information without a solid foundation in an optimal and reliable pre-processing methodology. ML and DL algorithms can help in analyzing radar data to support clinical decision-making. However, this has not been investigated sufficiently so far due to the lack of large and diverse datasets that are necessary to develop models that are generalizable across the whole population. The creation of diverse datasets is essential to tackle challenges such as gender and race bias in the application of radar-based ML applications [150]. Furthermore, the collection of large-scale datasets is challenging due to the characteristics of radar signals. Due to signal complexity, only labelers with expert radar knowledge are able to annotate such data, resulting in small datasets that are still expensive to collect.
Against the results of the analysis of the 54 ethics papers, the technological advances described above are changing data acquisition possibilities in various healthcare settings. From an ethical perspective, it will be crucial to address the challenges related to the use of radar-based ML applications. The analysis of the various ethical principles is fundamental to this. Despite the surprising frequency of some of the principles, notably beneficence, justice and fairness, non-maleficience, and privacy, they are mostly treated only superficially or appear due to the technical connotation of the terms. As far as the principle of privacy is concerned, new opportunities might arise if new methods of analyzing radar data allowed for data anonymization.
There is another crucial point for the future use of radar-based ML applications: the debate about non-invasive monitoring technologies. Their consideration is promising because radar sensors, in combination with ML technology, can be evaluated as not only a technical but also a socio-technical system. Following Zuboff [151], this is understood here to mean technical tools (capacities) to comprehensively surveil data subjects–mostly, but not only, for commercial interests. The combination of radar and ML can, in some cases, diminish the advantages of privacy that we found in the ethical analysis. This is the case when ML is used to draw conclusions about the individual person from the collected anonymous radar data. Subsequently, it can be assessed as an analogy to other digital and AI technical systems that do not impair bodily integrity but raise ethical concerns.
Nevertheless, the potential for applying radar and ML in the medical field is tremendous, and the research field is still wide open for more: Different sensor technologies can be fused to combine the respective advantages of sensor technologies, further improving future medical treatment. For instance, the highly accurate velocity estimation of radar sensors can be exploited and combined with the excellent lateral resolution of RGB images [152]. Furthermore, while well-established and very powerful end-to-end pipelines for RGB images already exist, such pipelines are still lacking for radar data, although this offers a huge potential.
IX. Conclusion
In this paper, we presented a review combined with a tutorial overview of radar technology and ML for biomedical monitoring applications. The characteristics of radar enable these sensors to become a promising technology in future medical care. It offers considerable advantages compared to currently utilized gold-standard methods such as the possibility of directly assessing microscopic and macroscopic motion paired with reduced privacy concerns. In particular, the fusion of radar data with well-designed ML algorithms enhances the interpretability of complex radar data and augments its discriminative capabilities. By using the combined power of radar data and ML algorithms, not only the diagnosis can be improved, but also the disease progress can be continuously tracked. In upcoming years, technological advances in the field of radar and ML might drastically improve resolution, data acquisition, and data processing, which result in further improvements in patients' diagnosis and treatment. Of course, there are still technical and ethical questions addressed in this paper that need to be considered in the future. For this reason, this paper outlines the promising features and capabilities of radar and ML in relation to medical applications using numerous examples and encourages future work on this exciting topic.
Conflict of interest
The authors declare that they have no commercial or financial relationships that could be construed as a potential conflict of interest.
Author contribution
Lukas Engel was primarily responsible for the radar-related sections of the review paper, while Daniel Krauss focused on the machine learning sections. Additionally, each author contributed their specialized expertise to their respective research domains, and all authors thoroughly reviewed the manuscript.
Acknowledgment
The authors thank our colleagues Lena Krabbe, Michael Hahn, Carima Jekel, and Annemarie Bruhn who provided insights and expertise that greatly assisted us in the writing of this paper.
Funding Statement
This work was supported by the Deutsche Forschungsgemeinschaft (DFG, German Research Foundation) – under Grant SFB 1483 – Project-ID 442419336, EmpkinS.
Contributor Information
Daniel Krauss, Email: daniel.k.krauss@fau.de.
Lukas Engel, Email: lukas.le.engel@fau.de.
References
- [1].Hasty M. J., “Early detection is the key to successful treatment,” J. Cardiovasc. Manage., Official J. Amer. College Cardiovasc. Administrators, vol. 6, no. 4, pp. 24–25, 1995. [PubMed] [Google Scholar]
- [2].Wang W., Lee J., Harrou F., and Sun Y., “Early detection of Parkinson's disease using deep learning and machine learning,” IEEE Access, vol. 8, pp. 147635–147646, 2020. [Google Scholar]
- [3].Visser H., “Early diagnosis of rheumatoid arthritis,” Best Pract. Res. Clin. Rheumatol., vol. 19, no. 1, pp. 55–72, Feb. 2005. [DOI] [PubMed] [Google Scholar]
- [4].Feeny A. K. et al. , “Artificial intelligence and machine learning in arrhythmias and cardiac electrophysiology,” Circulation, Arrhythmia Electrophysiol., vol. 13, no. 8, Aug. 2020, Art. no. e007952. [DOI] [PMC free article] [PubMed] [Google Scholar]
- [5].Lugrís U., Pérez-Soto M., Michaud F., and Cuadrado J., “Human motion capture, reconstruction, and musculoskeletal analysis in real time,” Multibody Syst. Dyn., vol. 60, pp. 3–25, Oct. 2024. [Google Scholar]
- [6].Yoshikawa N., Suzuki Y., Ozaki W., Yamamoto T., and Nomura T., “4D human body posture estimation based on a motion capture system and a multi-rigid link model,” in Proc. IEEE Annu. Int. Conf. Eng. Med. Biol. Soc., 2012, pp. 4847–4850. [DOI] [PubMed] [Google Scholar]
- [7].“Ever easier health monitoring,” Nature Biomed. Eng., vol. 7, no. 10, pp. 1205–1206, Oct. 2023. [DOI] [PubMed] [Google Scholar]
- [8].Liu S., Zhang J., Zhang Y., and Zhu R., “A wearable motion capture device able to detect dynamic motion of human limbs,” Nature Commun., vol. 11, no. 1, Nov. 2020, Art. no. 5615. [DOI] [PMC free article] [PubMed] [Google Scholar]
- [9].Kazdin A. E., “Unobtrusive measures in behavioral assessment,” J. Appl. Behav. Anal., vol. 12, no. 4, 1979, Art. no. 1311490. [DOI] [PMC free article] [PubMed] [Google Scholar]
- [10].Espay A. J. et al. , “Technology in Parkinson's disease: Challenges and opportunities: Technology in PD,” Movement Disord., vol. 31, no. 9, pp. 1272–1282, Sep. 2016. [DOI] [PMC free article] [PubMed] [Google Scholar]
- [11].Peeters J. M., Wiegers T. A., and Friele R. D., “How technology in care at home affects patient self-care and self-management: A scoping review,” Int. J. Environ. Res. Public Health, vol. 10, no. 11, pp. 5541–5564, Nov. 2013. [DOI] [PMC free article] [PubMed] [Google Scholar]
- [12].Den Hond E., Celis H., Vandenhoven G., O'Brien E., and Staessen J. A., “Determinants of white-coat syndrome assessed by ambulatory blood pressure or self-measured home blood pressure,” Blood Press. Monit., vol. 8, no. 1, pp. 37–40, 2003. [DOI] [PubMed] [Google Scholar]
- [13].Imran M. A., Ghannam R., and Abbasi Q. H., Engineering and Technology for Healthcare. Hoboken, NJ, USA: Wiley, 2020. [Google Scholar]
- [14].Albrecht N. C., Weiland J. P., Langer D., Wenzel M., and Koelpin A., “Characterization of the influence of clothing and other materials on human vital sign sensing using mmWave radar,” in Proc. IEEE 53rd Eur. Microw. Conf. 2023, pp. 428–431. [Google Scholar]
- [15].Skolnik M. I., Radar Handbook, 3rd ed. New York, NY, USA: McGraw-Hill, 2008. [Google Scholar]
- [16].Li M. and Lin J., “Wavelet-transform-Based data-length-variation technique for fast heart rate detection using 5.8-GHz CW Doppler radar,” IEEE Trans. Microw. Theory Techn., vol. 66, no. 1, pp. 568–576, Jan. 2018. [Google Scholar]
- [17].Vinci G. et al. , “24 GHz six-port medical radar for contactless respiration detection and heartbeat monitoring,” in Proc. IEEE 9th Eur. Radar Conf., 2012, pp. 75–78. [Google Scholar]
- [18].Vinci G. et al. , “Six-port radar sensor for remote respiration rate and heartbeat vital-sign monitoring,” IEEE Trans. Microw. Theory Techn., vol. 61, no. 5, pp. 2093–2100, May 2013. [Google Scholar]
- [19].Michler F. et al. , “A clinically evaluated interferometric continuous-wave radar system for the contactless measurement of human vital parameters,” Sensors, vol. 19, no. 11, May 2019, Art. no. 2492. [DOI] [PMC free article] [PubMed] [Google Scholar]
- [20].Michler F. et al. , “Pulse wave velocity detection using a 24 GHz six-port based Doppler radar,” in Proc. IEEE Radio Wireless Symp., 2019, pp. 1–3. [Google Scholar]
- [21].Petrovic V. L., Jankovic M. M., Lupsic A. V., Mihajlovic V. R., and Popovic-Bozovic J. S., “High-accuracy real-time monitoring of heart rate variability using 24 GHz continuous-wave Doppler radar,” IEEE Access, vol. 7, pp. 74721–74733, 2019. [Google Scholar]
- [22].Wenzel M., Albrecht N. C., Langer D., Heyder M., and Koelpin A., “Catch your breath! vital sign sensing with radar,” IEEE Microw. Mag., vol. 24, no. 3, pp. 75–82, Mar. 2023. [Google Scholar]
- [23].Kao T.-Y. J. and Lin J., “Vital sign detection using 60-GHz Doppler radar system,” in Proc. IEEE Int. Wireless Symp., 2013, pp. 1–4. [Google Scholar]
- [24].Albrecht N. C., Heyer M., Wenzel M., Langer D., Lu H., and Koelpin A., “Long-distance heart sound detection using 122 GHz CW radar with 3D printed high-gain antennas,” in Proc. IEEE Radio Wireless Symp., 2023, pp. 34–36. [Google Scholar]
- [25].Wang J. and Li C., “A portable Doppler/FSK/FMCW multi-mode radar with analog DC offset cancellation for biomedical applications,” in Proc. IEEE United States Nat. Committee URSI Nat. Radio Sci. Meeting, 2019, pp. 1–2. [Google Scholar]
- [26].Kaineder A., Mangiavillano C., Ahmed F., Furqan M., and Stelzer A., “240-GHz system on chip FMCW radar for short range applications,” in Proc. IEEE MTT-S Int. Conf. Microw. Intell. Mobility, 2020, pp. 1–4. [Google Scholar]
- [27].Ahmed F., Furqan M., Aufinger K., and Stelzer A., “A 240-GHz FMCW radar transceiver with 10 dBm output power using quadrature combining,” in Proc. IEEE 15th Eur. Microw. Integr. Circuits Conf., 2021, pp. 281–284. [Google Scholar]
- [28].Schuster S., Scheiblhofer S., and Stelzer A., “The influence of windowing on bias and variance of DFT-Based frequency and phase estimation,” IEEE Trans. Instrum. Meas., vol. 58, no. 6, pp. 1975–1990, Jun. 2009. [Google Scholar]
- [29].Scherr S., Ayhan S., Pauli M., and Zwick T., “Accuracy limits of a K-band FMCW radar with phase evaluation,” in Proc. IEEE 9th Eur. Radar Conf., 2012, pp. 246–249. [Google Scholar]
- [30].Will C. et al. , “Local pulse wave detection using continuous wave radar systems,” IEEE J. Electromagn., RF, Microw. Med. Biol., vol. 1, no. 2, pp. 81–89, Dec. 2017. [Google Scholar]
- [31].Boyer W. D., “A Diplex, Doppler phase comparison radar,” IEEE Trans. Aerosp. Navigational Electron., vol. TANE-10, no. 1, pp. 27–33, Mar. 1963. [Google Scholar]
- [32].Fife D. W., “Image frequency rejection in a radio direction finder,” IEEE Trans. Aerosp. Navigational Electron., vol. TANE-10, no. 2, pp. 128–132, Jun. 1963. [Google Scholar]
- [33].Wang Y., Liu Q., and Fathy A. E., “CW and PulseDoppler radar processing based on FPGA for human sensing applications,” IEEE Trans. Geosci. Remote Sens., vol. 51, no. 5, pp. 3097–3107, May 2013. [Google Scholar]
- [34].Fioranelli F. et al. , Eds., Micro-Doppler Radar and Its Applications. Inst. Eng. Technol., 2020, pp. 1–424. [Google Scholar]
- [35].Tahmoush D., “Review of micro-Doppler signatures,” IET Radar, Sonar Navigation, vol. 9, no. 9, pp. 1140–1146, 2015. [Google Scholar]
- [36].Richards M. A., Fundamentals of Radar Signal Processing, 2nd ed. New York, NY, USA: McGraw-Hill, 2014. [Google Scholar]
- [37].Ahmed S., Schiessl A., Gumbmann F., Tiebout M., Methfessel S., and Schmidt L.-P., “Advanced microwave imaging,” IEEE Microw. Mag., vol. 13, no. 6, pp. 26–43, Sep. 2012. [Google Scholar]
- [38].Bliss D. and Forsythe K., “Multiple-input multiple-output (MIMO) radar and imaging: Degrees of freedom and resolution,” in Proc. IEEE 37th Asilomar Conf. Signals, Syst. Comput., 2003, pp. 54–59. [Google Scholar]
- [39].Piotrowsky L., Kueppers S., Jaeschke T., and Pohl N., “Distance measurement using mmWave radar: Micron accuracy at medium range,” IEEE Trans. Microw. Theory Techn., vol. 70, no. 11, pp. 5259–5270, Nov. 2022. [Google Scholar]
- [40].Tschapek P., Korner G., Carlowitz C., and Vossiek M., “Detailed analysis and modeling of phase noise and systematic phase distortions in FMCW radar systems,” IEEE J. Microw., vol. 2, no. 4, pp. 648–659, Oct. 2022. [Google Scholar]
- [41].Stove A. G., “Linear FMCW radar techniques,” IEE Proc. F Radar Signal Process., vol. 139, no. 5, pp. 343–350, 1992. [Google Scholar]
- [42].Vossiek M., Haberberger N., Krabbe L., Hehn M., Carlowitz C., and Stelzig M., “A tutorial on the sequential sampling impulse radar concept and selected applications,” IEEE J. Microw., vol. 3, no. 1, pp. 523–539, Jan. 2023. [Google Scholar]
- [43].Ali F. and Vossiek M., “Detection of weak moving targets based on 2-D range-doppler FMCW radar fourier processing,” in Proc. IEEE German Microw. Conf. Dig. Papers, 2010, pp. 214–217. [Google Scholar]
- [44].Wojtkiewicz A., Misiurewicz J., Nalecz M., Jedrzejewski K., and Kulpa K., “Two-dimensional signal processing in FMCW radars,” in Proc. 20th KKTOiUE, 1997, pp. 475–480. [Google Scholar]
- [45].Taunk K., De S., Verma S., and Swetapadma A., “A brief review of nearest neighbor algorithm for learning and classification,” in Proc. IEEE Int. Conf. Intell. Comput. Control Syst., 2019, pp. 1255–1260. [Google Scholar]
- [46].Seifert A.-K., Zoubir A. M., and Amin M. G., “Radar classification of human gait abnormality based on sum-of-harmonics analysis,” in Proc. IEEE Radar Conf., 2018, pp. 940–945. [Google Scholar]
- [47].Seifert A.-K., Amin M. G., and Zoubir A. M., “Toward unobtrusive in-home gait analysis based on radar micro-Doppler signatures,” IEEE Trans. Biomed. Eng., vol. 66, no. 9, pp. 2629–2640, Sep. 2019. [DOI] [PubMed] [Google Scholar]
- [48].Hong H., Zhang L., Gu C., Li Y., Zhou G., and Zhu X., “Noncontact sleep stage estimation using a CW Doppler radar,” IEEE Trans. Emerg. Sel. Topics Circuits Syst., vol. 8, no. 2, pp. 260–270, Jun. 2018. [Google Scholar]
- [49].He M., Nian Y., Zhang Z., Liu X., and Hu H., “Human fall detection based on machine learning using a THz radar system,” in Proc. IEEE Radar Conf., 2019, pp. 1–5. [Google Scholar]
- [50].Hanifi K. and Karsligil M. E., “Elderly fall detection with vital signs monitoring using CW Doppler radar,” IEEE Sensors J., vol. 21, no. 15, pp. 16969–16978, Aug. 2021. [Google Scholar]
- [51].Biau G. and Scornet E., “A random forest guided tour,” TEST, vol. 25, no. 2, pp. 197–227, Jun. 2016. [Google Scholar]
- [52].Ha U., Madani S., and Adib F., “WiStress: Contactless stress monitoring using wireless signals,” Proc. ACM Interactive, Mobile, Wearable Ubiquitous Technol., vol. 5, no. 3, pp. 1–37, Sep. 2021. [Google Scholar]
- [53].Rahman T. et al. , “DoppleSleep: A contactless unobtrusive sleep sensing system using short-range doppler radar,” in Proc. ACM Int. Joint Conf. Pervasive Ubiquitous Comput., New York, NY, USA, 2015, pp. 39–50. [Google Scholar]
- [54].Li H., Mehul A., Kernec J. Le, Gurbuz S. Z., and Fioranelli F., “Sequential human gait classification with distributed radar sensor fusion,” IEEE Sensors J., vol. 21, no. 6, pp. 7590–7603, Mar. 2021. [Google Scholar]
- [55].Bhavanasi G., Werthen-Brabants L., Dhaene T., and Couckuyt I., “Patient activity recognition using radar sensors and machine learning,” Neural Comput. Appl., vol. 34, no. 18, pp. 16033–16048, Sep. 2022. [Google Scholar]
- [56].Lewis D. D., “Naive (Bayes) at forty: The independence assumption in information retrieval,” in Proc. Conf. Mach. Learn., 1998, pp. 4–15. [Google Scholar]
- [57].Pregibon D., “Logistic regression diagnostics,” Ann. Statist., vol. 9, no. 4, pp. 705–724, Jul. 1981. [Google Scholar]
- [58].Seifert A.-K., Zoubir A. M., and Amin M. G., “Detection of gait asymmetry using indoor doppler radar,” in Proc. IEEE Radar Conf., 2019, pp. 1–6. [Google Scholar]
- [59].Groß J., Linear Regression. Berlin, Germany: Springer, 2003. [Google Scholar]
- [60].Javaid A. Q., Noble C. M., Rosenberg R., and Weitnauer M. A., “Towards sleep apnea screening with an under-the-mattress IR-UWB radar using machine learning,” in Proc. IEEE 14th Int. Conf. Mach. Learn. Appl., 2015, pp. 837–842. [Google Scholar]
- [61].Pisner D. A. and Schnyer D. M., “Chapter 6 - Support vector machine,” in Machine Learning, Mechelli A. and Vieira S., Eds. San Francisco, CA, USA: Academic Press, 2020, pp. 101–121. [Google Scholar]
- [62].Erol B., Amin M. G., Boashash B., Ahmad F., and Zhang Y. D., “Wideband radar based fall motion detection for a generic elderly,” in Proc. IEEE 50th Asilomar Conf. Signals, Syst. Comput., 2016, pp. 1768–1772. [Google Scholar]
- [63].Bank D., Koenigstein N., and Giryes R., “Autoencoders,” in Machine Learning for Data Science Handbook: Data Mining and Knowledge Discovery Handbook, Rokach L., Maimon O., and Shmueli E. Eds. Cham, Switzerland: Springer, 2023, pp. 353–374. [Google Scholar]
- [64].Jokanovic B., Amin M., and Ahmad F., “Radar fall motion detection using deep learning,” in Proc. IEEE Radar Conf., 2016, pp. 1–6. [Google Scholar]
- [65].Shah S. A. et al. , “Sensor fusion for identification of freezing of gait episodes using Wi-Fi and radar imaging,” IEEE Sensors J., vol. 20, no. 23, pp. 14410–14422, Dec. 2020. [Google Scholar]
- [66].Hochreiter S. and Schmidhuber J., “Long short-term memory,” Neural Comput., vol. 9, no. 8, pp. 1735–1780, Nov. 1997. [DOI] [PubMed] [Google Scholar]
- [67].Shi K. et al. , “Contactless analysis of heart rate variability during cold pressor test using radar interferometry and bidirectional LSTM networks,” Sci. Rep., vol. 11, no. 1, Dec. 2021, Art. no. 3025. [DOI] [PMC free article] [PubMed] [Google Scholar]
- [68].Kwon H. B. et al. , “Attention-based LSTM for non-contact sleep stage classification using IR-UWB radar,” IEEE J. Biomed. Health Informat., vol. 25, no. 10, pp. 3844–3853, Oct. 2021. [DOI] [PubMed] [Google Scholar]
- [69].Shi K. et al. , “Segmentation of radar-recorded heart sound signals using bidirectional LSTM networks,” in Proc. IEEE 41st Annu. Int. Conf. Eng. Med. Biol. Soc., 2019, pp. 6677–6680. [DOI] [PubMed] [Google Scholar]
- [70].Li Z., Liu F., Yang W., Peng S., and Zhou J., “A survey of convolutional neural networks: Analysis, applications, and prospects,” IEEE Trans. Neural Netw. Learn. Syst., vol. 33, no. 12, pp. 6999–7019, Dec. 2022. [DOI] [PubMed] [Google Scholar]
- [71].Kernec J. Le et al. , “Radar signal processing for sensing in assisted living: The challenges associated with real-time implementation of emerging algorithms,” IEEE Signal Process. Mag., vol. 36, no. 4, pp. 29–41, Jul. 2019. [Google Scholar]
- [72].Huang H. et al. , “UNet 3+: A full-scale connected UNet for medical image segmentation,” in Proc. IEEE Int. Conf. Acoust., Speech, Signal Process., 2020, pp. 1055–1059. [DOI] [PMC free article] [PubMed] [Google Scholar]
- [73].Vaswani A. et al. , “Attention is all you need,” in Proc. Int. Conf. Adv. Neural Inf. Process. Syst., 2017, vol. 30, pp. 6000–6010. [Google Scholar]
- [74].Touvron H., Cord M., Douze M., Massa F., Sablayrolles A., and Jegou H., “Training data-efficient image transformers & distillation through attention,” in Proc. 38th Int. Conf. Mach. Learn., 2021, pp. 10347–10357. [Google Scholar]
- [75].Dey A., Rajan S., Xiao G., and Lu J., “Light-weight learning model with patch embeddings for radar-based fall event classification: A multi-domain decision fusion approach,” in Proc. IEEE Radar Conf., 2023, pp. 1–6. [Google Scholar]
- [76].Huan S. et al. , “A lightweight hybrid vision transformer network for radar-based human activity recognition,” Sci. Rep., vol. 13, no. 1, Oct. 2023, Art. no. 17996. [DOI] [PMC free article] [PubMed] [Google Scholar]
- [77].Zhao Y., Guendel R. G., Yarovoy A., and Fioranelli F., “Distributed radar-based human activity recognition using vision transformer and CNNs,” in Proc. IEEE 18th Eur. Radar Conf., 2022, pp. 301–304. [Google Scholar]
- [78].Lai D. K.-H. et al. , “Vision transformers (ViT) for blanket-penetrating sleep posture recognition using a triple ultra-wideband (UWB) radar system,” Sensors, vol. 23, no. 5, Jan. 2023, Art. no. 2475. [DOI] [PMC free article] [PubMed] [Google Scholar]
- [79].Ma B., Egiazarian K. O., and Chen B., “Low-resolution radar target classification using vision transformer based on micro-Doppler signatures,” IEEE Sensors J., vol. 23, no. 22, pp. 28474–28485, Nov. 2023. [Google Scholar]
- [80].Murtagh F., “Multilayer perceptrons for classification and regression,” Neurocomputing, vol. 2, no. 5, pp. 183–197, Jul. 1991. [Google Scholar]
- [81].Yue S., Yang Y., Wang H., Rahul H., and Katabi D., “BodyCompass: Monitoring sleep posture with wireless signals,” Proc. ACM Interactive, Mobile, Wearable Ubiquitous Technol., vol. 4, no. 2, pp. 66:1–66:25, Jun. 2020. [Google Scholar]
- [82].Zhou Z.-H., Machine Learning. Berlin, Germany: Springer, Aug. 2021. [Google Scholar]
- [83].Berry M. W., Mohamed A., and Yap B. W., Supervised and Unsupervised Learning for Data Science, Ser. Unsupervised and Semi-Supervised Learning. Cham, Switzerland: Springer, 2020. [Google Scholar]
- [84].Sarker I. H., “Deep learning: A comprehensive overview on techniques, taxonomy, applications and research directions,” SN Comput. Sci., vol. 2, no. 6, Aug. 2021, Art. no. 420. [DOI] [PMC free article] [PubMed] [Google Scholar]
- [85].LeCun Y., Bengio Y., and Hinton G., “Deep learning,” Nature, vol. 521, no. 7553, pp. 436–444, May 2015. [DOI] [PubMed] [Google Scholar]
- [86].Saraswat D. et al. , “Explainable AI for healthcare 5.0: Opportunities and challenges,” IEEE Access, vol. 10, pp. 84486–84517, 2022. [Google Scholar]
- [87].Zhao Q., Adeli E., and Pohl K. M., “Training confounder-free deep learning models for medical applications,” Nature Commun., vol. 11, no. 1, Nov. 2020, Art. no. 6010. [DOI] [PMC free article] [PubMed] [Google Scholar]
- [88].Khan U. M., Rigazio L., and Shahzad M., “Contactless monitoring of PPG using radar,” Proc. ACM Interactive, Mobile, Wearable Ubiquitous Technol., vol. 6, no. 3, pp. 1–30, Sep. 2022. [Google Scholar]
- [89].Yang Y. et al. , “Artificial intelligence-enabled detection and assessment of Parkinson's disease using nocturnal breathing signals,” Nature Med., vol. 28, no. 10, pp. 2207–2215, Oct. 2022. [DOI] [PMC free article] [PubMed] [Google Scholar]
- [90].Kern N., Steiner M., Lorenzin R., and Waldschmidt C., “Robust Doppler-based gesture recognition with incoherent automotive radar sensor networks,” IEEE Sensors Lett., vol. 4, no. 11, pp. 1–4, Nov. 2020. [Google Scholar]
- [91].Ullmann I., Guendel R. G., Kruse N. C., Fioranelli F., and Yarovoy A., “A survey on radar-based continuous human activity recognition,” IEEE J. Microw., vol. 3, no. 3, pp. 938–950, Jul. 2023. [Google Scholar]
- [92].Yamamoto K. and Ohtsuki T., “Non-contact heartbeat detection by heartbeat signal reconstruction based on spectrogram analysis with convolutional LSTM,” IEEE Access, vol. 8, pp. 123603–123613, 2020. [Google Scholar]
- [93].Mogi E. and Ohtsuki T., “Heartbeat detection with Doppler radar based on spectrogram,” in Proc. IEEE Int. Conf. Commun., 2017, pp. 1–6. [Google Scholar]
- [94].Braeunig J. et al. , “Radar-based recognition of activities of daily living in the palliative care context using deep learning,” in Proc. IEEE EMBS Int. Conf. Biomed. Health Informat., 2023, pp. 1–4. [Google Scholar]
- [95].Janiesch C., Zschech P., and Heinrich K., “Machine learning and deep learning,” Electron. Markets, vol. 31, no. 3, pp. 685–695, Sep. 2021. [Google Scholar]
- [96].Robinson M. C., Glen R. C., and Lee A. A., “Validating the validation: Reanalyzing a large-scale comparison of deep learning and machine learning models for bioactivity prediction,” J. Comput.-Aided Mol. Des., vol. 34, no. 7, pp. 717–730, Jul. 2020. [DOI] [PMC free article] [PubMed] [Google Scholar]
- [97].Chen Z., Zheng T., Cai C., and Luo J., “MoVi-Fi: Motion-robust vital signs waveform recovery via deep interpreted RF sensing,” in Proc. 27th Annu. Int. Conf. Mobile Comput. Netw., 2021, pp. 392–405. [Google Scholar]
- [98].Kern N., Aguilar J., Grebner T., Meinecke B., and Waldschmidt C., “Learning on multistatic simulation data for radar-based automotive gesture recognition,” IEEE Trans. Microw. Theory Techn., vol. 70, no. 11, pp. 5039–5050, Nov. 2022. [Google Scholar]
- [99].Schasler C., Hoffmann M., Braunig J., Ullmann I., Ebelt R., and Vossiek M., “A realistic radar ray tracing simulator for large MIMO-Arrays in automotive environments,” IEEE J. Microw., vol. 1, no. 4, pp. 962–974, Oct. 2021. [Google Scholar]
- [100].Jobin A., Ienca M., and Vayena E., “The global landscape of AI ethics guidelines,” Nature Mach. Intell., vol. 1, no. 9, pp. 389–399, Sep. 2019. [Google Scholar]
- [101].Hong H. et al. , “Microwave sensing and sleep: Noncontact sleep-monitoring technology with microwave biomedical radar,” IEEE Microw. Mag., vol. 20, no. 8, pp. 18–29, Aug. 2019. [Google Scholar]
- [102].Tabassum A. and Ahad M. A. R., “Biomedical radar and antenna systems for contactless human activity analysis,” in Vision, Sensing and Analytics: Integrative Approaches. Berlin, Germany: Springer, 2021, pp. 213–241. [Google Scholar]
- [103].Metcalf J. G., McDaniel J., Ruyle J., Goodman N., and Borders J. C., “An examination of frequency-modulated continuous wave radar for biomedical imaging,” in Proc. IEEE Int. Radar Conf., 2020, pp. 996–1001. [Google Scholar]
- [104].Lauteslager T., “Coherent ultra-wideband radar-on-chip for biomedical sensing and imaging,” Ph.D. dissertation, Imperial College London, London, U.K., 2019. [Google Scholar]
- [105].Nahar S., “Design and implementation of a stepped frequency continuous wave radar system for biomedical applications,” Ph.D. dissertation, University of Tennessee, Knoxville, TN, USA, 2018. [Google Scholar]
- [106].Paolini G., “Microwave radar and wireless power transfer systems for biomedical and industrial applications,” Ph.D. dissertation, University of Bologna, Bologna, Italy, 2021. [Google Scholar]
- [107].Qiao J.-H. et al. , “Contactless multiscale measurement of cardiac motion using biomedical radar sensor,” Front. Cardiovasc. Med., vol. 9, 2022, Art. no. 1057195. [DOI] [PMC free article] [PubMed] [Google Scholar]
- [108].Dai X., Zhou Z., Zhang J. J., and Davidson B., “Ultra-wideband radar based human body landmark detection and tracking with biomedical constraints for human motion measuring,” in Proc. IEEE 48th Asilomar Conf. Signals, Syst. Comput., 2014, pp. 1752–1756. [Google Scholar]
- [109].Hein M. A., “Ultra-wideband radar sensors for biomedical diagnostics and imaging,” in Proc. IEEE Int. Conf. Ultra-Wideband, 2012, pp. 486–490. [Google Scholar]
- [110].Mercuri M. et al. , “Analysis of an indoor biomedical radar-based system for health monitoring,” IEEE Trans. Microw. Theory Techn., vol. 61, no. 5, pp. 2061–2068, May 2013. [Google Scholar]
- [111].Mincica M., “UWB analog multiplier in 90 nm CMOS SoC pulse radar sensor for biomedical applications,” Ph.D. dissertation, Università di Pisa, Pisa PI, Italy, 2011. [Google Scholar]
- [112].Kazim E. and Koshiyama A. S., “A high-level overview of AI ethics,” Patterns, vol. 2, no. 9, Sep. 2021, Art. no. 100314. [DOI] [PMC free article] [PubMed] [Google Scholar]
- [113].Attard-Frost B., Ríos A. De Los, and Walters D. R., “The ethics of AI business practices: A review of 47 AI ethics guidelines,” AI Ethics, vol. 3, no. 2, pp. 389–406, May 2023. [Google Scholar]
- [114].Fioranelli F. and Kernec J. Le, “Radar sensing for human healthcare: Challenges and results,” in Proc. IEEE Sensors, Oct. 2021, pp. 1–4. [Google Scholar]
- [115].Ferrari R., “Writing narrative style literature reviews,” Med. Writing, vol. 24, no. 4, pp. 230–235, Dec. 2015. [Google Scholar]
- [116].Braun M. and Hummel P., “Data justice and data solidarity,” Patterns, vol. 3, no. 3, 2022, Art. no. 100427. [DOI] [PMC free article] [PubMed] [Google Scholar]
- [117].Paolini G., “Microwave radar systems for indoor localization and biomedical applications,” Riunione GTTI-SIEm, pp. 1–8, 2019.
- [118].Xi Q., Wang H., Dong S., and Ran L., “A reconfigurable active beamforming array for biomedical radar applications,” in Proc. IEEE MTT-S Int. Microw. Biomed. Conf., 2019, vol. 1, pp. 1–3. [Google Scholar]
- [119].Mercuri M., Soh P. J., Mehrjouseresht P., Crupi F., and Schreurs D., “Biomedical radar system for real-time contactless fall detection and indoor localization,” IEEE J. Electromagn., RF, Microw. Med. Biol., vol. 7, no. 4, pp. 303–312, Dec. 2023. [Google Scholar]
- [120].Wickramarachchi D. N., Rana S. P., Ghavami M., and Dudley S., “Comparison of IR-UWB radar SoC for non-contact biomedical application,” in Proc. IEEE 17th Int. Symp. Med. Inf. Commun. Technol., 2023, pp. 01–06. [Google Scholar]
- [121].Schwartz J. R. and Roth T., “Neurophysiology of sleep and wakefulness: Basic science and clinical implications,” Curr. Neuropharmacol., vol. 6, no. 4, pp. 367–378, Dec. 2008. [DOI] [PMC free article] [PubMed] [Google Scholar]
- [122].Iber C. et al. , “Polysomnography performed in the unattended home versus the attended laboratory SettingSleep heart health study methodology,” Sleep, vol. 27, no. 3, pp. 536–540, May 2004. [DOI] [PubMed] [Google Scholar]
- [123].Seifert A.-K., Grimmer M., and Zoubir A. M., “Doppler radar for the extraction of biomechanical parameters in gait analysis,” IEEE J. Biomed. Health Informat., vol. 25, no. 2, pp. 547–558, Feb. 2021. [DOI] [PubMed] [Google Scholar]
- [124].Fritz S. and Lusardi M., “White paper: ‘Walking speed: The sixth vital sign’,” J. Geriatr. Phys. Ther., vol. 32, no. 2, pp. 2–5, 2009. [PubMed] [Google Scholar]
- [125].Saho K., Shioiri K., Kudo S., and Fujimoto M., “Estimation of gait parameters from trunk movement measured by Doppler radar,” IEEE J. Electromagn., RF, Microw. Med. Biol., vol. 6, no. 4, pp. 461–469, Dec. 2022. [Google Scholar]
- [126].Lee S.-P., Kini N. P., Peng W.-H., Ma C.-W., and Hwang J.-N., “HuPR: A benchmark for human pose estimation using millimeter wave radar,” in Proc. IEEE/CVF Winter Conf. Appl. Comput. Vis., 2023, pp. 5715–5724. [Google Scholar]
- [127].Sengupta A., Jin F., Zhang R., and Cao S., “Mm-pose: Real-time human skeletal posture estimation using mmWave radars and CNNs,” IEEE Sensors J., vol. 20, no. 17, pp. 10032–10044, Sep. 2020. [Google Scholar]
- [128].Yu C. et al. , “RFPose-OT: RF-based 3D human pose estimation via optimal transport theory,” Front. Inf. Technol. Electron. Eng., vol. 24, no. 10, pp. 1445–1457, 2023. [Google Scholar]
- [129].Zhao M. et al. , “Through-wall human pose estimation using radio signals,” in Proc. IEEE Conf. Comput. Vis. Pattern Recognit., 2018, pp. 7356–7365. [Google Scholar]
- [130].Alanazi M. A. et al. , “Towards a low-cost solution for gait analysis using millimeter wave sensor and machine learning,” Sensors, vol. 22, no. 15, Jul. 2022, Art. no. 5470. [DOI] [PMC free article] [PubMed] [Google Scholar]
- [131].Maitre J., Bouchard K., and Gaboury S., “Fall detection with UWB radars and CNN-LSTM architecture,” IEEE J. Biomed. Health Informat., vol. 25, no. 4, pp. 1273–1283, Apr. 2021. [DOI] [PubMed] [Google Scholar]
- [132].Wang B., Zheng Z., and Guo Y.-X., “Millimeter-wave frequency modulated continuous wave radar-based soft fall detection using pattern contour-confined Doppler-time maps,” IEEE Sensors J., vol. 22, no. 10, pp. 9824–9831, May 2022. [Google Scholar]
- [133].Fan L., Li T., Yuan Y., and Katabi D., “In-home daily-life captioning using radio signals,” in Proc. 16th Eur. Conf. Comput. Vis., 2020, pp. 105–123. [Google Scholar]
- [134].Wen L. et al. , “Noncontact monitoring of infant apnea for hypoxia prevention using a K-band biomedical radar,” in Proc. IEEE/MTT-S Int. Microw. Symp.-IMS, 2023, pp. 983–986. [Google Scholar]
- [135].European Commission, “Safer and healthier work for all - modernisation of the EU occupational safety and health legislation and policy,” Commission Staff Working Document, 2017.
- [136].McEwen B. S., “Stress, adaptation, and disease: Allostasis and allostatic load,” Ann. New York Acad. Sci., vol. 840, no. 1, pp. 33–44, 1998. [DOI] [PubMed] [Google Scholar]
- [137].Cohen S., Janicki-Deverts D., and Miller G. E., “Psychological stress and disease,” JAMA, vol. 298, no. 14, pp. 1685–1687, Oct. 2007. [DOI] [PubMed] [Google Scholar]
- [138].Rohleder N., “Stress and inflammation the need to address the gap in the transition between acute and chronic stress effects,” Psychoneuroendocrinology, vol. 105, pp. 164–171, 2019. [DOI] [PubMed] [Google Scholar]
- [139].Kirschbaum C., Pirke K.-M., and Hellhammer D. H., “The ‘trier social stress test’ a tool for investigating psychobiological stress responses in a laboratory setting,” Neuropsychobiology, vol. 28, no. 1/2, pp. 76–81, 1993. [DOI] [PubMed] [Google Scholar]
- [140].Ulrich-Lai Y. M. and Herman J. P., “Neural regulation of endocrine and autonomic stress responses,” Nature Rev. Neurosci., vol. 10, no. 6, pp. 397–409, Jun. 2009. [DOI] [PMC free article] [PubMed] [Google Scholar]
- [141].Sapolsky R. M., Romero L. M., and Munck A. U., “How do glucocorticoids influence stress responses? Integrating permissive, suppressive, stimulatory, and preparative actions,” Endocr. Rev., vol. 21, no. 1, pp. 55–89, Feb. 2000. [DOI] [PubMed] [Google Scholar]
- [142].Gradl S., Wirth M., Richer R., Rohleder N., and Eskofier B. M., “An overview of the feasibility of permanent, real-time, unobtrusive stress measurement with current wearables,” in Proc. 13th EAI Int. Conf. Pervasive Comput. Technol. Healthcare, 2019, pp. 360–365. [Google Scholar]
- [143].Saxbe D. E., “A field (researcher's) guide to cortisol: Tracking HPA axis functioning in everyday life,” Health Psychol. Rev., vol. 2, no. 2, pp. 163–190, Sep. 2008. [Google Scholar]
- [144].Liang K., Zhou A., Zhang Z., Zhou H., Ma H., and Wu C., “mmStress: Distilling human stress from daily activities via contact-less millimeter-wave sensing,” Proc. ACM Interactive, Mobile, Wearable Ubiquitous Technol., vol. 7, no. 3, pp. 1–36, Sep. 2023. [Google Scholar]
- [145].Muhammad S. et al. , “A contactless and non-intrusive system for driver's stress detection,” in Proc. Adjunct Proc. ACM Int. Joint Conf. Pervasive Ubiquitous Comput., ACM Int. Symp. Wearable Comput., 2023, pp. 58–62. [Google Scholar]
- [146].Han Y., Lauteslager T., Lande T. S., and Constandinou T. G., “UWB radar for non-contact heart rate variability monitoring and mental state classification,” in Proc. IEEE 41st Annu. Int. Conf. Eng. Med. Biol. Soc., 2019, pp. 6578–6582. [DOI] [PubMed] [Google Scholar]
- [147].Lee W., Dinc T., and Valdes-Garcia A., “Multi-mode 60-GHz radar transmitter SoC in 45-nm SOI CMOS,” IEEE J. Solid-State Circuits, vol. 55, no. 5, pp. 1187–1198, May 2020. [Google Scholar]
- [148].Ritter P. et al. , “A fully integrated 78 GHz automotive radar system-an-chip in 22 nm FD-SOI CMOS,” in Proc. IEEE 17th Eur. Radar Conf., 2021, pp. 57–60. [Google Scholar]
- [149].Ng H. J. and Kissinger D., “Highly miniaturized 120-GHz SIMO and MIMO radar sensor with on-chip folded dipole antennas for range and angular measurements,” IEEE Trans. Microw. Theory Techn., vol. 66, no. 6, pp. 2592–2603, Jun. 2018. [Google Scholar]
- [150].Huang J., Galal G., Etemadi M., and Vaidyanathan M., “Evaluation and mitigation of racial bias in clinical machine learning models: Scoping review,” JMIR Med. Inf., vol. 10, no. 5, 2022, Art. no. e36388. [DOI] [PMC free article] [PubMed] [Google Scholar]
- [151].Zuboff S., The Age of Surveillance Capitalism: The Fight for a Human Future at the New Frontier of Power. New York, NY, USA: Public Affairs, 2019. [Google Scholar]
- [152].Zhou H., Zhao Y., Liu Y., Lu S., An X., and Liu Q., “Multi-sensor data fusion and CNN-LSTM model for human activity recognition system,” Sensors, vol. 23, no. 10, Jan. 2023, Art. no. 4750. [DOI] [PMC free article] [PubMed] [Google Scholar]