Abstract
The N-nitroso-derivative of melatonin, NOM (1-nitrosomelatonin), which has been demonstrated to be a NO• [oxidonitrogen(•)] donor in buffered solutions, is a new potential drug particularly in neurological diseases. The advantage of NOM, a very lipophilic drug, is its ability to release both melatonin and NO•, an easily diffusible free radical. In order to evaluate the distribution and the pharmacokinetics of NOM, [O-methyl-3H]NOM was administered to and followed in mice. A complementary method for monitoring NOM, EPR, was performed in vitro and ex vivo with (MGD)2–Fe2+ (iron–N-methyl-D-glucamine dithiocarbamate) complex as a spin trap. The behaviour of NOM was compared with that of GSNO (S-nitrosoglutathione), a hydrophilic NO• donor. In the first minutes following [O-methyl-3H]NOM intraperitoneal injection, the radioactivity was found in organs (6% in the liver, 1% in the kidney and 0.6% in the brain), but not in the blood. In both liver and brain, the radioactivity content decreased over time with similar kinetics reflecting the diffusion and metabolism of NOM and of its metabolites. Based on the characterization and the quantification of the EPR signal in vitro with NOM or GSNO using (MGD)2–Fe2+ complex in phosphate-buffered solutions, the detection of these nitroso compounds was realized ex vivo in mouse tissue extracts. (MGD)2–Fe2+–NO was observed in the brain of NOM-treated mice in the first 10 min following injection, revealing that NOM was able to cross the blood–brain barrier, while GSNO was not.
Keywords: EPR, melatonin, N-methyl-D-glucamine dithiocarbamate (MGD), nitrosoglutathione (GSNO), 1-nitrosomelatonin (NOM), NO•-donor
Abbreviations: GSNO, S-nitrosoglutathione; i.p., intraperitoneal; MGD, N-methyl-D-glucamine dithiocarbamate; NOM, 1-nitrosomelatonin
INTRODUCTION
NO• [oxidonitrogen(•)] is a regulator of numerous physiological and pathological functions. Biosynthesized from L-arginine or released from endogenous NO• stores (nitrosyl-metal-containing molecules, nitrosothiols, nitrosoamines and hydroxyguanidines), its lifespan has been estimated to be a few seconds in mammals. Apart from trapping by haemoproteins or iron-containing molecules, the fate of NO• is controlled by reactions with molecular dioxygen and reactive oxygen species, leading to nitrosating (ONOO• radical, N2O3) and nitrating (peroxynitrite) NO• derivatives, and in the end to nitrite (NO2−) and nitrate (NO3−). Nitrosation could occur on thiols and indole derivatives giving nitroso compounds, which are in turn NO•-donors. In the case of thiols, GSNO (S-nitrosoglutathione) and S-nitrosoproteins have been detected in various biological samples and are the focus of numerous studies. Little is known about N-nitrosoamines [1]. In vitro experiments have demonstrated that NOM (1-nitrosomelatonin) could be formed from melatonin under physiological conditions, by NO• and O2 or by peroxynitrite (ONOO−, ONOOH and ONOOCO2−)-driven reactions [2,3]. NOM decomposes in buffered solutions at neutral pH, giving NO• and melatonin [4]. Taking into account that melatonin is able to cross the blood–brain barrier, we considered that NOM could reach the central nervous system. Melatonin is described to inhibit oxidative pathology and increase survival in models of Alzheimer's disease [5], while a deficit of melatonin has been seen in the human pathology. Moreover, a NO• deficit is speculated from biochemical studies and attributed to an increased conversion into peroxynitrite (ONOOH/ONOO−) by the action of oxidative species produced excessively in all neurodegenerative processes [6,7]. We speculate that pharmacological intervention using NO• donors and/or NO synthase inhibitors will be able to delay or minimize the development of brain pathology and progression of mental retardation [8].
The aim of the present study was therefore to evaluate the distribution of NOM after i.p. (intraperitoneal) injection in mice and its ability to reach the cerebral compartment. Since the quantification of such an unstable compound in biological extracts is not possible, the pharmacokinetics of NOM were estimated in mice following [3H]NOM i.p. injection. Moreover, the detection of NOM and GSNO was studied by EPR using a specific (MGD)2–Fe2+ (iron–N-methyl-D-glucamine dithiocarbamate) complex [9,10]. Assays were first performed in phosphate buffer solutions of NOM and GSNO, then detection was realized ex vivo in tissue extracts of treated mice.
MATERIALS AND METHODS
Materials
MGD was synthesized as described previously from N-methyl-D-glucamine (Sigma) and carbon disulphide (Sigma) [11]. GSNO was from Cayman Chemical Co. (Ann Arbor, MI, U.S.A.). FeSO4·7H2O was from Sigma. Sodium nitrite was from VWR Int. (Fontenay-sous-Bois, France). Tween 80 was from Merck. Sodium pentobarbital (6%, w/v) was from Sanofi-Synthélabo (Libourne, France). NOM was synthesized by nitrosation of melatonin (Sigma) following the procedure described by Bravo et al. [12].
Female C57BL6 mice (20–22 g) were from the Centre d’Elevage Janvier (Le Genest St Isle, France). They were housed and used in accordance with European Conventions for the use and care of laboratory animals.
[3H]NOM synthesis
[O-methyl-3H]NOM (0.7 mg, specific radioactivity 13.1 GBq/mg) (Amersham Biosciences) was diluted in 0.5 mg of unlabelled melatonin dissolved in 2 μl of methanol and 8.7 μl of ethanoic (acetic) acid. The mixture was cooled in an ice bath and treated with 10 μl of a 2.2 M sodium nitrite solution. The yellow solution was allowed to react for 5 min in a cold water bath before neutralization with 140 μl of a cold saturated solution of sodium bicarbonate. NOM was extracted with ethyl acetate, dried on anhydrous magnesium sulphate, and the solvent was evaporated under reduced pressure. The synthesis led to 1.25 mg of [O-methyl-3H]NOM (radioactivity=2×10⁸ c.p.m. counted using a Wallac 1400 DSA Radioactivity Counter) which was kept in the dark at −20 °C before use.
Distribution of the radioactivity after [3H]NOM i.p. injection
Female C57BL6 mice received an 800 μl i.p. injection of a physiological saline solution of [3H]NOM with 5% (v/v) ethanol, corresponding to a 5 mg/kg dose. The animals were killed by cervical dislocation 5, 10, 15, 30 or 60 min after injection, and blood was collected in a heparin tube. The head was then separated from the body for parallel collection of the organs and tissues (liver, kidney, brain and intestine). The organs were weighed, and a maximum of 300 mg of tissue samples was transferred into vials for solubilization in 3 ml of NCS-II tissue solubilizer (Amersham Biosciences) overnight at 40 °C. After complete dissolution, 17 ml of Aquasafe 500 Plus scintillant (Zinsser Analytic, Maidenhead, Berks., U.K.) was added, and the radioactivity was counted after 24 h in order to avoid interfering chemiluminescence. This experiment was repeated twice.
The radioactivity detected in the tissues was expressed as a percentage of the total injected radioactivity.
In vitro EPR measurements using (MGD)2–Fe2+ complex
EPR at 298K
A 10 mM (MGD)2–Fe2+ complex solution was prepared by mixing, under reduced pressure (in a vacutainer tube), 0.5 ml of nitrogen-purged solutions of 100 mM MGD in 50 mM Tris buffer, pH 7.5, and 0.5 ml of 20 mM FeSO4·7H2O in water. Then, 10 μl of a NOM, GSNO or nitrite solution was added while stirring. The mixture was transferred to a nitrogen-flushed quartz flat cell and the EPR signal was recorded for the following 60 min. EPR spectra were recorded with a Bruker ESP 300E-X band spectrometer (Wissenbourg, France) equipped with a TM110 cavity. The following parameters were selected for (MGD)2–Fe2+–NO detection: magnetic field, 340±6 mT; microwave power, 5 mW; microwave frequency, 9.73 GHz; modulation amplitude, 0.566 mT; modulation frequency, 100 kHz.
EPR at 77K
NOM (1%, w/v) dissolved in Tween 80 (Merck-Schuchardt) was diluted by 30% in 0.08 M Na2HPO4/0.02 M NaH2PO4 buffer, pH 7.5, and the concentration was measured by spectrophotometry (ε346=10900 M−1·cm−1). The 10 mM (MGD)2–Fe2+ complex was prepared by mixing, under argon, 1 vol. of argon-purged solution of 100 mM MGD in 0.1 M phosphate buffer, pH 7.5, and 1 vol. of argon-purged solution of 20 mM FeSO4·7H2O in water. The yellow solution was used within a few minutes. Under argon, a 0.1 ml fraction was added through a syringe to 0.4 ml of a 0.1 M phosphate-buffered NOM or GSNO solution, in a 5-mm-diameter EPR quartz tube. After 30 min, the tube was frozen and kept in liquid nitrogen until EPR analysis.
EPR spectra were recorded at 77 K with a Magnettech spectrometer (Berlin, Germany) characterized by a 100 mW microwave power, attenuated by 13 dB and a microwave frequency established between 9.3 and 9.6 GHz. The parameters selected for detection were: magnetic field, 331.5±20 mT; modulation amplitude, 5.73×10⁻⁵ T; modulation frequency, 100 kHz.
Ex vivo EPR measurements with (MGD)2–Fe2+ complex
Female C57BL6 mice received a 1 ml i.p. injection of a physiological saline solution of NOM, GSNO or vehicle. GSNO is very soluble in aqueous solution. In the case of NOM, 2.6 mg was magnetically stirred in 0.3 ml of Tween 80 and diluted in 1 ml of physiological saline solution. The NOM concentration was measured by spectrophotometry (ε346=10900). An i.p. injection of 1 ml containing 2.5 and 5 μmol into an animal of 20 g corresponded to a 32 and 65 mg/kg dose. Mice endured the injected dose for 7 min before being anaesthetized by an i.p. injection of 4.5 mg of pentobarbital. In order to eliminate the natural NO• trap haemoglobin, the blood was washed by perfusing the mice with a saline solution. The liver and brain were removed and weighed (approx. 1 g for liver and 0.42 g for brain) in a tissue-grinding device. A volume of 20% of the organ wet weight of 10 mM (MGD)2–Fe2+ complex solution was freshly prepared under argon and added to the tissue-grinding tube. A volume of argon-flushed 0.1 M phosphate buffer, pH 7.5, corresponding to 80% of the organ wet weight, was also added before homogenization. The extract was introduced into the 5-mm-diameter quartz EPR tube, kept for 30 min at room temperature (25 °C) and frozen in liquid nitrogen until measurement.
EPR spectra were recorded with a Magnettech spectrometer as indicated above. The peak-to-peak heights of the two first lines of the EPR spectra were used to quantify NO•-compounds with respect to those obtained with calibrated NOM or GSNO samples, and were expressed in arbitrary units.
RESULTS AND DISCUSSION
It is generally agreed that melatonin, as a hydrophobic hormone, spreads throughout the body when injected or ingested [13]. Its derivative, NOM, is even more hydrophobic and is expected to cross the blood–brain barrier and reach the central nervous system. In order to verify such a hypothesis, NOM was injected intraperitoneally into mice, and its detection was performed in brain. Similar experiments were also performed for comparison with a hydrophilic NO• donor, GSNO. GSNO releases NO• in vivo through chemical or reductive enzymatic pathways [14]. However, GSNO is very stable in aqueous neutral solution, while NOM decomposes under similar conditions. In phosphate buffer at pH 7.5, NOM decay lasts for hours, with a half-life of 2 h, and is not affected by an addition of GSH or metallic salts [4].
Distribution of NOM in mice using [3H]NOM
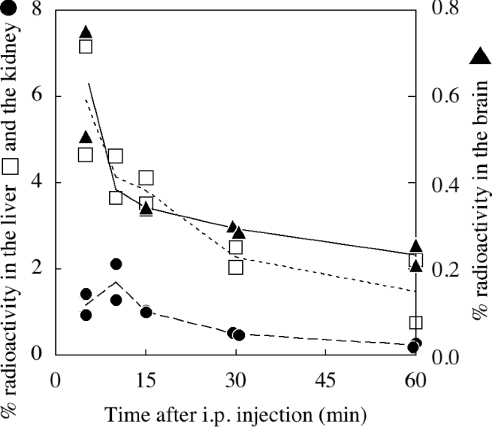
[O-methyl-3H]NOM was synthesized and injected intraperitoneally in mice. The radioactivity was measured in most of the body organs and tissues, the major part being found in the liver in the first 10 min and then in the intestinal tract in 30 min (results not shown). It is noteworthy that radioactivity was not detected in the blood. Considering, for instance, the liver, kidney and brain (Figure 1), the observed radioactivity was in the liver and brain at most 5 min after injection and in the kidney 10 min after injection. In the 10 min lag time, 6, 1 and 0.6% of the total injected radioactivity was recovered in the liver, kidney and brain respectively. Elimination from brain and liver followed similar patterns. Even though we could not distinguish using this method between labelled NOM, melatonin and their metabolites, we expected that most of the labelled molecules were still nitrosated when considering short times just after injection (5–10 min). Thus, in the first 10 min, we consider that NOM is issued in all organs, but mainly in the liver.
Figure 1. Pharmacokinetics of [3H]NOM in mice.
[3H]NOM was injected intraperitoneally into mice, and the radioactivity was then measured in solubilized organs or tissues. The radioactivity recovered in the liver (□), kidney (●) and brain (▲) was measured at definite times for 1 h. The radioactivity is expressed as a percentage of the total injected radioactivity. Two independent experiments were carried out.
In vitro EPR measurements of (MGD)2–Fe2+–NO from GSNO and NOM with (MGD)2–Fe2+
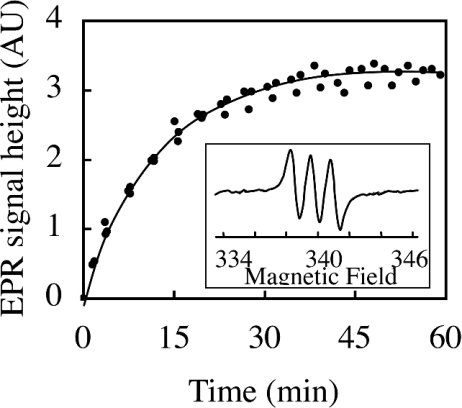
Since it was empirically found that NO• reacts avidly with iron dithiocarbamates giving a characteristic EPR triplet (g=2.04, aN=1.27 mT) [8,9], and that GSNO reacts with (MGD)2–Fe2+, transferring its NO group to the iron to give the same paramagnetic complex [15], each nitroso compound was incubated with freshly prepared (MGD)2–Fe2+ complex in 0.1 M phosphate buffer, pH 7.5, and EPR spectra were recorded in the minutes following mixing. When the (MGD)2–Fe2+ trap was added to NOM in Tris buffer, pH 7.5, an EPR triplet signal appeared, centred at g=2.04 with a nitrogen hyperfine coupling constant of 1.27 mT, characteristic of (MGD)2–Fe2+–NO at 298 K (Figure 2). The height of the EPR spectrum increased during the first 30 min and then reached a plateau, suggesting that total degradation of NOM occurred at this time. In the case of GSNO, experiments demonstrated that the (MGD)2–Fe2+–NO complex was obtained immediately after mixing, showing an identical signal intensity with similar concentrations of NOM and GSNO. The height of the signal was relevant to the level of these NO• donors in solution.
Figure 2. Relationship between the NOM concentration and the height of the EPR signal of (MGD)2–Fe2+–NO complex.
Peak-to-peak height of the first line of the (MGD)2–Fe2+–NO signal in the mixture of (MGD)2–Fe2+ and NOM plotted against time. At the initial time, the mixture of 50 mM MGD, 10 mM FeSO4 and 10 μM NOM in Tris buffer, pH 7.5, was introduced in a flat cell at 298 K. A spectrum was recorded every 1 min using a Bruker EPR spectrometer. The inset shows a typical spectrum obtained after 60 min with 10 μM NOM. The same spectra were obtained immediately with 10 μM GSNO. The EPR triplet signal centred at g=2.04 with a nitrogen hyperfine coupling constant of 1.27 mT is characteristic of (MGD)2–Fe2+–NO.
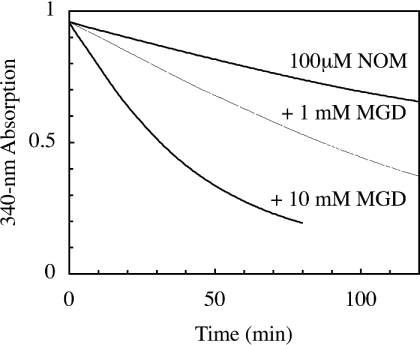
In previous experiments, we observed, using spectrophotometry, a slower decomposition of NOM in phosphate buffer, pH 7.5 (t1/2=120 min) [4], which was not shown to be affected by the presence of iron or copper salts. Therefore we suspected that MGD or (MGD)2–Fe2+ could accelerate its degradation or react with NOM. Spectrophotometric analyses showed that MGD increased the kinetic rate of NOM degradation (Figure 3). However, we assume that the (MGD)2–Fe2+ complex could also react directly with NOM, in a manner similar to GSNO, transferring directly the NO group from NOM to the iron.
Figure 3. Effect of MGD on NOM decay.
Spectrophotometric kinetics at 340 nm of 0.1 mM NOM in phosphate buffer, pH 7.5.
We checked that nitrite, the unique oxidation product of NO•, was not reduced by (MGD)2–Fe2+ in a similar time and did not interfere with the evaluation of the NO• donor under our experimental conditions, in agreement with the findings of Tsuchiya et al. [15]. Under our experimental conditions, EPR allowed us to detect NOM and GSNO, but not nitrite obtained by oxidation of NO•. This method was then applied to detect NOM and GSNO in the liver and brain of mice, to which NOM or GSNO was administered intraperitoneally.
Ex vivo EPR measurements with (MGD)2–Fe2+ complex
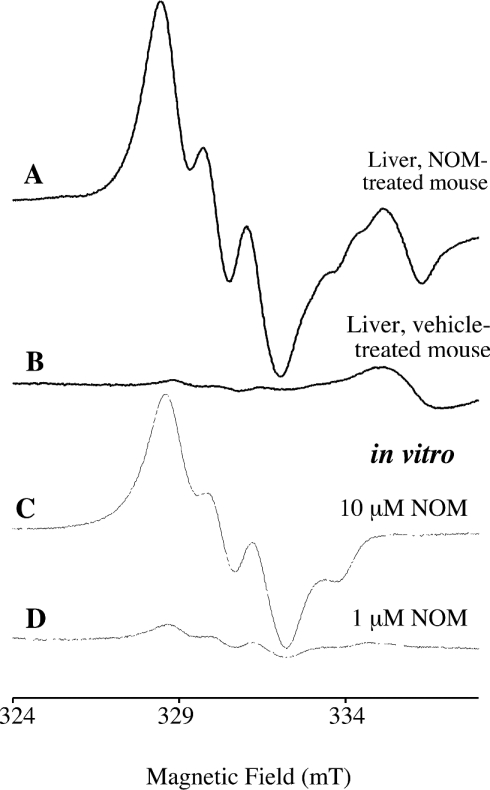
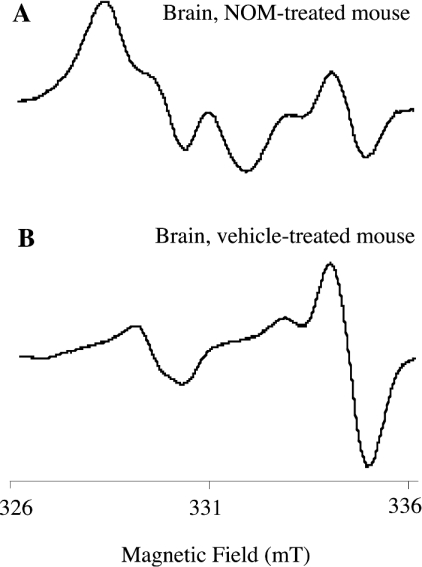
The appearance of EPR spectra in brain or liver homogenates was dependent on the addition of the (MGD)2–Fe2+ complex. The characteristic triplet signals of (MGD)2–Fe2+–NO were obtained in liver and brain of mice treated with 2.5 or 5 μmol of NOM (Figures 4 and 5). The liver isolated from NOM-treated mice exhibited an intense and well-resolved triplet signal attributable to (MGD)2–Fe2+–NO, in addition to an unknown peak around 335 mT, independent of NOM (spectra A and B in Figure 4). In brain, the characteristic spectrum superimposed a complicated background (spectrum A in Figure 5), well expressed without any NO-donor treatment (spectra B in Figure 5 and D in Figure 6). Such a spectrum of the paramagnetic complex (MGD)2–Cu2+ was attributable to the trapping of the endogenous copper ions by excess dithiocarbamate, as shown previously by Kleschyov et al. [16] in rabbit aortic strips with diethyl dithiocarbamate. The Cu2+ signal prevented assessment of the contribution of (MGD)2–Fe2+–NO to the spectrum at baseline.
Figure 4. Typical spectra of livers isolated from NOM- and vehicle-treated mice.
The upper spectra were obtained with livers isolated after i.p. injections of NOM (A) or vehicle (B). The liver was homogenized with a fresh (MGD)2–Fe2+ complex, and was frozen 30 min later. The thin spectra (C and D) were recorded with mixtures of (MGD)2–Fe2+ and NOM (1 or 10 μM), diluted twice in 0.1 M phosphate buffer, pH 7.5, as for tissue extracts. Samples were frozen in 5-mm quartz tubes in liquid nitrogen, and spectra were recorded on a Magnettech EPR spectrometer. Instrument settings are indicated in the Materials and methods section.
Figure 5. Typical EPR spectra of brains from NOM- and vehicle-treated mice.
The upper spectra were obtained with brain isolated after i.p. injections of NOM (A) and vehicle (B) followed by perfusion. The brain was homogenized with a fresh (MGD)2–Fe2+ complex, and was frozen 30 min later. Spectra were recorded at 77 K on a Magnettech EPR spectrometer. Instrument settings are indicated in the Materials and methods section.
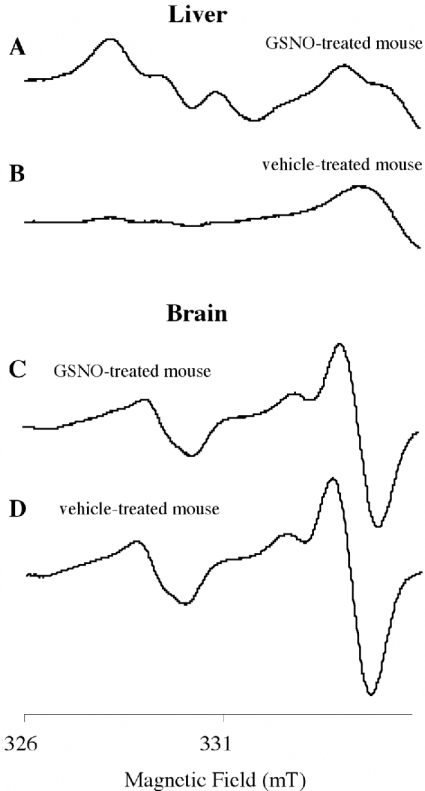
Figure 6. Typical spectra obtained with brain and liver from GSNO- and vehicle-treated mice.
The upper spectra were obtained with liver (A and B) and brain (C and D) isolated after i.p. injections of GSNO (A and C) or vehicle (B and D) followed by perfusion. The liver and the brain were homogenized with a fresh (MGD)2–Fe2+ complex solution. Samples were frozen in 5-mm quartz tubes in liquid nitrogen, and spectra were recorded at 77 K on a Magnettech EPR spectrometer. Instrument settings are indicated in the Materials and methods section.
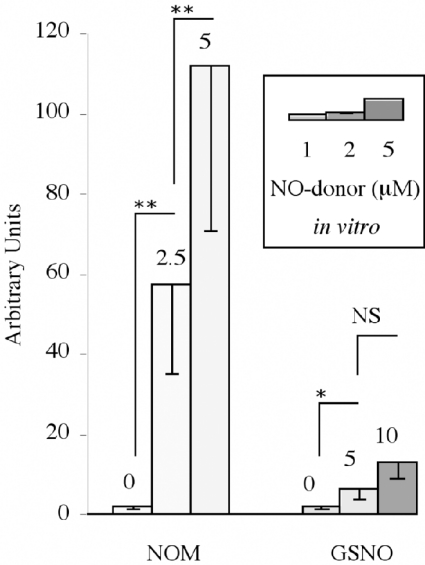
In the case of GSNO, injected at higher doses (5 and 10 μmol) than NOM, the characteristic triplet of (MGD)2–Fe2+–NO appeared clearly in the liver (spectrum A in Figure 6), but not in the brain (spectrum C in Figure 6) of treated mice. The heights of spectra in liver were susceptible to high inter-individual variations, but increased significantly with the dose (Figure 7). A comparison with samples containing known concentrations of NO• donor in 0.1 M phosphate buffer, pH 7.5 (thin spectra in Figure 4), allowed us to evaluate their concentrations. When 5 μmol of NOM or GSNO were injected, a comparison with the height of the spectra showed that 10-fold more nitrosylated iron complex is detected in the liver from NOM-treated mice than from GSNO-treated ones. An evaluation by comparison with the spectra obtained with known concentrations of NOM or GSNO in solution indicates that only a few percent of nitrosated compounds administered intraperitoneally are able to reach the liver, where nitrosated compounds are found to be more concentrated. This is near to the 6% yield of [3H]NOM estimated in the first 10 min in the liver by a very different procedure. Considering the pharmacokinetics, during anaesthesia, perfusion of the mouse and homogenization of the isolated organ, a fraction of NOM should be lost or metabolized. However, in the liver of animals which did not receive any NO• donor, a near micromolar level of (MGD)2–Fe2+–NO complex was detected and could be attributed to a pool of basal nitrosated derivatives.
Figure 7. Intensities of the EPR signals obtained with livers isolated from NOM- or GSNO-treated mice and with NOM or GSNO phosphate buffer solutions.
Columns correspond to the peak-to-peak heights of the two first lines of the EPR signal indicated in arbitrary units (means±S.D. out of at least three experiments). Mice were anaesthetized 7 min after i.p. injections of 0, 2.5 or 5 μmol of NOM, and 5 or 10 μmol of GSNO and then perfused. Livers were homogenized in a fresh (MGD)2–Fe2+ solution. EPR measurements were made at 77 K. The inset shows in vitro experiments performed with mixtures of 10 mM (MGD)2–Fe2+ complex and 1, 2, and 5 μM NOM or GSNO solution, diluted twice in phosphate buffer. Statistical significance (using Student's t test): **P<0.001; *P<0.05; NS, non-significant.
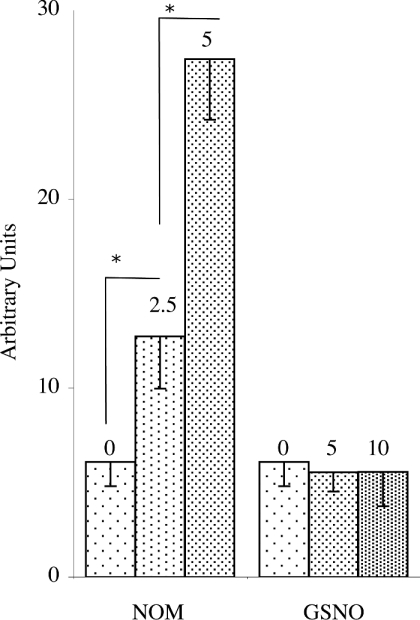
In brain, when 2.5 and 5 μmol of NOM was administered, even though the first two lines of the spectrum were not as well resolved as in the liver, the signal (spectrum A in Figure 5) was recognized and increased in a dose-dependent manner with NOM. In the brain of GSNO-treated mice, the (MGD)2–Fe2+–NO spectra were superimposed on those of animals treated only with the vehicle (spectra C and D in Figure 6, and Figure 8), demonstrating that GSNO is unlikely to be able to cross the blood–brain barrier.
Figure 8. Intensities of the EPR signals obtained with brains isolated from NOM- or GSNO-treated mice.
The series of columns correspond to ex vivo experiments. Mice were anaesthetized 7 min after i.p. injections of vehicle, 2.5 or 5 μmol of NOM, and 5 or 10 μmol of GSNO, and then perfused. Brains were homogenized in a fresh (MGD)2–Fe2+ solution. EPR measurements were made at 77 K. When vehicle and GSNO were administered, the two first lines of the (MGD)2–Fe2+–NO spectra were overlapped by a (MGD)2–Cu2+ signal. When NOM was administered, the increase in the peak-to-peak height of the two first lines of the EPR spectra, expressed in arbitrary units (means±S.D. from at least three experiments), was attributed to (MGD)2–Fe2+–NO. Statistical significance (using Student's t test): * P<0.05.
Conclusion
We have previously shown that NOM decomposes to NO• and melatonin in buffered solutions under physiological conditions [4]. Since the detection of NO• in animals or in organs is a challenging methodological problem [9], one of the most reliable approaches to the measurement of biological NO• is EPR using specific spin-trapping agents to form stable paramagnetic NO• adducts [10,16,17]. Despite their toxicity, various attempts were performed in vivo with the iron–dithiocarbamate complexes [16]. Generally, successive injections of iron salts, dithiocarbamate and treatments were given and attempts at quantification were quite unreliable. In order to circumvent the distribution of the spin-trapping agent in the animal, particularly in the brain, addition of the soluble (MGD)2–Fe2+ complex was performed ex vivo and fitted for assays with tissue homogenates.
While melatonin is known to spread throughout the body, only a low amount of NOM injected into mice is able to cross the blood–brain barrier. It is noteworthy that GSNO is unlikely to be able to. In the case of NOM, we observed an accumulation in the peritoneal membranes, suggesting that administration techniques (solubilization in Tween 80 and i.p. injection) are not fully satisfactory. The development of new modes of treatment may be critical in improving pharmacokinetics and for pharmacological use.
In the liver of untreated mice, we observed a characteristic background with (MGD)2–Fe2+–NO which could be attributed to nitroso compounds (S-nitroso- and N-nitroso-derivatives) present in the organ homogenates. EPR allowed us to detect near-micromolar concentrations of endogenous NO• pools in liver. The physiological NO• concentration relevant to NO• signalling remains at a steady-state nanomolar level (<10 nM) [18], which is undetectable by EPR. However, micromolar amounts are the detection limit of the method. Thus EPR detection is particularly useful when NO• pool levels increase in pathological situations or in cases where NO•-donors are administered.
In living organisms, NO• storage comprises nitrosyl iron complexes, nitrosothiols like GSNO and aromatic nitrosoamines. NOM is a derivative of N-nitrosotryptophan, which has a similar structure. Whereas the formation and decomposition of S-nitroso compounds are largely documented [14,19], the ability of peptides and proteins to be nitrosated on their tryptophan residues is not well understood. Nevertheless, we suggest that N-nitrosotryptophan-containing peptides and proteins may constitute the pool of N-nitroso compounds, which have recently been evidenced by Feelisch and co-workers using a gas-phase chemiluminescence technique [1,20].
Acknowledgments
We thank Professor J.-Y. Lallemand, in whose laboratory of the Centre National de Recherche Scientifique this work was performed. We are grateful to the Ministère de la Technologie et de la Recherche for funding F. P.
References
- 1.Feelisch M., Rassaf T., Mnaimneh S., Singh N., Bryan N. S., Jourd'heuil D., Kelm M. Concomitant S-, N-, and heme-nitros(yl)ation in biological tissues and fluids: implications for the fate of NO in vivo. FASEB J. 2002;16:1775–1785. doi: 10.1096/fj.02-0363com. [DOI] [PubMed] [Google Scholar]
- 2.Blanchard B., Pompon D., Ducrocq C. Nitrosation of melatonin by nitric oxide and peroxynitrite. J. Pineal Res. 2000;29:184–192. doi: 10.1034/j.1600-079x.2000.290308.x. [DOI] [PubMed] [Google Scholar]
- 3.Peyrot F., Martin M.-T., Migault J., Ducrocq C. Reactivity of peroxynitrite with melatonin as a function of pH and CO2 content. Eur. J. Org. Chem. 2003;2003:172–181. [Google Scholar]
- 4.Blanchard-Fillion B., Servy C., Ducrocq C. 1-Nitrosomelatonin is a spontaneous NO-releasing compound. Free Radical Res. 2001;35:857–866. doi: 10.1080/10715760100301351. [DOI] [PubMed] [Google Scholar]
- 5.Matsubara E., Bryant-Thomas T., Quinto J. P., Henry T. L., Poeggeler B., Herbert D., Cruz-Sanchez F., Chyan Y.-J., Smith M. A., Perry G., et al. Melatonin increases survival and inhibits oxidative and amyloid pathology in a transgenic model of Alzheimer's disease. J. Neurochem. 2003;85:1101–1108. doi: 10.1046/j.1471-4159.2003.01654.x. [DOI] [PubMed] [Google Scholar]
- 6.Emerit J., Edeas A., Bricaire F. Neurodegenerative diseases and oxidative stress. Biomed. Pharmacother. 2004;58:39–46. doi: 10.1016/j.biopha.2003.11.004. [DOI] [PubMed] [Google Scholar]
- 7.Venturini G., Colasanti M., Persichini T., Fioravanti E., Ascenzi P., Palomba O., Musci G. β-Amyloid inhibits NOS activity by subtracting NADPH availability. FASEB J. 2002;16:1970–1972. doi: 10.1096/fj.02-0186fje. [DOI] [PubMed] [Google Scholar]
- 8.Aliyev A., Seyidova D., Rzayev N., Obrenovich M. E., Lamb B. T., Chen S. G., Smith M. A., Perry G., de la Torre J. C., Aliev G. Is nitric oxide a key target in the pathogenesis of brain lesions during the development of Alzheimer's disease? Neurol. Res. 2004;26:547–553. doi: 10.1179/01610425017613. [DOI] [PubMed] [Google Scholar]
- 9.Katayama Y., Soh N., Maeda M. Strategies and development of molecular probes for nitrogen monoxide monitoring. Bull. Chem. Soc. Jpn. 2002;75:1681–1691. [Google Scholar]
- 10.Henry Y., Guissani A., Ducastel B. Landes Bioscience. Austin, TX: 1997. Nitric Oxide Research from Chemistry to Biology: EPR Spectroscopy of Nitrosylated Compounds. [Google Scholar]
- 11.Shinobu L. A., Jones S. G., Jones M. M. Sodium N-methyl-D-glucamine dithiocarbamate and cadmium intoxication. Acta Pharmacol. Toxicol. 1984;54:189–194. doi: 10.1111/j.1600-0773.1984.tb01916.x. [DOI] [PubMed] [Google Scholar]
- 12.Bravo C., Herves P., Leis J. R., Pena M. E. Kinetic study of the nitrosation of 3-substituted indoles. J. Chem. Soc. Perkin Trans. 1992;2:185–189. [Google Scholar]
- 13.Menendez-Pelaez A., Reiter R. J. Distribution of melatonin in mammalian tissues: the relative importance of nuclear versus cytosolic localization. J. Pineal Res. 1993;15:59–69. doi: 10.1111/j.1600-079x.1993.tb00511.x. [DOI] [PubMed] [Google Scholar]
- 14.Hogg N. Biological chemistry and clinical potential of S-nitrosothiol. Free Radical Biol. Med. 2000;28:1478–1486. doi: 10.1016/s0891-5849(00)00248-3. [DOI] [PubMed] [Google Scholar]
- 15.Tsuchiya K., Kirima K., Yoshizumi M., Houchi H., Tamaki T., Mason R. P. The role of thiol and nitrosothiol compounds in the nitric oxide-forming reactions of the iron–N-methyl-D-glucamine dithiocarbamate complex. Biochem. J. 2002;367:771–779. doi: 10.1042/BJ20020310. [DOI] [PMC free article] [PubMed] [Google Scholar]
- 16.Kleschyov A. L., Mollnau H., Oelze M., Meinertz T., Huang Y., Harrison D. G., Munzel T. Spin trapping of vascular nitric oxide using colloid Fe(II)-diethyldithiocarbamate. Biochem. Biophys. Res. Commun. 2000;275:672–677. doi: 10.1006/bbrc.2000.3361. [DOI] [PubMed] [Google Scholar]
- 17.Lecour S., Maupoil V., Siri O., Tabard A., Rochette L. Electron spin resonance detection of nitric oxide generation in major organs from LPS-treated rats. J. Cardiovasc. Pharmacol. 1999;33:78–85. doi: 10.1097/00005344-199901000-00012. [DOI] [PubMed] [Google Scholar]
- 18.Keynes R. G., Griffiths C., Garthwaite J. Superoxide-dependent consumption of NO in biological media may confound in vitro experiments. Biochem. J. 2003;369:399–406. doi: 10.1042/BJ20020933. [DOI] [PMC free article] [PubMed] [Google Scholar]
- 19.Noble D. R., Williams D. L. H. Formation and reactions of S-nitrosoproteins. J. Chem. Soc., Perkin Trans. 2001;2:13–17. [Google Scholar]
- 20.Bryan N. S., Rassaf T., Maloney R. E., Rodriguez C. M., Saijo F., Rodriguez J. R., Feelisch M. Cellular targets and mechanisms of nitros(yl)ation: an insight into their nature and kinetics in vivo. Proc. Natl. Acad. Sci. U.S.A. 2004;101:4308–4313. doi: 10.1073/pnas.0306706101. [DOI] [PMC free article] [PubMed] [Google Scholar]


