Abstract
Jurkat cells in culture were exposed to oxidative stress in the form of continuously generated hydrogen peroxide, obtained by the addition of glucose oxidase to the medium. This treatment induced a rapid, dose-dependent increase in the ICIP (intracellular calcein-chelatable iron pool). Early destabilization of lysosomal membranes and subsequent nuclear DNA strand breaks were also observed, as evaluated by the Acridine Orange relocation test and the comet assay respectively. Somewhat later, these effects were followed by a lowered mitochondrial membrane potential, with release of cytochrome c and apoptosis-inducing factor. These events were all prevented if cells were pretreated with the potent iron chelator DFO (desferrioxamine) for a period of time (2–3 h) long enough to allow the drug to reach the lysosomal compartment following fluid-phase endocytosis. The hydrophilic calcein, a cleavage product of calcein acetoxymethyl ester following the action of cytosolic esterases, obviously does not penetrate intact lysosomal membranes, thus explaining why ICIP increased dramatically following lysosomal rupture. The rapid decrease in ICIP after addition of DFO to the medium suggests draining of cytosolic iron to the medium, rather than penetration of DFO through the plasma membrane. Most importantly, these observations directly connect oxidative stress and resultant DNA damage with lysosomal rupture and the release of redox-active iron into the cytosol and, apparently, the nucleus.
Keywords: apoptosis, desferrioxamine, DNA damage, lysosome, oxidative stress, redox-active iron
Abbreviations: AIF, apoptosis-inducing factor; AM, acetoxymethyl ester; AO, Acridine Orange; DFO, desferrioxamine; GO, glucose oxidase; ICIP, intracellular calcein-chelatable iron pool; SIH, salicylaldehyde isonicotinoyl hydrazone
INTRODUCTION
Iron, being an essential metal, is intimately related to life and is found in the catalytic sites of numerous vital proteins. However, iron in a redox-active form also represents a potentially dangerous electron-transporting catalytic system that is able to induce oxidative damage, for example through the initiation of Fenton-type reactions [1–3]. Thus it is not surprising that Nature handles iron with the utmost care; usually the metal is prevented from reacting with peroxides by being hidden inside proteins or in other ways complex-bound and prevented from participating in electron transfer reactions. An exception to this rule is when iron is released inside late endosomes (following receptor-mediated uptake of Fe–transferrin) or lysosomes (following degradation of autophagocytosed Fe-containing macromolecules), or is under transport from these compartments to sites where it is incorporated into essential biomolecules or being stored in ferritin. The existence in cells of redox-active low-mass iron was proposed several decades ago, although conclusive evidence has only become available quite recently, when the examination of the so-called labile iron pool in intact cells became possible by using iron-binding fluorochromes in combination with strong iron chelators [4–6]. In this regard, the calcein-chelatable iron pool is generally regarded as being identical to intracellular redox-active iron, although this notion has not been unequivocally documented.
Under conditions of cellular oxidative stress, mainly characterized by increased levels of hydrogen peroxide (H2O2), accessible ferrous iron would be a severe threat. As described above, the places where redox-active iron may be present in considerable amounts are the late endosomes and lysosomes rather than the cytosol. In these compartments, acidic conditions in combination with the prevailing reducing environment ensure that iron would be at least partially in the ferrous form [7,8]. Consequently, these compartments may constitute especially vulnerable structures that may burst due to oxidative processes and release a host of lytic enzymes under conditions of oxidative stress [9–11]. It is plausible to assume that membrane destabilization of these organelles would also result in relocation of iron and other low-molecular-mass inorganic ions and molecules to the cytosol, possibly prior to the release of hydrolytic enzymes. Such an event, in combination with the continuous presence of H2O2, may result in oxidative damage of cell constituents, including nuclear DNA [12–16].
DNA damage following oxidative stress is usually thought to be a function of site-specific DNA-associated Fenton chemistry, and it is commonly assumed that iron is normally associated with nuclear DNA [17,18]. However, the possibility exists that the basis for oxidative DNA damage, as well as other effects on cells exposed to H2O2, is linked to the relocation of redox-active iron from compartments elsewhere in the cell.
In earlier papers, we and others have shown that DFO (desferrioxamine), a membrane-impermeant, strong and rather specific iron chelator, is taken up by cells by fluid-phase endocytosis, thus passing late endosomes before reaching the lysosomal compartment [1,14,15,19,20]. Based on this knowledge, the relationship between DFO- and calcein-chelatable iron was investigated in the present work. Moreover, the role of iron compartmentalization in relation to the molecular mechanisms behind H2O2-induced DNA damage and apoptosis was also assessed.
MATERIALS AND METHODS
Materials
Growth medium (RPMI 1640), L-glutamine, Triton X-100, pepstatin A, leupeptin, Hoechst 33342 and GO (glucose oxidase; from Aspergillus niger; 18000 units/g) were from Sigma Chemical Co. (St. Louis, MO, U.S.A.). DFO mesylate was from Novartis (Basel, Switzerland). Fetal bovine serum, Nunc tissue culture plastics, low-melting-point agarose, PMSF, Hepes and penicillin/streptomycin were obtained from Gibco BRL (Grand Island, NY, U.S.A.). Normal-melting-point agarose was from Serva G.m.b.H. (Heidelberg, Germany). Microscope superfrosted glass slides were supplied by Menzel-Glaset, while calcein-AM (acetoxymethyl ester) and JC-1 were from Molecular Probes (Eugene, OR, U.S.A.). H2O2 was from Merck (Darmstadt, Germany), while AO (Acridine Orange) was from Fluka (Buchs, Switzerland). Aprotinin was purchased from Roche Diagnostics (Mannheim, Germany). The specific iron chelator SIH (salicylaldehyde isonicotinoyl hydrazone) was a gift from Professor Prem Ponka (McGill University, Montreal, Canada). Anti-(cytochrome c) antibody was from Pharmingen (San Diego, CA, U.S.A.). Polyclonal antibody against AIF (apoptosis-inducing factor) and horseradish peroxidase-conjugated secondary antibodies were from Santa Cruz Biotechnology (Santa Cruz, CA, U.S.A.). ECL® reagent was from Amersham Biosciences (U.K.).
Cell culture conditions and exposure to H2O2
Jurkat cells (A.T.C.C.; clone E6-1) were grown in RPMI-based medium containing 10% (v/v) heat-inactivated fetal bovine serum, 2 mM glutamine, 100 units/ml penicillin and 100 ng/ml streptomycin, at 37°C in air with 5% CO2. Cells in exponential phase were harvested by centrifugation at 700 g for 5 min, resuspended at a density of 1.5×10⁶ cells per ml and allowed to stand for 1 h under standard culture conditions. Subsequently, cells were exposed to 1 mM DFO for various periods of time under otherwise standard culture conditions, and then exposed for 10–300 min to continuously generated H2O2 formed by the action of appropriate added amounts of GO on medium glucose. The concentration of the enzyme used was 0.01–0.6 μg/ml, which was able to generate approx. 0.2–12 nmol of H2O2/min per ml. Cells were then collected and checked for viability (Trypan Blue dye exclusion) before further assays. In order to assess whether some GO products other than H2O2 (i.e. D-glucono-δ-lactone) produced during the reaction affected the results, cells were sometimes incubated simultaneously with GO and catalase in combination. No significantly different results from controls were observed under such conditions (results not shown).
Single-cell gel electrophoresis (comet assay)
The comet assay was performed essentially as described previously [21–23]. Cells were suspended in 1% (w/v) low-melting-point agarose in PBS, pH 7.4, and pipetted on to superfrosted glass microscope slides, precoated with a layer of 1% (w/v) normalmelting-point agarose (warmed to 37°C prior to use). The agarose was allowed to set at 4 °C for 10 min, and the slides were then immersed for 1 h at 4 °C in a lysis solution (2.5 M NaCl, 100 mM EDTA, 10 mM Tris, pH 10, 1% Triton X-100) in order to dissolve cellular proteins and lipids. Slides were placed in single rows in a 30 cm-wide horizontal electrophoresis tank containing 0.3 M NaOH and 1 mM EDTA, pH∼13 (unwinding solution) and kept at 4 °C for 40 min in order to allow DNA strand separation (alkaline unwinding). Electrophoresis was performed for 30 min in the unwinding solution at 30 V (1 V/cm) and 300 mA. Finally, the slides were washed for 3×5 min in 0.4 M Tris (pH 7.5; 4 °C) and stained with Hoechst 33342 (10 mg/ml). No double strand breaks were observed when the neutral comet assay was used, indicating that the DNA breaks were mainly of the single-strand type.
Image analysis and scoring
Hoechst-stained nucleoids were examined under a UV-microscope with a 490 nm excitation filter at a magnification of ×400. DNA damage was not homogeneous, and visual scoring was based on the characterization of 100 randomly selected nucleoids. The comet-like DNA formations were categorized into five classes (0, 1, 2, 3 and 4) representing an increasing extent of DNA damage visualized as a ‘tail’. Each comet was assigned a value according to its class. Accordingly, the overall score for 100 comets ranged from 0 (100% of comets in class 0) to 400 (100% of comets in class 4). In this way the overall DNA damage of the cell population can be expressed in arbitrary units [23]. Scoring expressed in this way correlated almost linearly with other parameters, such as percentage of DNA in the tail estimated after computer image analysis using a specific software package (Comet Imager; MetaSystems) (results not shown). The same linear correlation between visual scoring and computer image analysis has also been reported from other laboratories [24,25]. Visual observations and analyses of the results were always carried out ‘blind’ by the same experienced person, using a specific pattern when moving along the slide. The results were checked by a second person and also compared with those from a computer-based analysis program. The results obtained were all essentially the same.
Measurement of ICIP (intracellular calcein-chelatable iron pool)
The ICIP was assayed basically as described by Epsztejn et al. [4]. Briefly, after the indicated treatments, cells were washed and incubated with 0.15 μM calcein-AM for 10 min at 37 °C in PBS containing 1 mg/ml BSA and 20 mM Hepes, pH 7.3. After calcein loading, cells were washed, resuspended in 2.2 ml of the same buffer without calcein-AM, and placed in a stirred, thermostatted (37 °C) fluorescence spectrophotometer (F-2500; Hitachi) cuvette. Fluorescence was monitored (excitation 488 nm; emission 517 nm). Calcein-loaded cells show a fluorescence component (ΔF) that is quenched by intracellular iron. The quenching is minimized by the addition of 11 μM SIH, a highly specific and membrane-permeant iron chelator. Cell viability (assayed as Trypan Blue exclusion) was >95%, and was unchanged during the assay.
Estimation of lysosomal stability (AO relocation method)
Lysosomal stability was assessed as described previously [10,15]. Briefly, Jurkat cells (1.5×10⁶ cells/ml) were exposed to 1 mM DFO for 2 h before being loaded with 0.1 μg/ml AO for 15 min. Cells were then rinsed and subsequently exposed for 60 min to continuously generated H2O2 by the addition of GO (0.1 μg/ml), before being analysed for green fluorescence on a FACscan Becton Dickinson (Mountain View, CA, U.S.A.) flow cytometer. AO is a metachromatic lysosomotropic fluorophore that gives rise to red fluorescence at high concentrations and green fluorescence at low concentrations. Increased green fluorescence indicates lysosomal leakage of AO.
Analysis of mitochondrial membrane potential
Jurkat cells were incubated with 1 mM DFO for 2 h before exposure for 5 h to continuously generated H2O2 (as described above). Cells were then resuspended into PBS containing JC-1 (0.1 μg/ml). After 15 min, 5000 cells/sample were analysed for red and green fluorescence (mitochondria with normal potential show red fluorescence, while abnormally low potential results in green fluorescence) by flow cytometry as described [26].
Isolation of subcellular fractions
The isolation of a cytosolic (S-100) fraction was performed as described previously [27]. Briefly, 20×106 cells were resuspended in 0.5 ml of a buffer containing 20 mM Hepes, pH 7.4, 1.5 mM MgCl2, 10 mM KCl, 1 mM EGTA, 5 mM dithiothreitol, 250 mM sucrose and a mixture of protease inhibitors (1 mM PMSF, and 1 μg/ml aprotinin, pepstatin and leupeptin). Cells were then disrupted by homogenization in a cell cracker (EMBL, Heidelberg, Germany). The homogenate was centrifuged at 700 g for 6 min at 4 °C, and the resulting supernatant was centrifuged further at 100000 g to obtain the S-100 fraction.
Cell nuclei were isolated as described previously [28]. Briefly, Jurkat cells were resuspended in TITE buffer (100 mM NaCl, 20 mM Tris/HCl, pH 7.4, 2 mM EDTA, 0.02% Triton X-100) at 107 cells/ml and left for 5 min on ice. The resulting nuclear and cytoplasmic suspension was layered on to 0.54 ml of 10% (w/v) sucrose in TITE buffer and centrifuged for 5 min at 200 g. Finally, the supernatant was removed without disturbing the nuclear pellet.
Western blotting
Levels of cytochrome c and AIF were detected by Western blot analysis. For immunoblotting analysis, 50 μg samples were fractionated by electrophoresis on a 15% (for cytochrome c) or 12% (for AIF) (w/v) polyacrylamide gel in the presence of SDS, and proteins were transferred to nitrocellulose membranes by electroblotting. After blocking with 5% (w/v) dry non-fat milk, membranes were incubated with purified anti-(cytochrome c) or polyclonal anti-AIF antibodies, followed by horseradish peroxidase-conjugated secondary antibodies. Membranes were developed using the ECL® reagent.
Measurement of H2O2 generation
Amounts of H2O2 generated by GO added to PBS containing 5.0 mM glucose (in the absence of cells) was estimated either by increased absorbance at 240 nm (molar absorption coefficient 43.6 M−1·cm−1) or by polarographical detection of liberated O2 with an oxygen electrode (Hansatech Instruments, King's Lynn, Norfolk, U.K.) after addition of catalase in excess.
Statistical analysis
Differences between groups were determined by Student's paired t test.
RESULTS
Exposure of cells to H2O2 increases ICIP
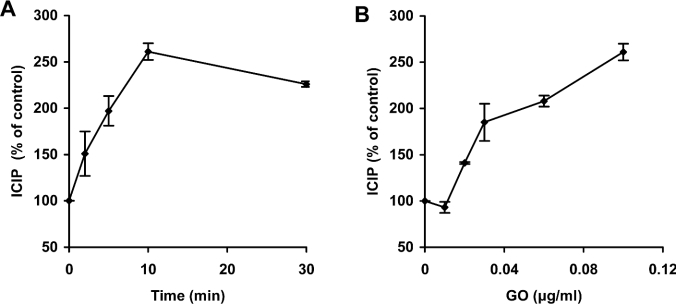
It is well known that many cellular structures, such as nuclear and mitochondrial DNA, are sensitive to oxidative stress and easily damaged by exposure to H2O2 [12–16,23,29,30]. This effect is attenuated when intracellular iron is chelated by specific iron-binding compounds, indicating a critical role of redox-active iron in these processes [13–18]. In the present investigation, changes in levels of ICIP in Jurkat cells during oxidative stress were estimated by loading cells with the fluorescent compound calcein, as described previously by Epsztejn et al. [4]. By using this methodology, available iron in resting Jurkat cells was estimated to be 2.19±0.03 μM. Exposure of cells to continuously generated H2O2, obtained by addition of GO to the growth medium (0.1 μg of GO per ml, able to generate approx. 2 nmol of H2O2/min per ml), led to a rapid increase in ICIP (261±9% within 10 min) (Figure 1A). This effect was GO concentration-dependent and, thus, related to the magnitude of oxidative stress. Figure 1(B) shows the effects of GO added in amounts between 0.01 and 0.1 μg/ml, which produce between 0.2 and 2.0 nmol of H2O2/min per ml. An important question arising as a result of the above experiments concerns the origin of the increased ICIP. Potential sources include: (a) extracellular iron, (b) ferritin-sequestered iron, and (c) iron from intracellular compartments that are not initially accessible to cytosolic calcein.
Figure 1. ICIP increases following exposure to H2O2.
Jurkat cells (1.5×10⁶ cells/ml) in ordinary medium were exposed to 0.1 μg/ml GO, which generates approx. 2 nmol of H2O2/min per ml, for the indicated periods of time (A), or to increasing concentrations of GO for 10 min (B). Subsequently, cells were exposed to 0.15 μM calcein-AM (and thereby loaded with calcein) for 10 min and then rinsed in PBS containing 20 mM Hepes and 1 mg/ml BSA. The intracellular calcein-induced fluorescence was then assayed (excitation 488 nm; emission 517 nm) in a fluorescence spectrophotometer (F-2500; Hitachi). ICIP was calculated by the increase in fluorescence following addition of the membrane-permeant strong iron chelator SIH, as described in the Materials and methods section. The ICIP value for Jurkat cells was estimated to be 2.19±0.03 μM (100%). Values represent means±S.D. of triplicate measurements.
Exposure of cells to DFO decreases ICIP
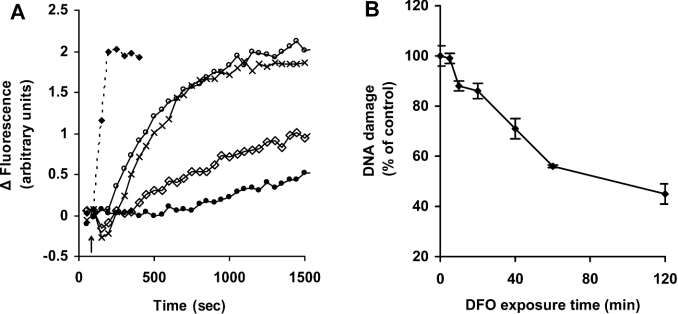
In order to address the origin of the increased ICIP, we investigated the effects of the well known iron chelator DFO on ICIP. We, and others, have reported previously that DFO is taken up by cells through fluid-phase endocytosis, passes through late endosomes and is concentrated in the lysosomal compartment, seemingly without reaching the cytosol [1,14,15,19,20]. As shown in Figure 2(A), calcein-mediated fluorescence increased rapidly after addition of SIH (a membrane-permeant strong and specific iron chelator), indicating loss of low-mass iron from calcein–Fe complexes. When cells were exposed to DFO rather than to SIH, calcein-bound iron was again abstracted, indicated by the increase in calcein-mediated fluorescence. The rate, however, was much lower than when cells were exposed to SIH. The DFO effect was concentration-dependent, with the rate of iron removal from calcein increasing between 10 μM and 1 mM DFO. At DFO concentrations higher than 1 mM the process was saturated and no additional increase in the rate of iron abstraction was observed.
Figure 2. Exposure to DFO decreases ICIP and protects against H2O2-induced DNA damage.
(A) Jurkat cells (1.5×10⁶ cells/ml) were loaded with calcein, and cell fluorescence (excitation 488 nm; emission 517 nm) was monitored as described for Figure 1. At the indicated time (arrow), 11 μM SIH (◆) or increasing concentrations of DFO [0.01 mM (●), 0.1 mM (◇), 1 mM (○) or 3 mM (×)] were added directly into the cuvette, and the increase in fluorescence, indicating removal of iron from calcein, was assayed. (B) Jurkat cells (1.5×10⁶ cells/ml) were exposed to 1 mM DFO for the indicated periods of time before addition of 0.6 μg/ml GO (generating approx. 12 nmol of H2O2/min per ml) for an exposure period of 10 min. Cells were finally analysed for formation of DNA single-strand breaks by the comet assay as described in the Materials and methods section. Values represent means±S.D. of triplicate measurements.
Under saturating conditions (1 mM DFO), all calcein-bound iron was abstracted in approx. 15–20 min. However, the protection offered by DFO against H2O2-induced DNA damage increased progressively during a 2 h period of incubation (Figure 2B), suggesting that significant cellular iron pool(s) that are not accessible to calcein, but are reached slowly by DFO, may play an important role in H2O2-induced DNA damage. Based on previous results [2,14,15], lysosomes are the main candidate for such a compartment.
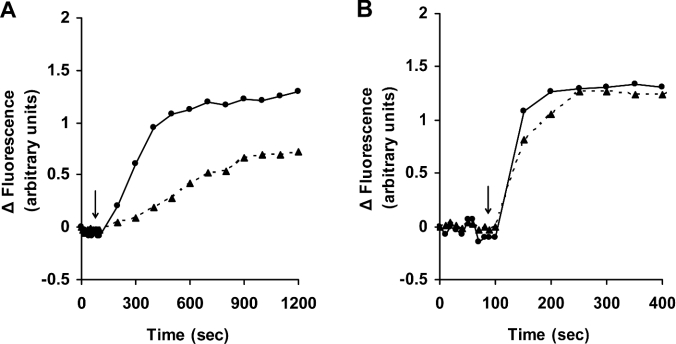
An additional observation, pointing to the possibility that DFO chelates cellular iron following endocytotic uptake into endosomes and lysosomes, was that the effect of DFO, in contrast with that of SIH, was strongly temperature dependent (Figures 3A and 3B). As noted previously [1,30], low temperature prevents endocytosis of DFO and restricts its passage into endosomes/lysosomes, but would not hinder non-specific passage of low-mass iron through plasma membranes and binding to extracellular DFO.
Figure 3. Iron chelation by DFO is temperature-dependent.
Jurkat cells (1.5×10⁶ cells/ml) were loaded with calcein as described for Figure 1. Cells were then collected, washed, resuspended in PBS containing 20 mM Hepes and 1 mg/ml BSA, and transferred to cuvettes maintained at either 37 °C (●) or 4 °C (▲), and fluorescence (excitation 488 nm; emission 517 nm) was monitored. At the time points indicated by the arrows, 1 mM DFO (A) or 11 μM SIH (B) was added directly into the cuvette, and the increase in fluorescence, indicating relocation of iron from calcein, was assayed. Two similar experiments gave essentially the same results.
Replacement of calcein-chelatable iron following exposure to DFO
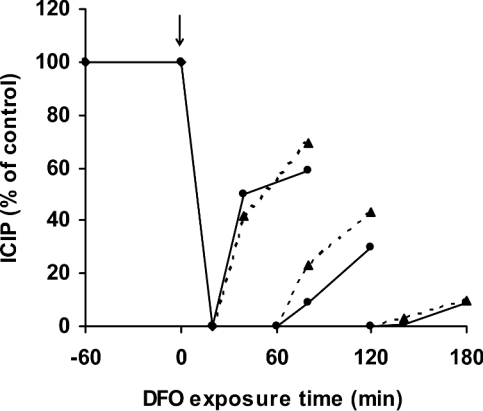
In order to analyse further the mechanisms behind DFO-induced alterations in ICIP, calcein-loaded Jurkat cells were exposed to 1 mM DFO under otherwise standard culture conditions. As described above, ICIP decreased to zero within approx. 20 min. Cells were then, after differing periods of exposure to DFO, washed in DFO-free PBS containing 20 mM Hepes and 1.0 mg/ml BSA, and ICIP levels were estimated 20 and 60 min later. It was observed (Figure 4) that ICIP increased (indicating an increased cytosolic concentration of iron) following removal of DFO from the exterior of the cells, although the rates of increase were inversely related to the duration of DFO exposure. Following a DFO exposure period of 2 h or more, iron levels increased only slightly after washing. Essentially the same results were obtained when cells were resuspended in complete culture medium after washing (Figure 4, broken lines). The results indicate that almost all iron that contributes to the replenishment of ICIP following a temporary exposure to DFO is of intracellular origin. The presence of such an intracellular pool of calcein-non-chelatable iron has been proposed previously for K562 cells [31]. Moreover, since endocytotic uptake is a comparatively slow process during which endocytosed macromolecules, such as DFO, reach the lysosomal compartment only after 1–3 h, the results point strongly to lysosomes as the origin of cytosolic iron when cells are prevented from taking up transferrin-mediated iron. An almost complete DFO saturation of the lysosomal compartment, requiring considerable fusion and fission of the vacuoles that together make up this compartment, would require at least a couple of hours, explaining why the restoration of ICIP when cells were exposed to medium without DFO was progressively diminished following prolonged periods of initial DFO exposure (Figure 4).
Figure 4. Interrupted exposure to DFO partially restores ICIP.
Jurkat cells (1.5×10⁶ cells/ml) were exposed to 1 mM DFO in complete culture medium for 20, 60 or 120 min (addition of DFO is indicated by the arrow). Cells were then centrifuged and resuspended in DFO-free complete culture medium (▲) or DFO-free PBS containing 20 mM Hepes and 1 mg/ml BSA (●). At 20 and 60 min later, cells were loaded with calcein, and ICIP was estimated as described for Figure 1.
Lysosomal destabilization following exposure to H2O2 is prevented by pretreatment with DFO
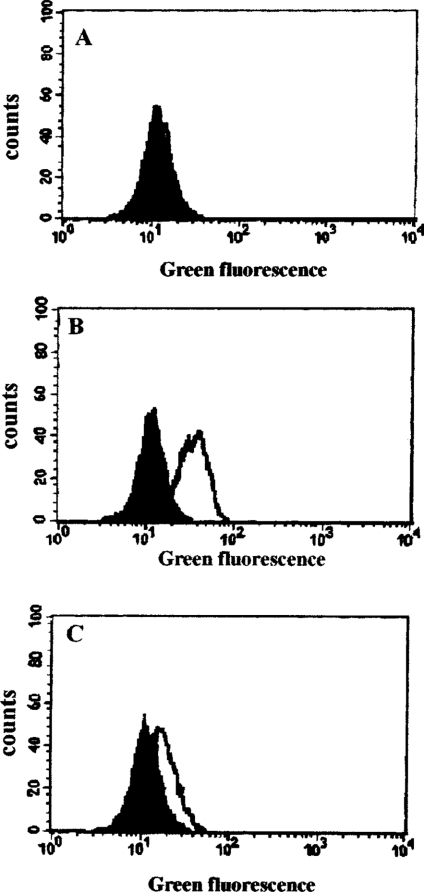
Although the localization of the DFO-chelatable iron pool has not been determined unequivocally, endosomes and lysosomes are very strong candidates [1,2,32]. Stable iron chelation in these compartments would inhibit Fenton-type reactions and probably protect these organelles from the deleterious effects of strongly reactive oxygen-centred radicals produced as an effect of oxidative stress. Indeed, pretreatment of Jurkat cells (1.5×10⁶ cells/ml) with 1 mM DFO for 2–3 h largely prevented lysosomal membrane destabilization induced by exposure to H2O2 under steady-state concentrations. The integrity of lysosomal membranes was assessed by flow cytometric analysis of the release of preloaded AO from lysosomes into the cytosol. Treatment of cells for 60 min with continuously generated H2O2 (0.1 μg of GO/ml, generating approx. 2 nmol of H2O2/min per ml) led to relocation of AO (a metachromatic fluorophore showing red and green fluorescence at high and low concentrations respectively) from lysosomes to the cytosol, as indicated by increased green cellular fluorescence (Figure 5B). The increase in green fluorescence was apparent shortly after the exposure of the cells to H2O2, and increased further over time (results not shown). Pretreatment with 1 mM DFO for 2 h before initiation of oxidative stress caused lysosomal membranes to become resistant (Figure 5C). It is obvious from these results that lysosomal iron represents an initial point of interaction when steady-state H2O2 levels in cells are increased, leading to the formation of more reactive species (hydroxyl or perferyl radicals) that mediate the destabilization of lysosomal membranes and, ultimately, the toxicity of lysosomal-rupturing oxidative stress.
Figure 5. DFO inhibits H2O2-induced lysosomal membrane destabilization.
Jurkat cells (1.5×10⁶ cells/ml) were loaded with 0.1 μg/ml AO for 15 min before being collected and analysed for green fluorescence by flow cytometry (filled histograms in A, B and C). Samples from the same suspension of cells were also treated with 1 mM DFO for 2 h (open histogram, A), or oxidatively stressed by exposure to 0.1 μg/ml GO (generating approx. 2 nmol of H2O2/min per ml) for 1 h in complete medium (open histogram, B), or treated with 1 mM DFO for 2 h before exposure to the same amount of GO for a further 1 h (open histogram, C). The increase in green fluorescence in (B) indicates lysosomal destabilization with release of AO into the cytosol. The data shown are from one of three experiments giving essentially the same results.
Released lysosomal contents mediate H2O2-induced effects on mitochondria
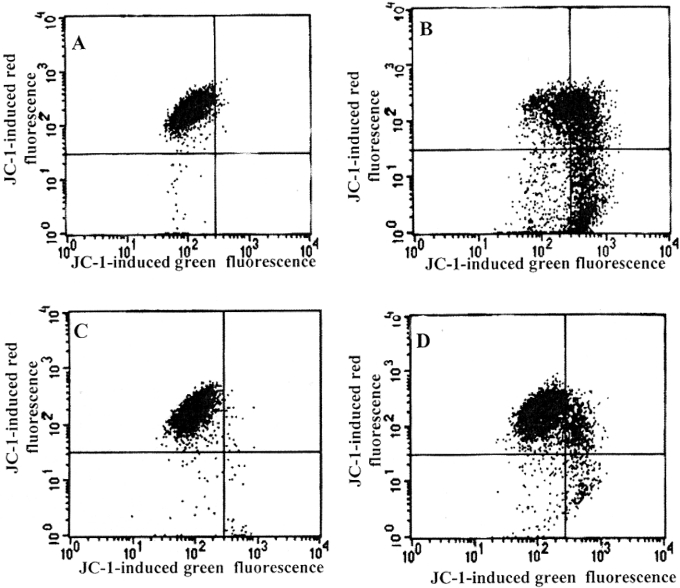
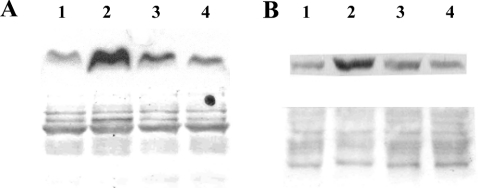
Apart from the described protection against H2O2-induced nuclear DNA damage by chelation of lysosomal iron following endocytotic uptake of DFO, such treatment also provided significant defence against H2O2-induced mitochondrial damage. As shown in Figures 6 and 7, pretreatment with 1 mM DFO protected Jurkat cells from H2O2-induced loss of mitochondrial membrane potential (Figure 6D) and inhibited the release of both cytochrome c (Figure 7A) and AIF (Figure 7B) from mitochondria.
Figure 6. DFO protects against H2O2-induced loss of mitochondrial membrane potential.
Suspended Jurkat cells (1.5×10⁶ cells/ml) were exposed (B and D) or not (A and C) to continuously generated H2O2 for 5 h (0.1 μg/ml GO, able to generate approx. 2 nmol of H2O2/min per ml, was added to complete medium). In (C) and (D), cells were initially exposed to 1 mM DFO for 2 h before oxidative stress was generated. After exposure to oxidative stress, cells were collected by centrifugation, washed in PBS and resuspended for 15 min in PBS containing 1 μg/ml JC-1, and both green and red fluorescence were analysed by flow cytometry. Experiments were performed twice with essentially the same results.
Figure 7. DFO protects against H2O2-induced release of cytochrome c and AIF from mitochondria.
Jurkat cells (1.5×10⁶ cells/ml), treated or not with 1 mM DFO for 2 h, were exposed to 0.1 μg/ml GO (generating approx. 2 nmol of H2O2/min per ml) for 5 h. Subsequently, cells were fractionated, and cytosolic (A) and nuclear (B) portions were isolated and analysed for the presence of cytochrome c and AIF respectively by Western blotting (see the Materials and methods section for details). The lower panels represent Ponceau staining of the relevant part of the membrane to show equal loading. Lane 1, untreated cells; lane 2, cells exposed to GO for 5 h; lane 3, cells pretreated with 1 mM DFO for 2 h before exposure to GO; lane 4, cells treated with DFO only for 7 h.
Taken together, these results strongly support the hypothesis that, after exposure of cells to higher than normal concentrations of H2O2, an initial interaction with redox-active iron takes place in the endosomal/lysosomal compartments, resulting in destabilization of their membranes and the release of low-mass iron and a variety of potent hydrolases. This results in cellular damage, including to nuclear DNA, and apoptotic or necrotic cell death if the lysosomal breakdown is respectively moderate or more extensive [33,34]. In agreement with previous reports from our group [1,10,14,15,32–34,38,40,42], lysosomal destabilization (Figure 5) was always an early event compared with mitochondrial alterations (Figures 6 and 7).
DISCUSSION
The results presented in this work strongly support the idea that DFO-chelatable iron plays a central role in the molecular mechanisms behind H2O2-induced DNA damage and apoptosis. As DFO has been shown previously to be taken up by fluid-phase endocytosis, pass through endosomes and late endosomes, and accumulate in the lysosomal compartment [14,15,19,20], the redox-active iron pools in these compartments are emerging as central players in mediating the numerous phenomena found in H2O2-exposed cells. In particular, it seems likely that when the normal cellular steady-state concentration of H2O2 increases over a certain threshold, it will interact with redox-active iron inside these compartments. Although we are unable to estimate the exact value of this threshold concentration, it should be noted that in our experimental system an extracellular production rate of H2O2 of between 0.2 and 2 nmol of H2O2/min per ml was required to obtain observable effects with respect to DNA damage and apoptosis. The resulting intracellular concentration of H2O2 is within the range of concentrations that may occur under pathological oxidative stress situations [35].
Another debated question, that we hope is at least partly explained by the results of the present study, regards the location of DFO-chelatable iron. We show clearly that the protective effect of DFO exposure against H2O2-induced DNA damage and lysosomal rupture increases slowly during the first 2–3 h of incubation, while the same treatment had removed almost all calcein-chelatable iron within a period of approx. 20 min, when there was as yet no lysosomal protection. These observations, in combination with the fact that the rate of replenishment of ICIP in a PBS-based solution, devoid of low-mass iron, decreases as the DFO incubation period is lengthened, may provide important information. We suggest that, under the experimental conditions used, DFO and calcein bind iron in different cell compartments.
In normal cells, iron is released into the cytosol from late endosomes following (i) transferrin-mediated Fe uptake and (ii) nontransferrin-mediated Fe uptake through membrane metal transporters [36]; iron is also transported into the cytosol from (iii) lysosomes, where a large number of iron-containing metalloproteins are degraded as a consequence of normal autophagocytotic activities [2,32,37]. When cells are exposed to DFO, route (ii) is quickly halted (extracellular iron is effectively complexed with DFO), and route (i) is prevented from operating somewhat later (when DFO is internalized into endosomes and late endosomes), while route (iii) is not suspended until 2–3 h later (when a sufficient amount of DFO has reached the lysosomal compartment). With the presence of DFO in the medium surrounding the cells, iron seems to be ‘sucked out’ of the cell, explaning why ICIP falls to zero after only 20 min, when there is as yet still no lysosomal protection at all because no DFO has reached the lysosomal compartment.
When DFO-exposed cells are transferred to a milieu free of iron, ICIP quickly returns to significantly higher values if the initial exposure to DFO was short (Figure 4). This is thought to be an effect of transport of low-mass iron from lysosomes that are still rich in unchelated iron and, perhaps, from some late endosomes as well. However, when cells were exposed to DFO for 2–3 h, the subsequent increase in ICIP levels was almost non-existent (see Figure 4). The suggested explanation is that by then all of the above-described routes (i), (ii) and (iii) for the transport of iron to the cytosol would be blocked. Moreover, our results suggest that the hydrophilic calcein, which is the product of cleavage of the lipophilic calcein-AM by unspecific cytosolic esterases, does not pass easily through cellular membranes, and thus binds cytosolic iron but not iron inside late endosomes or lysosomes.
It is likely that when the interior of cells is exposed to concentrations of H2O2 higher than a certain threshold, and the H2O2 is not immediately degraded by H2O2-catabolizing enzymes such as catalase, glutathione peroxidase and peroxyredoxin, it may interact in Fenton-type reactions with intracellular redox-active iron, which most probably is loosely bound to intracellular low- and high-molecular-mass components. Since endosomes and lysosomes seem to be much richer in low-mass iron than the cytosol [2,32], the major interaction between H2O2 and iron probably takes place within these organelles, leading to destabilization of their membranes and the release of their components into the surrounding cytosolic space. Delocalized lysosomal components, such as B, H and L cysteine proteases, have been suggested as mediators in the process of apoptosis, although the molecular mechanisms are still not completely known [33,34,38–43].
Iron represents an attractive complement to lysosomal proteases as an apoptogenic mediator. Being smaller in size, it may be released from lysosomes at an early stage of membrane destabilization and cause site-specific damage to components of the cell, such as DNA and mitochondria, that it may be attracted to. Indeed, the results of the present investigation show that increasing the cellular H2O2 level above a certain threshold value results in lysosomal membrane destabilization that occurs in parallel with increased ICIP, decreased mitochondrial membrane potential, release of cytochrome c from mitochondria to the cytosol, and translocation of AIF from mitochondria to the nucleus (see Figures 5–7). All of these effects were prevented when cells were saturated with DFO before exposure to H2O2, strongly supporting a central role for DFO-chelatable lysosomal iron in oxidative stress-mediated pathologies.
Acknowledgments
This research was funded by the program ‘Pythagoras’.
References
- 1.Öllinger K., Brunk U. Cellular injury induced by oxidative stress is mediated through lysosomal damage. Free Radical Biol. Med. 1995;19:565–574. doi: 10.1016/0891-5849(95)00062-3. [DOI] [PubMed] [Google Scholar]
- 2.Zhengquan Y., Persson H., Eaton J., Brunk U. Intralysosomal iron: A major determinant of oxidant-induced cell death. Free Radical Biol. Med. 2003;34:1243–1252. doi: 10.1016/s0891-5849(03)00109-6. [DOI] [PubMed] [Google Scholar]
- 3.Galaris D., Evangelou A. The role of oxidative stress in mechanism of metal-induced carcinogenesis. Crit. Rev. Oncol. Heamatol. 2002;42:93–103. doi: 10.1016/s1040-8428(01)00212-8. [DOI] [PubMed] [Google Scholar]
- 4.Epsztejn S., Kakhlon O., Glickstein H., Breuer W., Cabantchik Z. Fluorescence analysis of the labile iron pool of mammalian cells. Anal. Biochem. 1997;248:31–40. doi: 10.1006/abio.1997.2126. [DOI] [PubMed] [Google Scholar]
- 5.Kakhlon O., Cabantchik Z. The labile iron pool: Characterization, measurement, and participation in cellular processes. Free Radical Biol. Med. 2002;33:1037–1046. doi: 10.1016/s0891-5849(02)01006-7. [DOI] [PubMed] [Google Scholar]
- 6.Esposito B., Epsztejn S., Breuer W., Cabantchik Z. A review of fluorescence methods for assessing labile iron in cells and biological fluids. Anal. Biochem. 2002;304:1–18. doi: 10.1006/abio.2002.5611. [DOI] [PubMed] [Google Scholar]
- 7.Schafer F., Buettner G. Acidic pH amplifies iron-mediated lipid peroxidation in cells. Free Radical Biol. Med. 2000;28:1175–1181. doi: 10.1016/s0891-5849(00)00319-1. [DOI] [PubMed] [Google Scholar]
- 8.Pisoni R., Acker T., Lisowski K., Lemons R., Thoene J. A cystein-specific lysosomal transport system provides a major route for the delivery of thiol to human fibroblast lysosomes: possible role in supporting lysosomal proteolysis. J. Cell Biol. 1990;110:327–335. doi: 10.1083/jcb.110.2.327. [DOI] [PMC free article] [PubMed] [Google Scholar]
- 9.Brunk U., Neuzil J., Eaton J. Lysosomal involvement in apoptosis. Redox Rep. 2001;6:91–97. doi: 10.1179/135100001101536094. [DOI] [PubMed] [Google Scholar]
- 10.Antunes F., Cadenas E., Brunk U. Apoptosis induced by exposure to a low steady state concentration of H2O2 is a consequence of lysosomal rupture. Biochem. J. 2001;356:549–555. doi: 10.1042/0264-6021:3560549. [DOI] [PMC free article] [PubMed] [Google Scholar]
- 11.Guicciardi M., Leist M., Gores G. Lysosomes in cell death. Oncogene. 2004;23:2881–2890. doi: 10.1038/sj.onc.1207512. [DOI] [PubMed] [Google Scholar]
- 12.Halliwell B., Aruoma O. DNA damage by oxygen-derived species: Its mechanism and measurement in mammalian systems. FEBS Lett. 1991;281:9–19. doi: 10.1016/0014-5793(91)80347-6. [DOI] [PubMed] [Google Scholar]
- 13.Barbouti A., Doulias P., Zhu B., Frei B., Galaris D. Intracellular iron but not copper plays a critical role in hydrogen peroxide-induced DNA damage. Free Radical Biol. Med. 2001;31:490–498. doi: 10.1016/s0891-5849(01)00608-6. [DOI] [PubMed] [Google Scholar]
- 14.Doulias P., Christoforidis S., Brunk U., Galaris D. Endosomal and lysosomal effects of desferrioxamine: protection of HeLa cells from hydrogen peroxide-induced DNA damage and induction of cell-cycle arrest. Free Radical Biol. Med. 2003;35:719–728. doi: 10.1016/s0891-5849(03)00396-4. [DOI] [PubMed] [Google Scholar]
- 15.Kurz T., Leake A., Zglinicki T., Brunk U. Relocalized redox-active iron is an important mediator of oxidative-stress-induced DNA damage. Biochem. J. 2004;378:1039–1045. doi: 10.1042/BJ20031029. [DOI] [PMC free article] [PubMed] [Google Scholar]
- 16.Meneghini R. Iron homeostasis, oxidative stress, and DNA damage. Free Radical Biol. Med. 1997;23:783–792. doi: 10.1016/s0891-5849(97)00016-6. [DOI] [PubMed] [Google Scholar]
- 17.Chevion M. A site-specific mechanism for free radical induced biological damage: the essential role of redox-active transition metals. Free Radical Biol. Med. 1988;5:27–37. doi: 10.1016/0891-5849(88)90059-7. [DOI] [PubMed] [Google Scholar]
- 18.Lipinski P., Drapier J., Oliviera L., Retmanska H., Sochanowicz B., Kruszewski M. Intracellular iron status as a hallmark of mammalian cell susceptibility to oxidative stress: a study of L5178 mouse lymphoma cell lines differentially sensitive to H2O2. Blood. 2000;95:2960–2966. [PubMed] [Google Scholar]
- 19.Lloyd J., Cable H., Rice-Evans C. Evidence that desferrioxamine cannot enter cells by passive diffusion. Biochem. Pharmacol. 1991;41:1361–1363. doi: 10.1016/0006-2952(91)90109-i. [DOI] [PubMed] [Google Scholar]
- 20.Cable H., Lloyd J. B. Cellular uptake and release of two contrasting iron chelators. J. Pharmacol. 1999;51:131–134. doi: 10.1211/0022357991772231. [DOI] [PubMed] [Google Scholar]
- 21.Singh N., McCoy M., Tice R., Schneider E. A simple technique for quantitation of low levels of DNA damage in individual cells. Exp. Cell Res. 1988;184:461–470. doi: 10.1016/0014-4827(88)90265-0. [DOI] [PubMed] [Google Scholar]
- 22.Collins A., Dobson V., Dusinska M., Kennedy G., Stetina R. The comet assay; what can it really tell us? Mutat. Res. 1997;375:183–193. doi: 10.1016/s0027-5107(97)00013-4. [DOI] [PubMed] [Google Scholar]
- 23.Panagiotidis M., Tsolas O., Galaris D. Glucose oxidase-produced H2O2 induces Ca2+-dependent DNA damage in human peripheral blood lymphocytes. Free Radical Biol. Med. 1999;26:548–556. doi: 10.1016/s0891-5849(98)00249-4. [DOI] [PubMed] [Google Scholar]
- 24.Collins A., Ma A., Duthie S. The kinetics of repair of oxidative DNA damage (strand breaks and oxidized pyrimidines) in human cells. Mutat. Res. 1995;336:69–77. doi: 10.1016/0921-8777(94)00043-6. [DOI] [PubMed] [Google Scholar]
- 25.Duthie S., Hawdon A. DNA instability (strand breakage, uracil misincorporation and defective repair) is increased by folic acid depletion in human lymphocytes in vitro. FASEB J. 1998;14:1491–1497. [PubMed] [Google Scholar]
- 26.Cossarizza A., Baccarani-Contri M., Kalashnikova G., Franceschi C. A new method for the cytofluorimetric analysis of mitochondrial membrane potential using the J-aggregate forming lipophilic cation 5,5′,6,6′-tetrachloro-1,1′,3,3′-tetraethylbenzimidazolcarbocyanine iodide (JC-1) Biochem. Biophys. Res. Commun. 1993;197:40–45. doi: 10.1006/bbrc.1993.2438. [DOI] [PubMed] [Google Scholar]
- 27.Yang J., Liu X., Bhalla K., Kim C., Ibrado A., Cai J., Peng T., Jones D., Wang X. Prevention of apoptosis by Bcl-2: release of cytochrome c from mitochondria blocked. Science. 1997;275:1129–1132. doi: 10.1126/science.275.5303.1129. [DOI] [PubMed] [Google Scholar]
- 28.Wolgemuth D., Hsu M. Visualization of nascent RNA transcripts and simultaneous transcription and replication in viral nucleoprotein complexes from adenovirus 2-infected HeLa cells. J. Mol. Biol. 1981;147:247–268. doi: 10.1016/0022-2836(81)90440-x. [DOI] [PubMed] [Google Scholar]
- 29.Doulias P., Barbouti A., Galaris D., Ischiropoulos C. SIN-1-induced DNA damage in isolated human peripheral blood lymphocytes as assessed by single cell gel electrophoresis (comet assay) Free Radical Biol. Med. 2001;30:679–685. doi: 10.1016/s0891-5849(00)00511-6. [DOI] [PubMed] [Google Scholar]
- 30.Barbouti A., Doulias P., Nousis L., Tenopoulou M., Galaris D. DNA damage and apoptosis in hydrogen peroxide-exposed Jurkat cells: bolus addition versus continuous generation of H2O2. Free Radical Biol. Med. 2002;33:691–702. doi: 10.1016/s0891-5849(02)00967-x. [DOI] [PubMed] [Google Scholar]
- 31.Konijn A., Glickstein H., Vaisman B., Meyron-Holtz E., Slotki I., Cabantchik Z. The cellular labile iron pool and intracellular ferritin in K562 cells. Blood. 1999;94:2128–2134. [PubMed] [Google Scholar]
- 32.Persson H., Zhengquan Y., Tirosh O., Eaton J., Brunk U. Prevention of oxidant-induced cell death by lysosomotropic iron chelators. Free Radical Biol. Med. 2003;34:1295–1305. doi: 10.1016/s0891-5849(03)00106-0. [DOI] [PubMed] [Google Scholar]
- 33.Kågedal K., Zhao M., Svensson I., Brunk U. Sphingosine-induced apoptosis is dependent on lysosomal proteases. Biochem. J. 2001;369:335–343. doi: 10.1042/0264-6021:3590335. [DOI] [PMC free article] [PubMed] [Google Scholar]
- 34.Li W., Yuan X., Nordgren G., Dalen H., Dobowchik G., Firestone R., Brunk U. Induction of cell death by the lysosomotropic detergent MSDH. FEBS Lett. 2000;470:35–39. doi: 10.1016/s0014-5793(00)01286-2. [DOI] [PubMed] [Google Scholar]
- 35.Antunes F., Cadenas E. Estimation of H2O2 gradients across biomembranes. FEBS Lett. 2000;475:121–126. doi: 10.1016/s0014-5793(00)01638-0. [DOI] [PubMed] [Google Scholar]
- 36.Richardson D., Ponka P. The molecular mechanisms of the metabolism and transport of iron in normal and neoplastic cells. Biochim. Biophys. Acta. 1997;1331:1–40. doi: 10.1016/s0304-4157(96)00014-7. [DOI] [PubMed] [Google Scholar]
- 37.Dice J. Georgetown, TX: Eurekah.com/Landes Bioscience; 2000. Lysosomal Pathways of Protein Degradation. [Google Scholar]
- 38.Yu Z., Li W., Hillman J., Brunk U. Human neuroblastoma (SH-SY5Y) cells are highly sensitive to the lysosomotropic aldehyde 3-aminopropanal. Brain Res. 2004;1016:163–169. doi: 10.1016/j.brainres.2004.04.075. [DOI] [PubMed] [Google Scholar]
- 39.Boya P., Andreau K., Poncet D., Zamzami N., Perfettini J., Metivier D., Ojcius D., Jaattela M., Kroemer G. Lysosomal membrane permeabilization induces cell death in a mitochondrion-dependent fashion. J. Exp. Med. 2003;197:1323–1334. doi: 10.1084/jem.20021952. [DOI] [PMC free article] [PubMed] [Google Scholar]
- 40.Zhao M., Antunes F., Neuzil J., Eaton J., Brunk U. Relocation of lysosomal enzymes induces mitochondria-mediated oxidative stress, release of cytochrome c and apoptosis. Eur. J. Biochem. 2003;270:3778–3786. doi: 10.1046/j.1432-1033.2003.03765.x. [DOI] [PubMed] [Google Scholar]
- 41.Cirman T., Oresic K., Mazovec G., Turk V., Reed J., Myers R., Salvesen G., Turk B. Selective disruption of lysosomes in HeLa cells triggers apoptosis mediated by cleavage of Bid by multiple papain-like lysosomal cathepsins. J. Biol. Chem. 2004;279:3578–3587. doi: 10.1074/jbc.M308347200. [DOI] [PubMed] [Google Scholar]
- 42.Yuan X., Li W., Dalen H., Lotem J., Sachs L., Brunk U. Lysosomal destabilization in p53-induced apoptosis. Proc. Natl. Acad. Sci. U.S.A. 2002;99:6286–6291. doi: 10.1073/pnas.092135599. [DOI] [PMC free article] [PubMed] [Google Scholar]
- 43.Zhao M., Eaton J., Brunk U. Protection against oxidant-mediated lysosomal rupture: a new anti-apoptotic activity of Bcl-2? FEBS Lett. 2000;485:104–108. doi: 10.1016/s0014-5793(00)02195-5. [DOI] [PubMed] [Google Scholar]


