

Abstract

For conductive polymers to be competitive with carbon-based electrode materials, it is critical to increase their surface area and electroactivity. In this work, a thick nanofibrous polypyrrole (PPy) membrane with communicating interfiber spaces was prepared through one-pot interfacial polymerization for the first time. The electrochemical properties and conductivity of the membrane were studied with cyclic voltammetry, electrochemical impedance spectroscopy, and a four-point probe. Its morphology, chemistry, and thermostability were evaluated by scanning electron microscopy, X-ray photoelectron spectroscopy, Fourier transform infrared spectroscopy, and thermogravimetric analysis. The areal specific capacitances measured between 0.0 and 0.8 V at 1 mA/cm2 were 19179, 13264, 7238, and 4458 mF/cm2 for the membranes doped with docusate sodium (AOT), camphor-10-sulfonic acid (β) (CSA), Cl–, and poly(sodium 4-styrenesulfonate) (PSS), respectively. The capacity retentions after 1000 cycles were 83, 74, 67, and 61% for the AOT-, CSA-, PSS-, and Cl–-doped membranes, respectively. The Coulombic efficiency was above 99% for all of the membranes. They showed energy densities of 1.7, 1.2, 0.7, and 0.4 mWh/cm2 and power densities of 0.61, 0.75, 0.66, and 0.62 mW/cm2 for the AOT-, CSA-, Cl–-, and PSS-doped membranes, respectively. The ultrahigh areal specific capacitance of PPy-AOT is due to its nanofibrous structure. A mechanism has been proposed to explain how this structure is formed based on the role of AOT as the surfactant. This nanofibrous PPy membrane is easy to prepare and metal-free and offers a very high areal specific capacitance, making it an excellent candidate to construct electrodes in pseudosupercapacitors.
Keywords: supercapacitor, flexible electrode, polypyrrole, areal capacitance, dopant, metal-free
Introduction
Energy has always been one of the most critical topics in human life, having a vast impact not only on the economy but also on the environment. For this reason, the use of renewable and green energy storage devices with high performance has attracted enormous interest. Supercapacitors (SCs) are high-performance and environmentally friendly energy storage devices that have gained enormous attention because of their remarkable properties, such as their high power density and long service life compared to other energy storage devices such as batteries and fuel cells.1 Electrodes are the most critical elements in SCs.
Carbon-based materials, such as graphene and carbon nanotubes, are popular in SCs mainly because of their high surface area and electrical conductivity. However, pristine carbon materials are inherently inert and require the appropriate oxidation to become electrochemically active. Stacking and aggregation, which can hardly be avoided for graphene sheets and carbon nanotubes, can significantly reduce the surface area of these two carbon materials. Conductive polymers are used as electrode materials because of their intrinsic electrochemical activity that can provide pseudocapacitance, good conductivity, low price, and light weight.2 In particular, the light weight gives them a particular advantage in portable, wearable, and flexible devices.2,3 Among conductive polymers, polypyrrole (PPy) has been studied intensively due to its unique properties such as ease of synthesis, environmental stability, reversible redox activity, and high electrochemical performance.4 Nevertheless, enhancing the electrochemical performance of PPy as an electrode material continues to be the focus in SC development.
One strategy to improve the electrode capacitance made of conductive polymers is to incorporate metal–organic frameworks (MOFs).5 However, this strategy increases not only the cost but also the environmental impact because of the use of heavy metals, in particular, transition metals. Another strategy is to compose with other carbon materials or metal oxides. For example, Chen et al. reported an areal specific capacitance of 411 mF/cm2 for rGO/PPy films.6 Cellulose nanofibers were used as a skeleton to support carbon nanotubes and activated carbons to construct a SC.7,8 Another group fabricated tectorum-like α-Fe2O3/PPy nanoarrays, showing an areal specific capacitance of 382.4 mF/cm2.9 In another unconventional approach, ferric oxide was deposited on nickel foam that was then electrochemically coated with PPy, resulting in 1050 mF/cm2 at 1 mA/cm2.10 A specific capacitance of 151 mF/cm2 was also reported for a graphene/PPy composite.11 An interesting work grew PPy nanowires from the surface of graphene nanosheets and reported 1058 and 910 F/g at 0.5 and 10 A/g.12 With respect to the strategies mentioned above that compose PPy with other substances, another commonly used strategy is to select appropriate dopants. The charge-transfer process and consequent specific capacitance in a polymer structure strongly depend on the dopant type. The influence of dopants on the electrochemical performance of PPy has been widely documented.13,14 The type of dopant also has a significant effect on the size and shape of the synthesized PPy.14 In addition, dopants can tune the different characteristics of PPy. For example, bulky dopants can improve the cyclic stability but, on the other hand, can reduce the doping ratio and consequently decrease the conductivity.15 On the other hand, aromatic dopants favor the PPy ring orientation and thus increase the conductivity.16
This study focuses on the impact of dopants on the structure and electrochemical performance of a free-standing soft PPy membrane previously developed in our laboratory through template-assisted interfacial polymerization (TIP).17 A maximum areal specific capacitance of 19179 mF/cm2 was achieved when a nanofibrous PPy was produced using AOT as the codopant, showing the paramount importance of the dopant and communicating nanostructures on the conducive polymer capacitance.
Experimental Section
Materials
Pyrrole monomer (Py, ≥98%, Fisher Scientific, Ottawa, Canada) was distilled and stored at 4 °C before being used to synthesize the PPy membranes. Ferric chloride hexahydrate (FeCl3·6H2O, 98%, Sigma-Aldrich, Milwaukee, WI) was used as the oxidant. Methyl orange (MO, ACS reagent, dye content 85%, Sigma-Aldrich, St. Louis, MO) was used as the nanoscale template. Camphor-10-sulfonic acid (β) (CSA, 98%, Sigma-Aldrich), poly(sodium 4-styrenesulfonate) (PSS, Mw = 70000, Sigma-Aldrich), and docusate sodium (AOT, Sigma-Aldrich) were used as the dopants. Sodium chloride (99.0%, EMD Chemicals, Darmstadt, Germany) was used as the additional chlorine dopant. Sulfuric acid (H2SO4, 95–98%, Laboratories MAT, Quebec, Canada) was used for acidic treatment. All chemicals were used as received except Py, which was used after distillation.
Preparation of the PPy Membrane
The method used to synthesize the PPy membranes was TIP, as we previously reported.17,18 Briefly, two immiscible solvents, i.e., chloroform and deionized water, were put together in a large beaker to form two completely separated phases, with chloroform at the bottom because of its high density. Py was dissolved in chloroform. FeCl3, MO, and dopant were dissolved in water. Polymerization started once the two liquid phases were put together and was kept at 4 °C for 48 h to form the membrane. The mole ratio of the reactants was exactly the same as that already reported,18 except that 5 mmol of each dopant was dissolved in the aqueous phase. At the end of the polymerization, the membranes were carefully harvested and treated in 1 M sulfuric acid at room temperature for 2 h. The membranes, named PPy-AOT, PPy-CSA, PPy-Cl, and PPy-PSS, were used for electrochemical analyses immediately after acidic treatment. The membranes were dried at room temperature for other analyses. The mass per unit area of the dry membranes was measured between 0.002 and 0.012 g/cm2 (Table S1).
Cyclic Voltammetry (CV)
The electrochemical CV was investigated by using a PalmSens4 potentiostat/galvanostat/impedance analyzer (PalmSens BV, Houten, The Netherlands). The PPy membranes were cut into circular specimens of 1 cm diameter to be used as the working electrode. An Ag/AgCl electrode, a Pt mesh (2.0 cm × 2.0 cm), and a 1.0 M H2SO4 aqueous solution were used as the reference electrode, counter electrode, and electrolyte, respectively. The CV scans were recorded in a potential window of 0.00–0.80 V at a scan rate of 0.01 V/s. This experiment was repeated five times for each type of the membrane. The same analytical instrument, electrochemical cell configuration, electrodes, and electrolyte were used for other electrochemical experiments.
Galvanostatic Charge–Discharge (GCD) Test
The GCD test was performed in the potential window of 0.00–0.80 V at current densities of 1.0, 2.0, and 4.0 mA/cm2. The areal specific capacitance was calculated based on the results at these three current densities. To test the cyclic stability, the capacitance retention was calculated after 1000 cycles in a potential range of 0.0–0.8 V at a current density of 5 mA/cm2. The number of cycles was limited by the capacity of the software. This experiment was repeated five times for each type of membrane.
Electrochemical Impedance Spectroscopy (EIS)
EIS of the membranes was measured in the frequency range of 0.1 Hz to 10 kHz by imposing a 5 mV alternating current on a 0.8 V direct-current potential with 10 points/decade at room temperature. The data were fitted into equivalent circuits using the EIS Spectrum Analyzer fitting program from the instrument manufacturer. Each test was repeated five times.
Sheet Resistivity
The sheet resistivity (Ω·cm) of the membranes was measured at room temperature and 60% humidity using a Jandel multiheight four-point probe (Jandel Engineering Ltd., Linslade, Beds, U.K.). A total of 10 measurements at randomly selected locations on the membrane were averaged to calculate the sheet conductivity (S/cm), which is the reciprocal of the sheet resistivity.
Morphological Characterization
The morphology of the membranes was characterized using scanning electron microscopy (SEM; Quanta 250, Philips/FEI, Chatsworth, CA) operated at an accelerating voltage of 20 kV. The specimens were coated with gold in a sputter coater (Polaron SC500, Fison Instruments, Uckfield, U.K.) to reduce the noise in the images. Observations were performed across the specimens with representative photomicrographs taken at different magnifications.
Attenuated Total Internal Reflectance Fourier Transform Infrared Spectroscopy (ATR-FTIR)
To measure the chemical composition of the membranes, a Nicolet Magna-IR 550 spectrophotometer (Nicolet Instrument, Inc., Madison, WI) operated in ATR mode was used. Specimens were pressed against a hemispherical ATR crystal and scanned 64 times between 500 and 4500 cm–1 at a resolution of 4 cm–1.
Thermogravimetric Analysis (TGA) Study
The thermostability of the membranes was measured with TGA2 STAREe (Mettler-Toledo, Schwerzenbach, Switzerland) in the temperature range from 25 to 600 °C at a heating rate of 20 °C/min. Data analysis was performed using the software TGA2 STAREe, version 16.10 (build10612), from the instrument manufacturer. The measurements were taken in triplicate for each membrane.
X-ray Photoelectron Spectroscopy (XPS)
The surface chemical composition of the membranes was analyzed with a PerkinElmer PHI 5600 X-ray photoelectron spectrometer (PerkinElmer, Eden Prairie, MN). The takeoff angle of the emitted photoelectrons to be measured was 45◦ with respect to the normal of sample surface, and the analyzed area was 0.5 cm2. The vacuum in the sample chamber was maintained at a pressure of 8 × 10⁻⁹ Torr. Both survey and high-resolution scans of C1s, O1s, and N1s were performed without charge neutralization and with the standard aluminum X-ray anode. The spectrometer work function was adjusted to give 285.0 eV for the main C1s peak assigned to the hydrocarbons. Curve fittings for high-resolution peaks were determined by means of the least-squares minimization procedure employing Gaussian–Lorentzian functions and a Shirley-type background using the MultiPak software. For each membrane, the presented results correspond to the average value of three tests.
Energy-Dispersive X-ray Spectroscopy (EDS)
The chemical composition of the PPy-AOT membrane was further analyzed with EDS using an Inspect F50 spectrometer (FEI, Hillsboro, OR). The EDS detector is an EDAX Octane Super A (EDAX Ametek, Berwyn, PA), and the processing program is TEAM EDAX. The data were collected at 15 kV for 30 s at a resolution of 129.5 eV. Three to four locations on both water- and chloroform-facing surfaces and at the cross section were analyzed. Because the analysis is standard-less, meaning using the building standards from the databank of the instrument manufacturer, the results should be considered semiquantitative.
Results and Discussion
CV
The typical CV scans of the PPy membranes are presented in Figure 1, showing the typical redox process of chemically synthesized PPy. Among different membranes, the one synthesized with AOT showed the largest undercurve area, meaning the best charge-transfer capacity among the four membranes. Based on the results, the charge-transfer efficiencies of the membranes are in the following order: PPy-AOT > PPy-CSA > PPy-Cl– > PPy-PSS.
Figure 1.
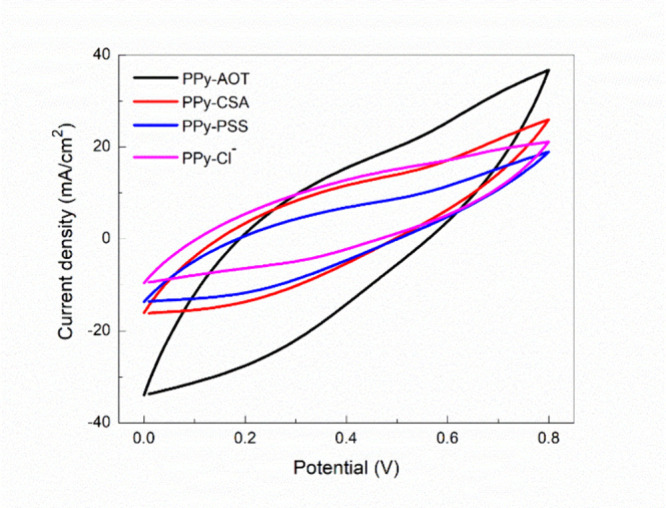
CV curves of the PPy membranes doped with different dopants, measured at 0.01 V/s.
GCD Characterization
Figure 2 shows the GCD curves of different PPy membranes that were tested under current densities of 1, 2, and 4 mA/cm2 in a potential range of 0.0–0.8 V. It is obvious in Figure 2a–c that the discharging time is significantly increased for PPy-AOT, and the charge curves (Figure 2d–f) confirm that the charge stored in PPy-AOT is indeed much higher than that in the other three membranes. Among the other membranes, PPy-CSA and PPy-Cl– show a longer discharging time and higher stored charge compared to the PPy-PSS membrane. All curves show good reversibility. The cyclic stabilities of the membranes are mostly in line with their specific capacities, meaning that PPy-AOT has the best cyclic stability compared to the others. As shown in Figure 3, PPY-AOT retained 83% of its capacity after 1000 cycles, while for the other three membranes, their capacity retentions were about 74%, 61%, and 67% for PPy-CSA, PPy-Cl–, and PPy-PSS, respectively. The Coulombic efficiency (CE) was calculated by comparing the discharge and charge capacity in the same cycle. As shown in Figure 3, for PPy-AOT and PPy-CSA, the charge released in the discharging process was only slightly lower than that in the charging process, showing an impressive 99.95% or higher energy efficiency over all 1000 cycles. Even for the other two membranes, the energy efficiency was higher than 99%.
Figure 2.

GCD (a–c) and charge (d–f) curves of the four PPy membranes at current densities of 1, 2, and 4 mA/cm2, respectively.
Figure 3.

Capacity retention and CE after different cycles at 5 mA/cm2.
The areal specific capacitance was calculated based on the following equation:19
| 1 |
where Ca is the areal specific capacitance (mF/cm2), I is the discharge current (mA), Δt is the discharge time (s), A is the nominal surface area of the working electrode that is 0.78 cm2, and ΔV is the potential window (V) after a deduction of the IR drop. The energy density E (Wh/cm2) and power density P (W/cm2) were also calculated based on the following formulas:20
| 2 |
| 3 |
where C is the areal specific capacitance (F/cm2), ΔV is the potential window (V), and Δt is the discharge time (s).
The calculated specific capacitances are listed in Table 1. Data under all three current densities confirm that using AOT as the dopant dramatically increased the specific capacitance. This conclusion is also supported by the CV results. On top of that, the PPy-AOT membrane also recorded the longest discharge time (Figure 2). Because PPy-AOT showed the highest areal specific capacitance, an additional experiment was carried out to determine its weight specific capacitance. At 0.5, 1.0, and 1.5 A/g, the PPy-AOT membrane recorded capacitances of 430, 210, and 150 F/g, respectively.
Table 1. Electrochemical Performance of the PPy Membrane Electrodes.
| areal
capacitance (mF/cm2), GCD |
||||||
|---|---|---|---|---|---|---|
| electrode | 1 (mA/cm2) | 2 (mA/cm2) | 4 (mA/cm2) | energy density (mWh/cm2) | power density (mW/cm2) | capacitance retention (1000 cycles) |
| PPy-AOT | 19179 | 12676 | 9760 | 1.7 | 0.61 | 82.7 |
| PPy-CSA | 13264 | 11560 | 3040 | 1.2 | 0.75 | 74.4 |
| PPy-Cl– | 7238 | 5730 | 2550 | 0.7 | 0.62 | 61.1 |
| PPy-PSS | 4458 | 2907 | 880 | 0.4 | 0.66 | 66.7 |
| Data from Recent Literature (Units Added If Different from Those Above) | ||||||
| PPy/carbon felt/aniline 2-sulfonic acid21 | 913 at 8 A/g | 1005 Wh/kg, asymmetric SC | 3000 W/kg | 93.6%, 5000 cycles | ||
| rGO/PPy22 | 1267 at 1 mA/cm2 | 0.056, symmetric SC | 0.8, symmetric SC | 93% | ||
| α-Fe2O3/PPy nanoarray23 | 382.4 at 0.5 mA/cm2 | 0.22 mWh/cm3, asymmetric SC | 165.5 mW/cm3, asymmetric SC | 97.2% (5000 cycles) | ||
| PPy/NiO24 | 679 F/g at 1 A/g | 94.4 Wh/kg | 500.7 W/kg | 83.9% | ||
| PPy/CNT25 | 4585 at 2 mA/cm2 | 0.129, symmetric SC | 12.5, symmetric SC | 79.03%, 10000 cycles | ||
| CoZnNi-OH/CuCoP/CW26 | 2900 at 4 mA/cm2 | 0.128, asymmetric SC | 1.83, asymmetric SC | 93.7%, 5000 cycles | ||
| MXene/BC@PPy27 | 221 at 2 mA/cm2 | 0.01, symmetric MSC | 82.6%, 5000 cycles | |||
| MXene/AgNWs&BC//Zn28 | 909 at 0.5 mA/cm2 | 0.227, asymmetric redox capacitor | 1.41, asymmetric redox capacitor | 75%, 1000 cycles | ||
| MXene/SNWs29 | 0.117, symmetric redox capacitor | 0.16, symmetric redox capacitor | 80%, 1000 cycles | |||
| WL-M/A-AE30 | 1273 at 1 mA/cm2 | 0.293, asymmetric redox capacitor | 1.29, asymmetric redox capacitor | 71.5%, 1000 cycles | ||
The capacity retention, energy density, and power density at 5 mA/cm2 are listed in Table 1. PPy-AOT exhibited the highest cycle stability by retaining 82.7% of its capacitance after 1000 GCD cycles. PPy-AOT also recorded the highest energy density and the lowest power density.
EIS Characterization
Figure 4 shows the impedance spectra (Nyquist plot) and the Randle circuit obtained for the four different PPy membranes. In the Randle circuit, the solution resistance Rs is in series with the other elements in the circuit, in which the Warburg impedance (W) is in series with the electrolyte–membrane charge-transfer resistance Rct and parallel with double-layer capacitance (C1). C1 is related to the semicircle in the high-frequency part of Figure 4. On the other hand, Rct is associated with the charge-transfer process between the membrane and electrolyte that occurred during the redox reactions. Finally, the oblique line in the low-frequency region of Figure 4 demonstrates that the charge transfer is a diffusion-controlled process that is reflected by W.
Figure 4.

(a) Impedance spectra of the four PPy membranes in 1 M H2SO4 at 0.8 V potential and at frequencies between 0.1 and 10000 Hz. (b) Randle equivalent circuit used to describe the electrochemical processes in the PPy membrane electrodes.
Based on the obtained results, the Rct value of PPy-AOT was as low as 4 Ω. In comparison, the Rct values of PPy-CSA, PPy-Cl, and PPy-PSS were 10, 14, and 16 Ω, respectively. Similarly, the Warburg coefficient Aw of PPy-AOT was the lowest (0.001 k Ω/s1/2) compared to those of PPy-CSA, PPy-Cl, and PPy-PSS (0.001, 0.004, and 0.005 kΩ/s1/2, respectively). The C1 value in the membrane doped with AOT was 6 × 10⁵ nF, which is higher than that of the other membranes (5 × 10⁵ nF). These results show that the membrane doped with AOT has a superior performance in charge transfer.
Membrane Conductivity
The conductivities of the PPy membranes doped with PSS, CSA, and Cl– were about 4.2 ± 0.3, 3.5 ± 0.2, and 1.8 ± 0.1 S/cm, while that of the PPy membrane doped with AOT was about 39.1 ± 9.1 S/cm.
Membrane Flexibility and Morphology
The four types of membranes look alike macroscopically (Figure S1). They are flexible enough to bend and roll into a tube at room temperature (Figure S2) and retain such flexibility in liquid nitrogen. Figure 5 shows the SEM images of the PPy membranes prepared with different dopants. The membranes doped with chlorine, CSA, and PSS have similar structures at the chloroform-facing side, showing open and collapsed bubbles as we reported previously.17 The open bubbles look like pitcher plants, with openings of 300–500 μm and a wall thickness of about 200 nm. However, the AOT-doped membrane presents a completely different structure at this side, showing a nanofibrous morphology with communicating interfiber spaces (Figure 5A1). The diameter of the microfibers is about 500 nm. Macroscopically, the chloroform-facing side of the PPy-AOT membrane is smooth and flat. At the aqueous side, the surface morphologies of the four membranes are totally different. The membrane synthesized with AOT has a seemingly compact and particulate-like structure, with particles as small as 800 nm. The particles aggregated to gain a structural stability and at the same time exposed most of their surface. For the Cl–- and CSA-doped membranes, a loosely packed nanofiber structure was observed, similar to the chloroform-facing side of PPy-AOT. There are also bulky particles scattered on the surface that were not observed on the surface of PPy-AOT. For the membrane using PSS as the dopant, the surface appears compact, showing neither nanofibers nor nanoparticles. After 1000 charge–discharge cycles, the membranes appeared to be visually similar to the original ones. However, microscopically, cracks occurred transversally on numerous microfibers (Figure S3B).
Figure 5.

SEM photomicrographs of the chloroform-facing (column A, in contact with the current collector) and water-facing (column B, facing the electrolyte) sides of the four PPy membranes: PPy-AOT (A1 and B1); PPy-Cl (A2 and B2); PPy-CSA (A3 and B3); PPy-PSS (A4 and B4).
An interesting phenomenon was that, after collecting the membranes, the color of the water phase left by the PPy-AOT membranes was no longer red, while the water left by other types of membranes remained red. Knowing that the red color comes from MO, it became apparent that most of the MO was incorporated into the PPy-AOT membranes.
FTIR Characterization
The FTIR spectra of the PPy membranes are presented in Figure 6. Characteristic bands of PPy include C–H bending at 880–912 cm–,31 =C–H in-plane deformation at 1049 cm–1,32 C=C and C–N stretching in the Py ring at 1480–1550 cm–1, C–H wagging at 792 and 926 cm–1, N–C stretching at 1204 cm–1, and N–H stretching around 3117 cm–1.33 The peaks corresponding to the different dopants are also found in the FTIR spectra. For example, the presence of CSA is confirmed by the bands at 1050 cm–1 (SO3–) and 1700 cm–1 (C=O).33 The peaks at 1120 and 990 cm–1 are attributed to S=O, and that at 1700 cm–1 refers to the carbonyl groups in AOT, showing that AOT is successfully doped into the PPy backbone.33 The characteristic band of R-SO3– at about 1300–1370 cm–1 confirms the presence of PSS in the PPy structure.31 Because the membranes were not washed, they contain residual oxidant and MO, which contributed to the complexity of the measured spectra.
Figure 6.

FTIR spectra of the four PPy membranes with different dopants.
Thermostability
Figure 7 shows the TGA curves of the different membranes. To compare their thermostability, the temperatures corresponding to 25% and 50% of the membrane weight loss are listed in Table 2. It is clearly shown that the thermostability of the membranes changed with the dopants. The best thermostability is related to the membrane that is doped with chlorine anions, showing a weight loss of less than 50% for temperatures above 600 °C. In comparison, the three other membranes doped with PSS, CSA, and AOT retained 50% of their original weight at 488, 424, and 385 °C, respectively.
Figure 7.
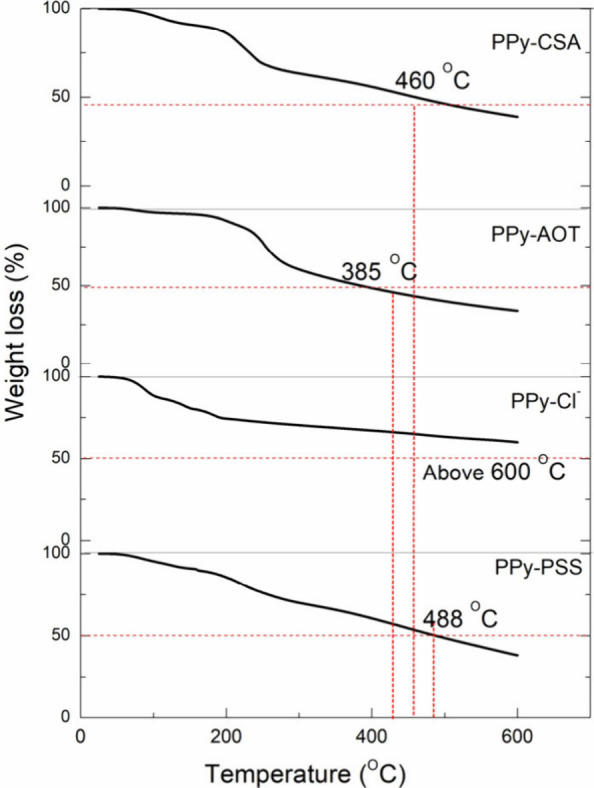
TGA curves of the four PPy membranes doped with different dopants.
Table 2. Thermal Degradation Temperatures of the PPy Membranes Measured with TGA.
| degradation
temperature (°C) at remaining weight percentages |
||
|---|---|---|
| PPy membranes | 75% | 50% |
| PPy-AOT | 255 | 385 |
| PPy-PSS | 258 | 488 |
| PPy-CSA | 230 | 460 |
| PPy-Cl– | 191 | >600 |
XPS Characterization
Figure 8 shows the curve-fitted high-resolution spectra of C1s, O1s, and N1s and the survey spectra of the four membranes. Table 3 presents the elemental composition of the PPy membranes and the doping ratio defined as the ratio of the oxidized to total nitrogen atoms identified through curve fitting of the N1s spectra.
Figure 8.

High-resolution XPS spectra of N1s (a), O1s (b), and C1s (c), and the survey scans of the four PPy membranes.
Table 3. Surface Elemental Composition (%) and Doping Ratio of the PPy Membranes Measured with XPS.
| PPy membranes | C | N | O | Si | Cl | Fe | S | N+/N (%) | doping ratio |
|---|---|---|---|---|---|---|---|---|---|
| PPy-AOT | 65.1 | 7.8 | 25.1 | 0.1 | 0.5 | 0.8 | 0.6 | 50 | 1:2 |
| PPy-CSA | 45.3 | 3.0 | 45.8 | 0.3 | 3.0 | 2.1 | 0.5 | 32 | 1:3 |
| PPy-Cl– | 37.2 | 3.6 | 52.4 | 0.6 | 2.1 | 3.1 | 1.0 | 33 | 1:3 |
| PPy-PSS | 53.3 | 5.9 | 36.5 | 0.8 | 1.8 | 0.9 | 0.8 | 25 | 1:4 |
Among them, the AOT membrane shows the highest doping ratio, that is, 1:2. The doping ratios of other membranes are 1:3, 1:3, and 1:4 for PPy-CSA, PPy-Cl–, and PPy-PSS, respectively. Oxygen was also detected in these four membranes, and the content is relatively high, ranging from 25% to 52%. Chlorine in these membranes is 0.5, 3.0, 1.8, and 2.1% for the AOT-, CSA-, PSS-, and Cl–-doped membranes, respectively. Oxygen can come from the dopant and PPy oxidation (Figure 8). The presence of C–O/C–S and C=O/C=S is broadly assigned to the dopants, MO, and oxidation.
EDS Microanalysis
Table 4 shows the elemental composition of the PPy-AOT membrane obtained with EDS microanalysis. The water-facing side and cross section showed a higher oxygen content, which is likely because of dissolved oxygen in water. The chloroform-facing surface showed a high amount of iron and chlorine, which is about a 1:2 ratio. FeCl2, the product of reduced FeCl3, might have precipitated to the bottom of the water phase (i.e., interface with chloroform) because of its high density. A higher quantity of sulfur was also found at the chloroform-facing surface, indicating a high amount of MO. In EDS analysis, the sampling depth and volume are on the order of micrometers, which are larger than the diameter of the PPy nanofibers. Therefore, the data should be considered an average in that volume instead of a particular fiber or particle.
Table 4. Microanalysis of the Elemental Composition of the PPy-AOT Membrane with EDS (%).
| C | N | O | Na | S | Cl | Fe | |
|---|---|---|---|---|---|---|---|
| water-facing side | 56.7 ± 7.2 | 21.6 ± 4.9 | 13.6 ± 6.6 | 0.4 ± 0.3 | 0.1 ± 0.1 | 5.2 ± 2.0 | 2.2 ± 1.3 |
| cross section | 61.3 ± 6.0 | 21.1 ± 5.5 | 11.0 ± 5.6 | 0.3 ± 0.1 | 0.6 ± 0.4 | 4.2 ± 2.0 | 1.5 ± 1.9 |
| chloroform-facing side | 57.5 ± 7.2 | 6.3 ± 3.0 | 8.7 ± 3.4 | 0.7 ± 0.5 | 1.6 ± 0.5 | 16.9 ± 6.1 | 8.4 ± 4.2 |
Discussion
Based on the CV and GCD analyses (Figures 1 and 2), the areal specific capacitance of the PPy membranes was significantly affected by different types of dopants. The results show that the areal specific capacitance is in the following order: PPy-AOT > PPy-CSA > PPy-Cl– > PPy-PSS. The specific capacitances of these membranes are much higher than the values reported in the literature (Table 1). For example, He et al. fabricated ultrathin graphene oxide@polypyrrole-1 (GO@PPy-1) nanosheets with a specific capacitance of 1532 mF/cm2 at 0.88 mA/cm2.34 Yang et al. designed reduced graphene oxide/PPy nanotube papers with a specific capacitance of 807 mF/cm2 at 1 mA/cm2.35 In another work, Ge fabricated a graphene/PPy film with a specific capacitance of 216 mF/cm2.36 More recently, an ultrahigh areal capacitance was reported by using a 3D-printed carbon aerogel coated with PPy, showing 8126 mF/cm2 at 2 mA/cm2.37 In this work, we report an areal capacitance of 12676 mF/cm2 at 2 mA/cm2 for the PPy-AOT membrane (Table 1), which is about 50% higher than that of the 3D-printed carbon aerogel. In particular, the soft PPy membrane in this work does not require any advanced instrument to produce, making production of the soft PPy membrane very easy. Despite PPy-AOT, the other three membranes also recorded very high areal specific capacitances, ranging from 2907 to 11560 mF/cm2 at 2 mA/cm2, indicating that not only the dopant but the PPy structure also played a significant role in achieving such a high capacitance.
Based on a four-point probe test, the sheet conductivity of PPy-AOT is 39 S/cm, which is the highest and is about 10 times higher than the other three membranes characterized. Therefore, AOT can improve not only the electrochemical performance but also the electrical conductivity. The conductivity of PPy-AOT in this work is about 2.6 times the conductivity of the PPy-AOT membrane (15 S/cm) reported by Omastová et al.38
These results are supported by the XPS results. In fact, the order of the areal specific capacitances is the same as that of the doping ratios (Table 3). The doping ratio of PPy is normally about 0.25 (1:4).39 However, the doping ratios of the membranes in this work are much higher, except that of PPy-PSS, which remains 1:4. The other three membranes showed doping ratios of 1:3 for PPy-Cl– and PPy-CSA and 1:2 for PPy-AOT. A similar or higher doping ratio was reported by Kim et al.40 Another interesting phenomenon is that the order of the specific capacitances is roughly inverse to the order of the oxygen content. PPy-Cl– and PPy-PSS had the highest oxygen content but the lowest specific capacitance. This may indicate that AOT and CSA anions have a higher philicity for pyrrole rings than Cl– and PSS–, making them less likely to be replaced by oxygen. Oxidation of PPy is a common phenomenon that can occur either during or after PPy polymerization. The interfacial polymerization of this work took 48 h without nitrogen protection, which may have increased the chance for the oxygen dissolved in water to interact with pyrroles.
There are two key factors that may explain the ultrahigh specific capacitance of the PPy-AOT membrane. The first factor is the dopant. While the four dopants are commonly used in PPy, AOT, CSA, and PSS were used for the first time to synthesize this particular type of soft PPy membrane. Normally, the morphology of the membranes is dominated by the method of synthesis, i.e., the TIP in this case.17 The typical morphology is hollow bubbles on the surface facing chloroform and nanofibers on the surface facing water (Figure 5), as we previously reported.17 However, the PPy-AOT membrane is an exception. Instead of bubbles, the chloroform-facing side of the PPy-AOT membrane is composed of nanofibers (Figure 5A1), resembling that of the water-facing surface of PPy-CSA (Figure 5B2) and PPy-Cl– (Figure 5B3) membranes. Its water-facing surface is covered by nanosized particles, in contrast to the nanofibers of the other two membranes. When we look at the cross section of the PPy-AOT membrane, as shown in Figure 9A,B, it shows a compact nanofiber structure with communicating space (only a few microns in size) throughout the entire thickness. This is very different from the cross section of the soft PPy membrane prepared with TIP, which typically shows a very thin nanofiber layer in the water phase and a dense PPy layer with thick bubbles in the chloroform phase (Figure 9C). The nanofibrous structure of the PPy-AOT membrane provides not only a much higher surface area compared to the bubbles but also a communicating environment, allowing the electrolyte to reach all of the nanofibers. This structure ensures a high surface area and so a high number of electrochemically active sites in contact with the electrolyte, which increases ion exchange and charge transfer and consequently achieves the ultrahigh specific capacity.
Figure 9.

Cross section of PPy-AOT (A and B) and the original soft PPy membranes (C) synthesized through TIP.
The second factor is the efficiency of using MO. MO forms nanorods that serve as templates on which PPy is polymerized to form nanofibers.17 It was observed after membrane synthesis that the color of the water phase in which the PPy-AOT membrane was synthesized became green and light yellow, which is the color of ferrous chloride and a trace of ferric chloride. In comparison, the water phase of the solutions in which other membranes were synthesized remained reddish or pink, which is the color of MO. This indicates that it is the PPy-AOT membrane and not others that consumed all (or most) MO. The consequence of such a highly efficient use of MO is that almost the entire PPy-AOT membrane is made of nanofibers, except the nanoparticles on the water-facing surface. The nanofibrous structure of the PPy-AOT membrane eventually renders this membrane with the highest electroactivity and consequently the highest specific capacitance.
Apparently, AOT played a key role in forming the nanofibrous membrane. AOT is an anionic surfactant that can act as a counterion in the PPy structure and can improve the conductivity and long-term stability.32 This surfactant has two long hydrophobic tails and a polar sulfonate group, as depicted in Figures 10 and S4A. When placing the aqueous solution containing oxidant, MO, and AOT on top of chloroform, AOT is expected to interact with chloroform by inserting its hydrophobic tails into chloroform and exposing its polar group to the aqueous phase. At the same time, pyrrole monomers diffuse into the aqueous phase, where they are oxidized into PPy. This is a slow process because of the limited solubility of pyrrole in water and the relatively small interfacial area. Without AOT, a thin but solid PPy membrane forms at the chloroform/water interface, which limits the diffusion of pyrrole into the aqueous phase (Figure 9C), therefore reducing the formation of PPy nanofibers. With AOT, there is no such membrane (Figure 9A,B). We hypothesize that the AOT molecules at the chloroform/water interface prevent the formation of a dense PPy membrane at the interface. Consequently, pyrrole molecules continuously diffuse into the aqueous phase to interact with MO and be polymerized into nanofibers. The EDS data of Table 4 show more sulfur at the chloroform-facing side of the PPy-AOT membrane, supporting this hypothesis. Indeed, in the formula of PPy-AOT, MO is the molecule that contains the most sulfur. PPy nanoparticles (Figure 5B1) form only at the top (water-facing side) of PPy-AOT probably because of the depletion of MO in the later stage of polymerization. This process is illustrated in Figure 10. AOT as the surfactant can also decrease the surface energy and increase the wettability of PPy, which may help the diffusion of aqueous electrolyte inside the PPy membrane and consequently improve the electrochemical performance.
Figure 10.
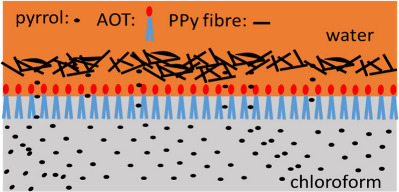
Illustration of TIP of PPy in the presence of AOT.
CSA is a sulfonic acid and has also been used as a surfactant and a dopant to synthesize PPy.41 However, the PPy-CSA membrane still formed the dense PPy layer at the interface and bubbles in the chloroform phase (Figure 5A3). This is probably because the hydrophobic part of CSA is rigid and bulky (Figure S4B), preventing CSA from forming a dense monolayer at the interface. Nevertheless, the bubbles on PPy-CSA appeared leaky and incomplete, indicating that more pyrrole molecules diffused into the water phase to form nanofibers. In comparison, both PPy-Cl– and PPy-PSS formed a dense PPy membrane and bubbles (Figure 5A2,A4). PSS is a well-known polymeric anionic dopant for conductive polymers.42 Compared to the other dopants, PPy-PSS showed the lowest specific capacitance. This difference can be related to the size of PSS (Figure S4C). Unlike the small anions that are less sterically restricted, the movement of the PPy molecules doped with PSS are sterically restricted by PSS chains, making the PPy molecules difficult to assemble on the surface of the MO nanorods. This explains why there were few PPy nanofibers on the PPy-PSS surface (Figure 5B4). Finally, when Cl– was the only dopant, which was not a surfactant, PPy-Cl– presented both a dense PPy layer and bubbles and a thin layer of PPy nanofibers (Figure 9C), as we originally reported.17
In addition, the PPy-AOT surface in contact with the current collector is not only porous at micro- and nanoscales but also flat enough to make good contact with the current collector (Figures 5A1 and 9A, chloroform side). In comparison, the bubble-like surface of the other three membranes (Figure 5A2–A4) may reduce the contact area between the membrane and current collector because of the voids inside and between bubbles. However, because of the fibrous or bubble-like nature of the PPy membranes, their contact with the current collector was not complete. This may explain the important IR drop in Figure 2. Using conductive adhesives to secure the interface may reduce the IR drop.
As expected, the thermostability of the PPy membranes is related to dopants. This is easy to understand because dopants not only interact with PPy but also have different thermostabilities. The initial weight loss in all membranes in the temperature range of 100–180 °C is related to the evaporation of moisture and other small molecules including a physically absorbed dopant on the PPy surface.35 The lowest initial weight loss was observed for the PPy-AOT and PPy-PSS membranes probably because of their high molecular weight. The second stage of weight loss is likely from decomposition of the dopant and PPy. The PPy-AOT membrane recorded an important weight loss of around 300 °C, which is assigned to AOT thermal decomposition.36 The CSA degradation temperature is around 200 °C,32 which can be clearly found in the TGA result of the PPy-CSA sample. PSS decomposition occurs between 400 and 500 °C.39 The weight loss of PPy-Cl from 180 to 400 °C is attributed to PPy chain decomposition. The highest percentage of the weight residual of PPy-Cl is because of the high relative percentage of MO in PPy-Cl (no other high-molecular-weight dopant) and high thermostability of MO, as we reported previously.18 At 400 °C, the weight losses were 34, 41, 48, and 53% for the Cl–-, PSS-, CSA-, and AOT-doped membranes, respectively. Based on the results above 400 °C, the Cl–-doped membrane has the highest thermostability (Table 2). However, PPy-AOT and PPy-PSS exhibited the best thermostability up to 200 °C.
Conclusions
While all four PPy membranes recorded high areal specific capacitances with respect to reported values, the electrical and electrochemical properties of the PPy-AOT membrane are significantly superior. By using AOT as the dopant, the areal specific capacitance of the soft PPy membrane increased almost 1 order of magnitude compared to that of the PPy-Cl membrane that we reported before (19179 vs 2226 mF/cm2 at 1 mA/cm2).18 This ultrahigh specific capacitance is associated with the nanofibrous structure of the PPy-AOT membrane. The formation of this nanofibrous structure is due to AOT, which serves as a surfactant at the interface of this MO-assisted interfacial polymerization. The PPy-AOT membrane also showed high energy and power densities, a fairly good cycling stability, an excellent energy efficiency, and thermostability of up to 200 °C. Collectively, the PPy-AOT membrane demonstrated clear advantages as an energy storage material, warranting further study in pseudo-SCs.
Acknowledgments
This project was supported by the Discovery Grant (RGPIN-2017-06138) of the Natural Sciences and Engineering Research Council of Canada and Centre de Recherche du CHU de Québec. The XPS tests were kindly done by Pascal Chevallier. Many thanks to Pascal Chevallier, Fariba Safizade, and Houshang Darvishi for their valuable technical consultations.
Data Availability Statement
Data are available upon request.
Supporting Information Available
The Supporting Information is available free of charge at https://pubs.acs.org/doi/10.1021/acsaem.4c00715.
Optical photographs of dry and wet PPy membranes, optical photograph showing a piece of PPy-AOT wrapping on a plastic tube, SEM photographs, chemical structures of the dopants, and membrane weight per unit area (PDF)
The authors declare no competing financial interest.
Supplementary Material
References
- Greenhalgh E. S.; Nguyen S.; Valkova M.; Shirshova N.; Shaffer M. S. P.; Kucernak A. R. J. A critical review of structural supercapacitors and outlook on future research challenges. Compos. Sci. Technol. 2023, 235, 109968. 10.1016/j.compscitech.2023.109968. [DOI] [Google Scholar]
- Ahmed S.; Ahmed A.; Basha D. B.; Hussain S.; Uddin I.; Gondal M. A. Critical review on recent developments in conducting polymer nanocomposites for supercapacitors. Synth. Met. 2023, 295, 117326. 10.1016/j.synthmet.2023.117326. [DOI] [Google Scholar]
- Ramya R.; Sivasubramanian R.; Sangaranarayanan M. V. Conducting polymers-based electrochemical supercapacitors - Progress and prospects. Electrochim. Acta 2013, 101, 109–29. 10.1016/j.electacta.2012.09.116. [DOI] [Google Scholar]
- Sapurina I.; Li Y.; Alekseeva E.; Bober P.; Trchová M.; Morávková Z.; Stejskal J. Polypyrrole nanotubes: The tuning of morphology and conductivity. Polymer (Guildf) 2017, 113, 247–258. 10.1016/j.polymer.2017.02.064. [DOI] [Google Scholar]
- Kalyon H. Y.; Gencten M.; Gorduk S.; Sahin Y. Novel composite materials consisting of polypyrrole and metal organic frameworks for supercapacitor applications. J. Energy Storage 2022, 48, 103699. 10.1016/j.est.2021.103699. [DOI] [Google Scholar]
- Chen J.; Wang Y.; Cao J.; Liu Y.; Zhou Y.; Ouyang J. H.; Jia D. Facile co-electrodeposition method for high-performance supercapacitor based on reduced graphene oxide/polypyrrole composite film. ACS Appl. Mater. Interfaces 2017, 9, 19831–19842. 10.1021/acsami.7b03786. [DOI] [PubMed] [Google Scholar]
- Wang T.; Xiong C.; Zhang Y.; Wang B.; Xiong Q.; Zhao M.; Ni Y. Multi-layer hierarchical cellulose nanofibers/carbon nanotubes/vinasse activated carbon composite materials for supercapacitors and electromagnetic interference shielding. Nano Res. 2024, 17, 904–912. 10.1007/s12274-023-6145-5. [DOI] [Google Scholar]
- Xiong C.; Wang T.; Zhou L.; Zhang Y.; Dai L.; Zhou Q.; Ni Y. Fabrication of dual-function conductive cellulose-based composites with layered conductive network structures for supercapacitors and electromagnetic shielding. Chem. Eng. J. 2023, 472, 144958. 10.1016/j.cej.2023.144958. [DOI] [Google Scholar]
- Wang L.; Yang H.; Liu X.; Zeng R.; Li M.; Huang Y.; Hu X. Constructing hierarchical tectorum-like α-Fe2O3/PPy nanoarrays on carbon cloth for solid-state asymmetric supercapacitors. Angew. Chemie - Int. Ed. 2017, 56, 1105–1110. 10.1002/anie.201609527. [DOI] [PubMed] [Google Scholar]
- Xia Q.; Xia T.; Wu X. PPy decorated α-Fe2O3 nanosheets as flexible supercapacitor electrodes. Rare Met. 2022, 41, 1195–1201. 10.1007/s12598-021-01880-4. [DOI] [Google Scholar]
- Mini P. A.; Balakrishnan A.; Nair S. V.; Subramanian K. R. V. Highly super capacitive electrodes made of graphene/poly(pyrrole). Chem. Commun. 2011, 47, 5753. 10.1039/c1cc00119a. [DOI] [PubMed] [Google Scholar]
- Li J.; Feng H.; Lin H.; Lu Z.; Lv S.; Li Y.; Xu J.; Lin D.; Xie H. Nanostructured polypyrrole nanowires/nitrogen-functionalized graphene composites for supercapacitor electrode. J. Energy Storage 2024, 75, 109605. 10.1016/j.est.2023.109605. [DOI] [Google Scholar]
- Zhang M.; Nautiyal A.; Du H.; Li J.; Liu Z.; Zhang X.; Wang R. Polypyrrole film based flexible supercapacitor: mechanistic insight into influence of acid dopants on electrochemical performance. Electrochim. Acta 2020, 357, 136877. 10.1016/j.electacta.2020.136877. [DOI] [Google Scholar]
- Qie L.; Yuan L. X.; Zhang W. X.; Chen W. M.; Huang Y. H. Revisit of polypyrrole as cathode material for lithium-ion battery. J. Electrochem. Soc. 2012, 159, A1624–A1629. 10.1149/2.042210jes. [DOI] [Google Scholar]
- Snook G. A.; Kao P.; Best A. S. Conducting-polymer-based supercapacitor devices and electrodes. J. Power Sources. 2011, 196, 1–12. 10.1016/j.jpowsour.2010.06.084. [DOI] [Google Scholar]
- Mitchell G. R.; Davis F. J.; Legge C. H. The effect of dopant molecules on the molecular order of electrically-conducting films of polypyrrole. Synth. Met. 1988, 26, 247–257. 10.1016/0379-6779(88)90241-X. [DOI] [Google Scholar]
- Mao J.; Li C.; Park H. J.; Rouabhia M.; Zhang Z. Conductive polymer waving in liquid nitrogen. ACS Nano 2017, 11, 10409–10416. 10.1021/acsnano.7b05546. [DOI] [PubMed] [Google Scholar]
- Roohi Z.; Mighri F.; Zhang Z. A simple trick to increase the areal specific capacity of polypyrrole membrane : Synergy of methyl orange and acid treatment. Polymers 2022, 14, 4693. 10.3390/polym14214693. [DOI] [PMC free article] [PubMed] [Google Scholar]
- Bai N.; Xu Z.; Tian Y.; Gai L.; Jiang H.; Marcus K.; Liang K. Tailorable polypyrrole nanofilms with exceptional electrochemical performance for all-solid-state flexible supercapacitors. Electrochim. Acta 2017, 249, 360–368. 10.1016/j.electacta.2017.08.034. [DOI] [Google Scholar]
- Chen Y.; Yin Z.; Huang D.; Lei L.; Chen S.; Yan M.; Du L.; Xiao R.; Cheng M. Uniform polypyrrole electrodeposition triggered by phytic acid-guided interface engineering for high energy density flexible supercapacitor. J. Colloid Interface Sci. 2022, 611, 356–365. 10.1016/j.jcis.2021.12.090. [DOI] [PubMed] [Google Scholar]
- Yazar S.; Arvas M. B.; Sahin Y. An ultrahigh-energy density and widepotential window aqueous electrolytesupercapacitor built by polypyrrole/aniline 2-sulfonic acid modified carbon felt electrode. Int. J. Energy Res. 2022, 46, 8042–8060. 10.1002/er.7706. [DOI] [Google Scholar]
- Zhu F.; She X.; Zhang Z.; Yu X.; Ji J.; Li L.; Li S. Flexible reduced graphene oxide/polypyrrole films for supercapacitors. Diam. Relat. Mater. 2024, 141, 110581. 10.1016/j.diamond.2023.110581. [DOI] [Google Scholar]
- Wang L.; Yang H.; Liu X.; Zeng R.; Li M.; Huang Y.; Hu X. Constructing hierarchical tectorum-like α-Fe2O3/PPy nanoarrays on carbon cloth for solid-state asymmetric Supercapacitors. Angew. Chem., Int. Ed. Engl. 2017, 56, 1105–1110. 10.1002/anie.201609527. [DOI] [PubMed] [Google Scholar]
- El Nady J.; Shokry A.; Khalil M.; Ebrahim S.; Elshaer A. M.; Anas M. One-step electrodeposition of a polypyrrole/NiO nanocomposite as a supercapacitor electrode. Sci. Rep. 2022, 12, 3611. 10.1038/s41598-022-07483-y. [DOI] [PMC free article] [PubMed] [Google Scholar]
- Jyothibasu J. P.; Chen M. Z.; Lee R. H. Polypyrrole/carbon nanotube freestanding electrode with excellent electrochemical properties for high-performance all-solid-state supercapacitors. ACS Omega 2020, 5, 6441–6451. 10.1021/acsomega.9b04029. [DOI] [PMC free article] [PubMed] [Google Scholar]
- Naderi L.; Shahrokhian S. Wire-type flexible micro-supercapacitor based on MOF-assisted sulfide nano-arrays on dendritic CuCoP and V2O5-polypyrrole/nanocellulose hydrogel. Chem. Eng. J. 2023, 476, 146764. 10.1016/j.cej.2023.146764. [DOI] [Google Scholar]
- Wu Y.; Hu H.; Yuan C.; Song J.; Wu M. Electrons/ions dual transport channels design: Concurrently tuning interlayer conductivity and space within re-stacked few-layered MXenes film electrodes for high-areal-capacitance stretchable micro-supercapacitor-arrays. Nano Energy 2020, 74, 104812. 10.1016/j.nanoen.2020.104812. [DOI] [Google Scholar]
- Cao Z.; Hu H.; Ho D. Micro-redoxcapacitor: A hybrid architecture out of the notorious energy-power density dilemma. Avd. Funct. Mater. 2022, 32, 2111805. 10.1002/adfm.202111805. [DOI] [Google Scholar]
- Cao Z.; Liang G.; Ho D.; Zhi C.; Hu H. Interlayer injection of low-valence Zn atoms to activate MXene-based micro-redox capacitors with battery-type voltage plateaus. Adv. Funct. Mater. 2023, 33, 2303060. 10.1002/adfm.202303060. [DOI] [Google Scholar]
- Zhang J.; Wang K.; Lu P.; Gao J.; Cao Z.; Mo F.; Ho D.; Li B.; Hu H. Wood-like low-tortuosity thick electrode for micro-redoxcapacitor with ultrahigh areal energy density and steady power output. Adv. Funct. Mater. 2024, 34, 2310775. 10.1002/adfm.202310775. [DOI] [Google Scholar]
- Gonzalez-Tejera M. J.; De Plaza M. A. L.; Sanchez La Blanca E. D.; Hernandez-Fuentes I. Electrochemical, FTIR and morphological study of polypyrrole-polystyrenesulphonate conducting films. Polym. Int. 1993, 31, 45–50. 10.1002/pi.4990310108. [DOI] [Google Scholar]
- Omastová M.; Trchová M.; Kovářová J.; Stejskal J. Synthesis and structural study of polypyrroles prepared in the presence of surfactants. Synth. Met. 2003, 138, 447–455. 10.1016/S0379-6779(02)00498-8. [DOI] [Google Scholar]
- Omastová M.; Rychlý J.; Trchová M.; Kovářová J. Properties and thermal decomposition of polypyrrole prepared in the presence of sodium bis(2-ethylhexyl) sulfosuccinate. Des. Monomers Polym. 2004, 7, 633–646. 10.1163/1568555042474220. [DOI] [Google Scholar]
- He Y.; Ning X.; Wan L. Ultrathin graphene oxide@polypyrrole nanosheets as a supercapacitor electrode with high areal specific. Polym. Bull. 2022, 79, 9075–9091. 10.1007/s00289-021-03948-8. [DOI] [Google Scholar]
- Yang C.; Zhang L.; Hu N.; Yang Z.; Wei H.; Zhang Y. Reduced graphene oxide/polypyrrole nanotube papers for flexible all-solid-state supercapacitors with excellent rate capability and high energy density. J. Power Sources 2016, 302, 39–45. 10.1016/j.jpowsour.2015.10.035. [DOI] [Google Scholar]
- Ge Y.; Wang C.; Shu K.; Zhao C.; Jia X.; Gambhir S.; Wallace G. G. A facile approach for fabrication of mechanically strong graphene/polypyrrole films with large areal capacitance for supercapacitor applications. RSC Adv. 2015, 5, 102643. 10.1039/C5RA21100J. [DOI] [Google Scholar]
- Yang J.; Cui N.; Han D.; Shen J.; Wu G.; Zhang Z.; Qin L.; Zhou B.; Du A. A simple strategy for constructing hierarchical composite electrodes of PPy-posttreated 3D-printed carbon aerogel with ultrahigh areal capacitance over 8000 mF.cm–2. Adv. Mater. Technol. 2022, 7, 2101325. 10.1002/admt.202101325. [DOI] [Google Scholar]
- Omastová M.; Trchová M.; Pionteck J.; Prokeš J.; Stejskal J. Effect of polymerization conditions on the properties of polypyrrole prepared in the presence of sodium bis(2-ethylhexyl) sulfosuccinate. Synth. Met. 2004, 143, 153–161. 10.1016/j.synthmet.2003.11.005. [DOI] [Google Scholar]
- Liang W.; Lei J.; Martin C. R. Effect of synthesis temperature on the structure, doping level and charge-transport properties of polypyrrole. Synth. Met. 1992, 52, 227–239. 10.1016/0379-6779(92)90310-F. [DOI] [Google Scholar]
- Kim D. Y.; Lee J. Y.; Kim C. Y.; Kang E. T.; Tan K. L. Difference in doping behavior between polypyrrole films and powders. Synth. Met. 1995, 72, 243–248. 10.1016/0379-6779(95)03286-X. [DOI] [Google Scholar]
- Jain S.; Karmakar N.; Shah A.; Kothari D. C.; Mishra S.; Shimpi N. G. Ammonia detection of 1-D ZnO/polypyrrole nanocomposite: Effect of CSA doping and their structural, chemical, thermal and gas sensing behavior. Appl. Surf. Sci. 2017, 396, 1317–1325. 10.1016/j.apsusc.2016.11.154. [DOI] [Google Scholar]
- Qu L.; Shi S. Hollow microstructures of polypyrrole doped by poly(styrene sulfonic acid). J. Polym. Sci. Part A Polym. Chem. 2004, 42, 3170–3177. 10.1002/pola.20157. [DOI] [Google Scholar]
Associated Data
This section collects any data citations, data availability statements, or supplementary materials included in this article.
Supplementary Materials
Data Availability Statement
Data are available upon request.