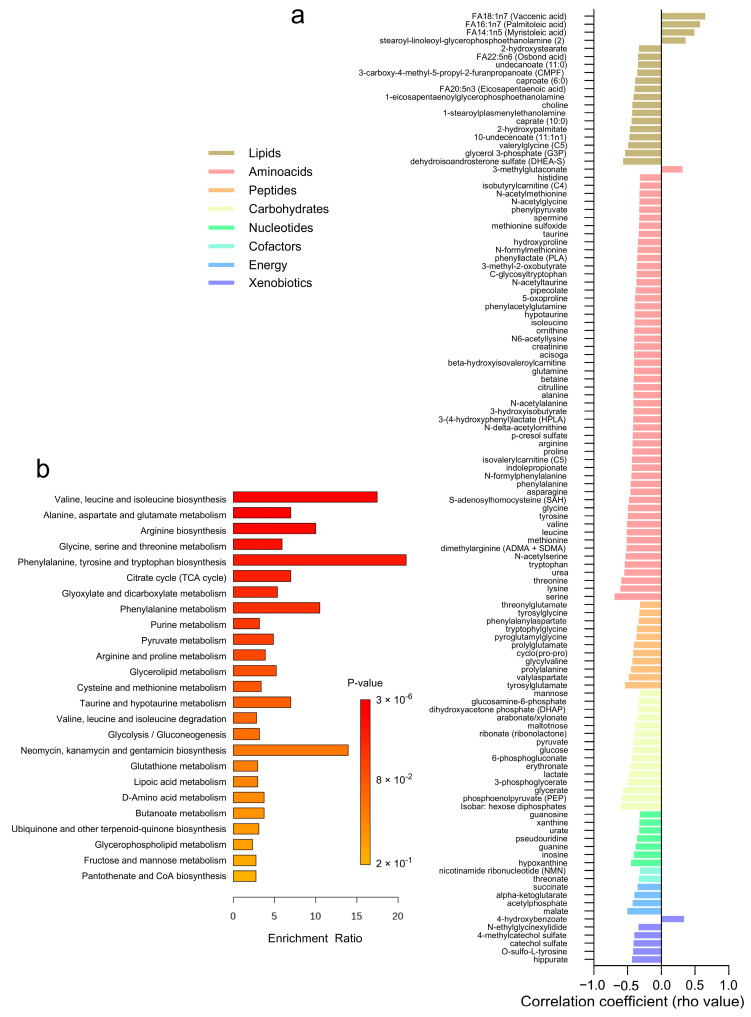
Figure 5.
Correlation Analysis of Adipose Tissue Metabolites with Adipocyte Size. (a) A heatmap displaying the correlation coefficients (rho-values) of individual metabolites with adipocyte size. (b) A bar graph showing the enrichment ratio of the top metabolic pathways significantly associated with adipocyte size.

