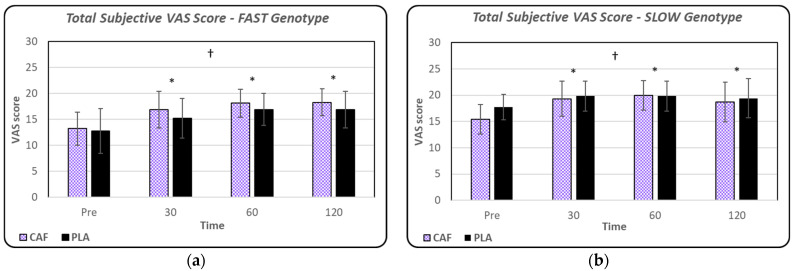
Figure 5.
(a) Mean ± standard deviation values for subjective outcome index score for FAST (CAF vs. PLA). (b) Mean ± standard deviation values for subjective outcome index score for SLOW (CAF vs. PLA). * denotes significant main effect for time (p < 0.01); † denotes significant difference between genotype groups (FAST vs. SLOW).

