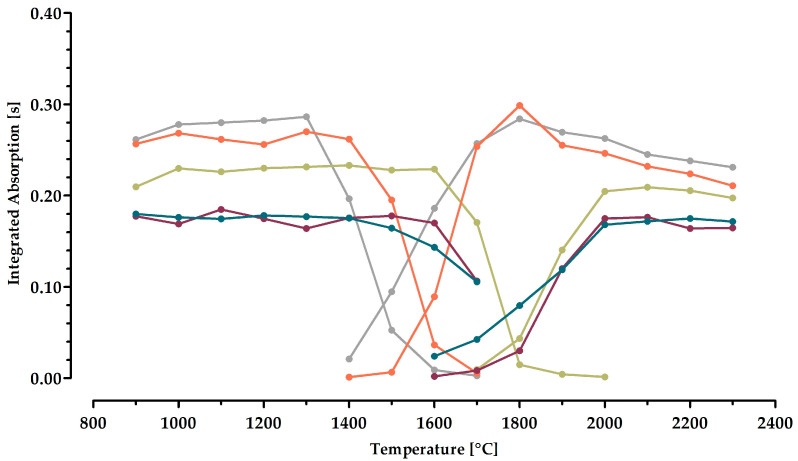
Figure 2.
Pyrolysis (left) and atomization (right) curves for the assessment of manganese (λ = 279.4817 nm). A volume of 10 µL of diluted leaf extract was injected into the graphite furnace for each measurement. The curves represent the cases of using no additive (⬤) or adding the chemical modifiers palladium (⬤), palladium and tartaric acid (⬤), palladium and ascorbic acid (⬤), as well as calcium (⬤). The data represent the mean of four different extracts with three injections each. The error bars were omitted to allow better readability.

