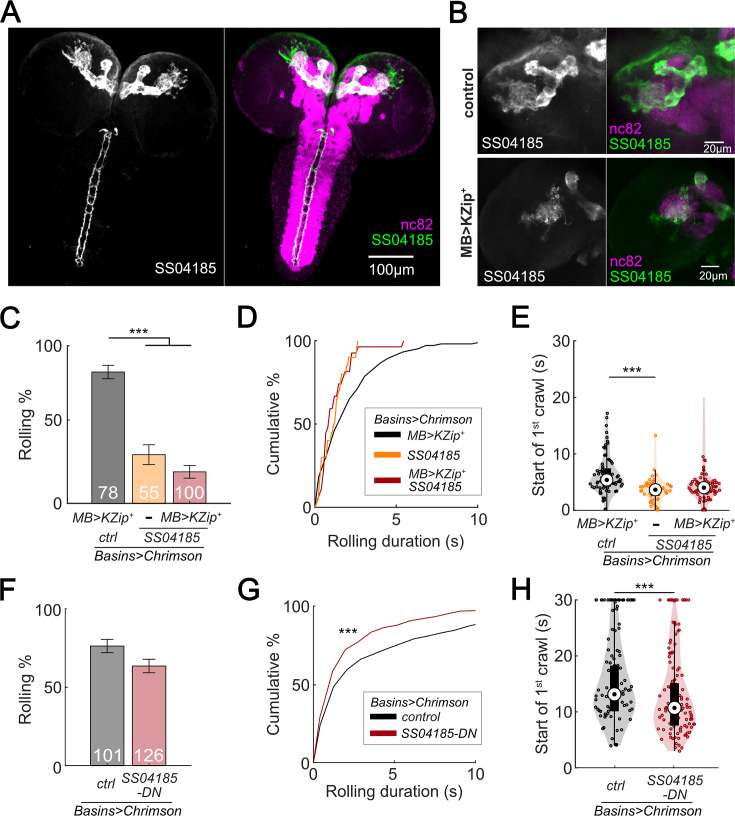
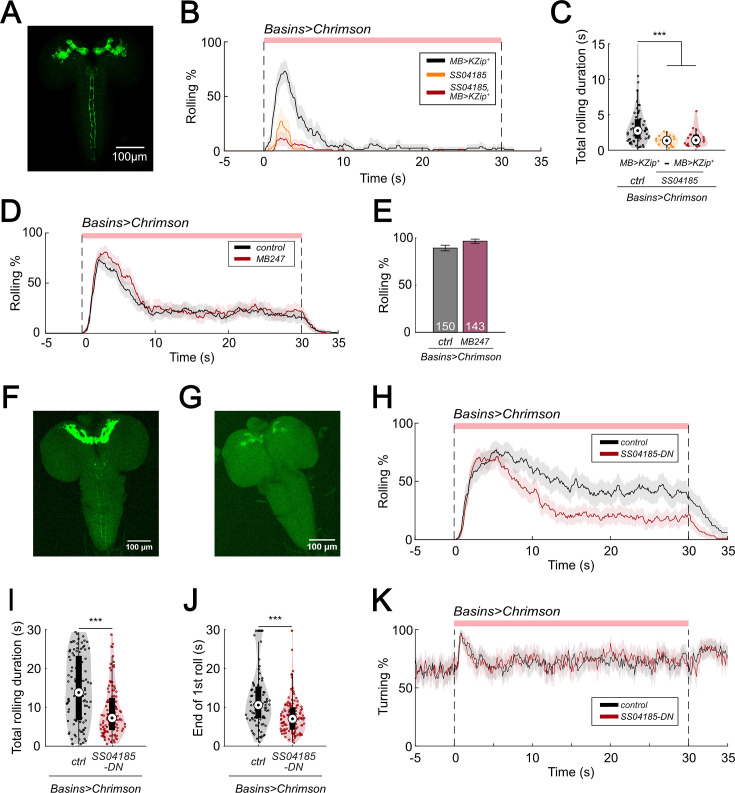
Figure 2. SS04185-DN, but not SS04185-MB, inhibits rolling when co-activated with Basins.
(A) Morphology of SS04185 neurons. GFP, gray (left), green (right); nc82, magenta. Anterior, up; dorsal view; scale bar, 100 µm. Genotype: 10xUAS-IVS-myr::GFP/+; R54B01-Gal4.AD/+; R46E07-Gal4.DBD/+. (B) Kenyon cells are less labeled in SS04185 with MB>Killer Zipper. CsChrimson::mVenus expression in Kenyon cells of SS04185 in Control and SS04185 with Killer Zipper in mushroom body (MB). mVenus, gray (left), green (right); nc82, magenta. Anterior, up; dorsal view; scale bar, 20 µm. Genotype: 20xUAS-IVS-CsChrimson::mVenus/+; R54B01-Gal4.AD/+; R46E07-Gal4.DBD/+ (control); 20xUAS-IVS-CsChrimson::mVenus/+; R13F02-LexA,LexAop-KZip+/R54B01-Gal4.AD; R72F11-Gal4/R46E07-Gal4.DBD (MB>KZip+). (C) Rolling probabilities of larvae with activation of SS04185 reduce the expression of CsChrimson in MB neurons. Error bars, 95% confidence interval. n = 78, 55, 100 from left to right. Statistics: Chi-square test, χ2 = 2.32, p > 0.05 for the two groups with SS04185 expression; χ2 = 37.50, p < 0.001 for the comparison between the two groups on the left; χ2 = 70.45, p < 0.001 for the comparison between the groups with MB>KZip + expression which reduce expression of CsChrimson in MB. Genotypes: 20xUAS-IVS-CsChrimson::mVenus/+; R13F02-LexA,LexAop-KZip+/+; R72F11-Gal4/+ (black); 20xUAS-IVS-CsChrimson::mVenusR54B01-Gal4.AD/+; R46E07-Gal4.DBD/R72F11-Gal4 (orange); 20xUAS-IVS-CsChrimson::mVenus/+; R13F02-LexA,LexAop-KZip+/R54B01-Gal4.AD; R72F11-Gal4/R46E07-Gal4.DBD (red). Genotypes in (D–E) are the same as mentioned here. (D) Cumulative plot of rolling duration. Statistics: Kruskal–Wallis test: H = 8.28, p = 0.016; Bonferroni-corrected Mann–Whitney U test, p > 0.05 for all pairwise post hoc tests, n = 103, 20, 27 from left to right. (E) A violin plot of start of first crawling bout for each larva during stimulation. Statistics: Kruskal–Wallis test: H = 15.02, p < 0.001; Bonferroni-corrected Mann–Whitney U test, p > 0.05 for the two groups with SS04185 expression; p < 0.001 for the comparison between the group without SS04185 expression and the groups with full SS04185 expression, n = 65, 20, 7 from left to right. (F) The probabilities of larval rolling during first 5 s of stimulation. Error bars, 95% confidence interval. n = 101, 126. Statistics: Chi-square test, χ2 = 4.27, p = 0.039. Genotype: 13xLexAop2-IVS-CsChrimson::tdTomato/w+, hs-FLP; R54B01-Gal4.AD/72F11-LexA; 20XUAS-(FRT.stop)-CsChrimson::mVenus/R46E07-Gal4.DBD. Genotypes in (G, H) are the same as mentioned here. (G) Cumulative plot of rolling duration. Statistics: Mann–Whitney U test, p < 0.001, n = 350, 473. (H) A violin plot of start of first crawling bout for each larva during stimulation. Statistics: Mann–Whitney U test, p < 0.001, n = 97, 120. ***p < 0.001.


