Abstract
An ultrasound-assisted dispersive liquid–liquid microextraction by solidifying floating organic droplets, coupled to a form of temperature-programmed gas chromatography flame ionization detection, has been developed for the extraction and determination of thymol and carvacrol. This method utilizes undecanol as the extraction solvent, offering advantages such as facilitating phase transfer through solidification and enhancing solvent-focusing efficiency. The optimal gas chromatography conditions include a sample injection volume of 0.2 µL, a split ratio of 1:10, and a flow rate of 0.7 mL min−1. The extraction conditions entail an extraction solvent volume of 20 µL, a disperser solvent (acetone) volume of 500 µL, pH 7.0, 7.0% NaCl (3.5 M), a sample volume of 5.0 mL, an ultrasound duration of 10 min, and a centrifuge time of 7.5 min (800 rpm). These conditions enable the achievement of a high and reasonable linear range of 3.5 to 70. 0 μg mL−1 for both thymol and carvacrol. The detection limits are found to be 0.95 and 0.89 μg mL−1, respectively, for thymol and carvacrol. The obtained relative standard deviations, 2.7% for thymol and 2.6% for carvacrol, demonstrate acceptable precision for the purpose of quantitative analysis.
Keywords: gas chromatography, thymol, carvacrol, undecanol, solvent focusing, USA-DLLME-SFO, GC-FID
1. Introduction
Thymol and carvacrol constitute the primary bioactive compounds found in the essential oils of numerous plants, including thyme, Origanum vulgare (oregano), wild bergamot, and Thymus vulgaris [1,2]. These compounds possess antitussive, antibacterial, antifungal, antioxidant, antiparasitic, anticancer, anticarcinogenic, and anti-inflammatory properties [3,4,5,6,7].
Various techniques, including thin-layer chromatography (TLC) combined with densitometry [8], gas chromatography (GC) [4,9,10], high-performance liquid chromatography (HPLC) [11,12,13,14,15,16], and fluorometric detection [17], have been employed to determine thymol and carvacrol in various matrices. Given their volatility at low concentrations, GC is a widely used analytical technique for their determination, with detectors such as a flame ionization detector (FID) [10,18,19,20] and mass spectrometry (MS) [9,10,21,22] commonly utilized.
Prior to analytical chromatography, purification and preconcentration techniques are necessary due to the low concentration of these compounds in complex matrices, representing a bottleneck and time-consuming step in analytical methods [23]. Microextraction methods such as dispersive liquid–liquid microextraction (DLLME) are increasingly employed due to their simplicity, cost-effectiveness, and lower solvent consumption [24,25]. It allows fast extraction kinetics and high enrichment factors compared to classical methods such as liquid–liquid extraction (LLE) [26,27]. DLLME, introduced in 2006 by Assadi et al. [28], involves the use of microliter volumes of the extraction solvent along with a few milliliters of dispersive solvents. The disperser solvent, miscible in both the extraction solvent and the aqueous sample solution, rapidly disperses upon injection into aqueous media, forming a homogenous cloudy phase. This accelerates the extraction process by increasing the contact area between the extraction solvent and the aqueous phase, facilitating the transfer of the target analytes from the aqueous phase to the extraction solvent. The dense extraction solvent obtained after centrifugation settles as the sedimented phase for further analysis [28,29,30,31].
Despite its advantages, DLLME has drawbacks, including the use of toxic halogenated organic solvents that are environmentally unfriendly and possess higher densities than water, making collection challenging. Dispersive liquid–liquid microextraction based on the solidification of floating organic drops (DLLME-SFO), introduced by Leong and Huang in 2008, addresses these drawbacks [32]. In DLLME-SFO, extraction solvents with low melting points and densities lower than water are utilized, allowing extraction solvent droplets to float on the surface post-centrifugation and be easily collected after solidification at low temperatures, without requiring specific holders such as micro syringe tips, hollow fibers, or polychloroprene rubbers [32]. Ultrasonic radiation, a potent aid that accelerates various analytical process steps, has gained acceptance recently due to its ability to enhance the mass transfer rates of analytes from the aqueous phase to the extraction solvent, reduce solvent consumption, and easily integrate with other extraction techniques such as DLLME-SFO [33,34,35,36,37].
The aim of this study is to develop an ultrasound-assisted dispersive liquid–liquid microextraction by the solidifying floating organic droplets (USA-DLLME-SFO) method, coupled to a temperature-programmed GC-FID, utilizing undecanol as the solvent. This approach aims to separate and quantify thymol and carvacrol, leveraging the solvent-focusing capabilities of GC-FID.
2. Results and Discussion
2.1. Optimization of the Extraction Conditions
Several experimental variables, such as the volume of extraction solvent, type and volume of the dispersion solvent, pH, type of buffer, ionic strength, sample volume (breakthrough volume), centrifugation time, and ultrasonication, were optimized to enhance the efficiency of the USA-DLLME-SFO method. Thymol and carvacrol, both at a concentration of 5.0 mg L−1, along with benzene-1, 2-diol (catechol) at a concentration of 1000.0 mg L−1 as the internal standard (to correct the variation of the injection volumes), were used. Given that the log Po/w value of catechol is 0.9 [38], it is evident that the extraction efficiency of this internal standard is considerably lower compared to the analytes (with the log Po/w values of thymol = 3.3 and carvacrol = 3.5) [38]. To ensure comparative peaks for the internal standard and the analytes, a final concentration of 1000.0 mg L−1 was employed for catechol in the sample. The relative peak area of each analyte (Isignal) to the internal standard peak area (IIS) was used as the analytical signal.
2.1.1. Selection of Extraction Solvent (1-Undecanol) Volume
To investigate the effect of the extraction solvent volume on the analyte extraction efficiency, aliquots ranging from 5.0 to 50.0 μL of 1-undecanol were examined while keeping the other experimental conditions constant. The signal intensity of the analytes increased with the increasing volume of 1-undecanol from 10.0 to 20.0 μL and then decreased (see Figure 1A). This phenomenon could be attributed to the dilution of the analytes at a higher extractant volume, resulting in a smaller analytical signal.
Figure 1.
Effect of extraction solvent. (A) Effect of the1-undecanol volume on the analytical signal in the determination of thymol (5.0 mg L−1) and carvacrol (5.0 mg L−1). Experimental conditions: disperser solvent (acetone) = 0.50 mL; (NaOH 1.0 M) pH 7.0; % NaCl = 7.0%; sample volume = 5.0 mL; ultrasound duration time = 10.0 min; centrifugation duration time (800 rpm) = 7.5 min (n = 3). (B) Effect of the dilution of the analytes on the optimization of the extraction solvent (1-undecanol) volume in the determination of thymol and carvacrol.
To demonstrate this, the analytical signals obtained at all the tested extractant volumes were adjusted by multiplying each signal by the volume of the extractant and dividing the result by the lowest extract volume utilized. The resulting corrected analytical signals were then plotted against the extractant volume, as shown in Figure 1B. As is evident from the figure, the corrected signal stabilizes at volumes of 20.0 μL and higher, indicating that the decrease in the signal intensity observed in Figure 1A at higher extractant volumes is indeed due to the analyte dilution. Consequently, 20.0 μL of 1-undecanol was selected as the optimal extraction volume for subsequent experiments. It is worth noting that micro drops could not practically form on the surface of the aqueous sample when using 1-undecanol volumes less than or equal to 5.0 μL. Typically, the volume of the extraction solvent should be sufficient to extract as many analytes as possible while ensuring an adequate volume of extracted phase for further chromatographic analysis. Hence, extractant volumes less than 10.0 μL have not been practically feasible in the developed system.
2.1.2. Selection of Disperser Solvent
The selected disperser solvent must meet several criteria. It is essential to consider not only its miscibility with both the extraction solvent and the aqueous sample but also its toxicity and cost. It should be noted that the disperser solvent aids in producing very fine, dispersed droplets of the extraction solvent throughout the aqueous sample solution, thereby significantly increasing its contact area with the aqueous sample solution. In this work, ACN, MeOH, EtOH, THF, and acetone were tested. Extraction of the analytes was carried out using 0.5 mL of each solvent with 20.0 μL of 1-undecanol under the operating conditions of pH 7.0, % NaCl = 7.0%, a sample volume of 5.0 mL, an ultrasound duration time of 10.0 min, and a centrifuge duration time (at 800 rpm) of 7.5 min. According to the results (Figure 2), acetone was selected as the disperser solvent.
Figure 2.
Effect of the type of disperser solvent on the analytical signal under experimental conditions: extractant solvent (1-undecanol) = 20.0 µL; disperser volume = 0.5 mL; pH 7.0; % NaCl = 7.0%; sample volume = 5.0 mL; ultrasound duration time = 10.0 min; and centrifuging duration time (at 800 rpm) = 7.5 min. (n = 3). (A) Determination of thymol (5.0 mg L−1). (B) Determination of carvacrol (5.0 mg L−1).
As is evident from Table 1, THF has a positive log Po/w, indicating low solubility in aqueous media. ACN, MeOH, and EtOH possess negative log Po/w values, suggesting low abilities to dissolve organic extractants. It appears that acetone has a near zero log Po/w value, indicating not only the adequate solubility of 1-undecanol in acetone but also sufficient solubility in water. On the other hand, acetone is more polar than the other potential dispersers, making it easily solvated in water to disperse the organic extraction solvent.
Table 1.
Properties of some solvents as a possible disperser in USA-DLLME-SFO [38].
| Disperser Solvent | Molar Mass (g mol−1) |
Miscibility in Water | Dipole Moment (Debye) | Log Po/w |
|---|---|---|---|---|
| Acetonitrile | 41.05 | Miscible | 3.92 | −0.334 |
| Methanol | 32.04 | Miscible | 1.69 | −0.69 |
| Ethanol | 46.07 | Miscible | 1.69 | −0.18 |
| Tetrahydrofuran | 72.11 | Miscible | 1.63 | +0.35 |
| Acetone | 58.08 | Miscible | 2.91 | −0.042 |
2.1.3. Selection of Disperser Solvent Volume
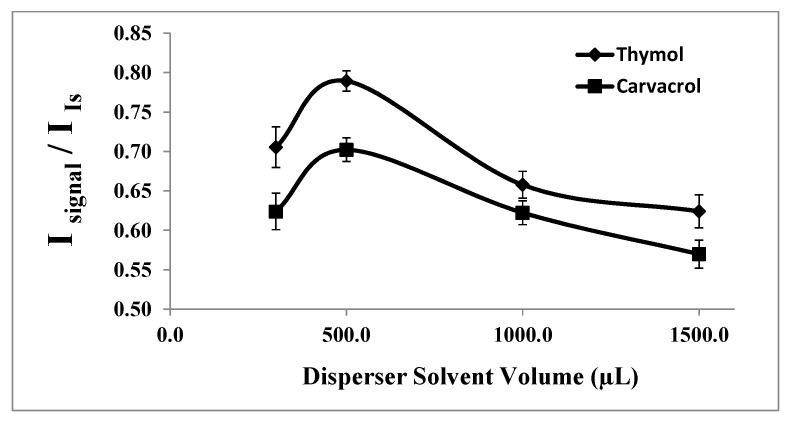
The disperser solvent must significantly increase the interfacial area between the extraction solvent and the aqueous sample solution to enhance the extraction rate. Therefore, the volume of the disperser solvent (acetone in this study) needs to be optimized. It should be noted that at low volumes of the disperser solvent, there is insufficient formation of fine droplets of extraction solvent to create a well-clouded state, resulting in reduced extraction efficiency. Conversely, at high volumes of the disperser solvent, its higher solubility in the aqueous phase compared to the organic phase often reduces the polarity of the aqueous phase, leading to decreased analyte extraction.
To investigate the effect of the disperser solvent volume on the extraction of thymol and carvacrol, various volumes of acetone (0.30, 0.50, 1.00, and 1.50 mL) with 20.0 μL of 1-undecanol were tested under constant experimental conditions. Upon careful examination of the results, as shown in Figure 3, 0.50 mL of acetone was determined to be the optimal volume for further studies.
Figure 3.
Effect of the disperser solvent (acetone) volume on the analytical signal in the determination of thymol (5.0 mg L−1) and carvacrol (5.0 mg L−1). Experimental conditions: extractant solvent (1-undecanol) = 20.0 µL; pH 7.0; % NaCl = 7.0%; sample volume = 5.0 mL; ultrasound duration time = 10.0 min; and centrifuging duration time (at 800 rpm) = 7.5 min (n = 3).
2.1.4. Optimization of pH of Aqueous Sample Solution
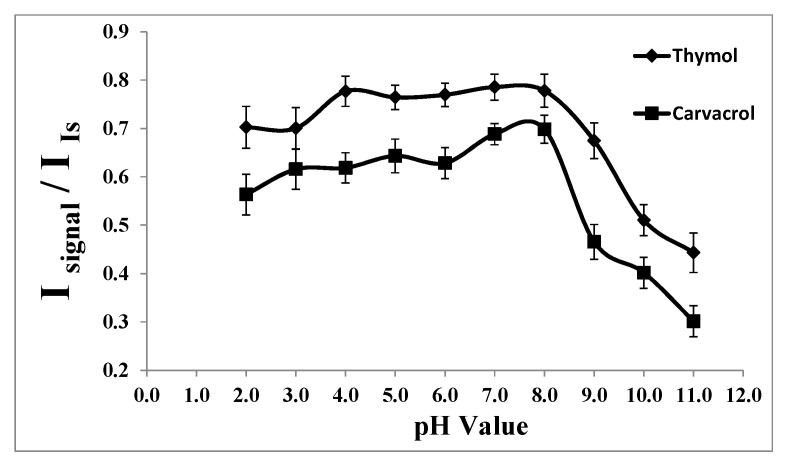
Considering the pKa values of thymol (pKa = 10.62) and carvacrol (pKa = 10.42), it is evident that they do not ionize in acidic and neutral solutions, suggesting that the extraction efficiencies might not be pH-dependent in those media.
Compounds such as alcohols and phenols (thymol and carvacrol), which contain an -OH group attached to a hydrocarbon, are very weak acids. Alcohols are typically so weakly acidic that, for normal lab purposes, their acidity is often disregarded. However, phenol exhibits sufficiently acidic properties to be recognizable, albeit still functioning as a very weak acid [39]. The hydrogen ion within the phenol structure can transfer to a base, resulting in the formation of a stable phenoxide ion due to the delocalization of negative charge around the ring on the oxygen atom. Consequently, the ion formed becomes more soluble in water and less likely to be extracted into an organic solvent. This implies that the pH of the medium impacts the extraction efficiency of thymol and carvacrol [39].
In our investigation, we examined the extraction of thymol and carvacrol across a pH range of 2.0 to 12.0 using 1.0 mol L−1 HCl and 1.0 mol L−1 NaOH solutions. As depicted in Figure 4, the signal remains stable within the pH range of 2.0 to 8.0. However, at higher pH values, there is a reduction in the signal, likely attributed to the ionization of the analytes and the formation of sodium phenoxide, leading to their increased solubility in aqueous media and consequently reduced extraction into the extracting solvent. Therefore, pH 7.0 was identified as the optimal pH for subsequent studies.
Figure 4.
Effect of the pH on the analytical signal in the determination of thymol (5.0 mg L−1) and carvacrol (5.0 mg L−1). Experimental conditions: extractant solvent (1-undecanol) = 20.0 µL; disperser solvent (acetone) = 0.50 mL; % NaCl = 7.0%; sample volume = 5.0 mL; ultrasound duration time = 10.0 min; and centrifuging duration time (at 800 rpm) = 7.5 min (n = 3).
2.1.5. Type of Solution for Adjusting the pH
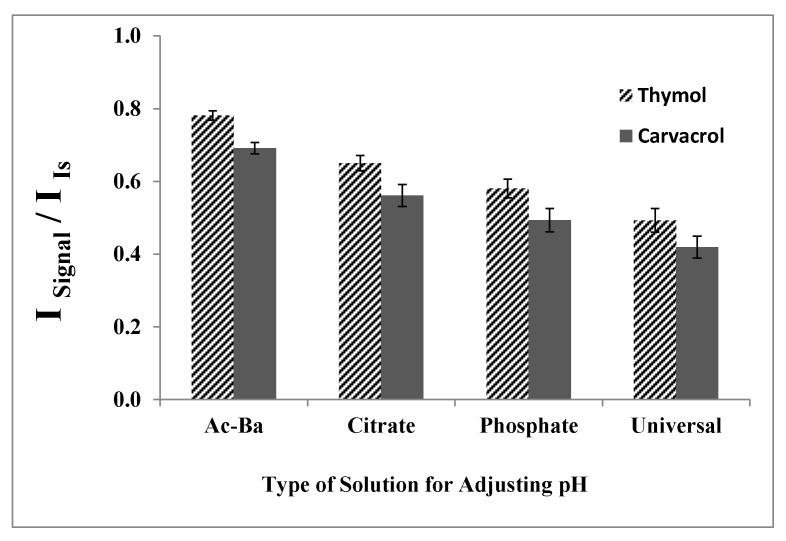
Various buffer solutions at pH 7.0 were employed under constant experimental conditions to determine the most suitable buffer. Phosphate, citrate, and universal buffers, as well as hydrochloric acid or sodium hydroxide, were utilized for the pH adjustment. As depicted in Figure 5, utilizing HCl along with NaOH to adjust the pH to 7.0 results in higher analytical signals. Consequently, NaOH was selected for the pH adjustment in the subsequent experiments.
Figure 5.
Effect of the type of buffer solution on the analytical signal in the determination of thymol (5.0 mg L−1) and carvacrol (5.0 mg L−1). Experimental conditions: extractant solvent (1-undecanol) = 20.0 µL; disperser solvent (acetone) = 0.50 mL; pH 7.0; % NaCl = 7.0%; sample volume = 5.0 mL; ultrasound duration time = 10.0 min; and centrifuging duration time (at 800 rpm) = 7.5 min.
2.1.6. Effect of Salt Addition
The addition of salt to an aqueous sample solution can sometimes enhance the extraction efficiency of analytes into the organic phase. However, higher concentrations of salt may reduce the diffusion rates of analytes into the organic phase due to the increased solution viscosity [40]. Therefore, the salt amount must be optimized in DLLME-SFO.
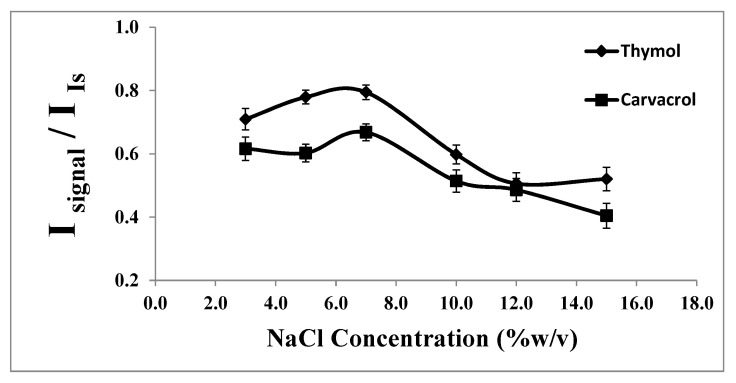
The effect of salt addition on the extraction of thymol and carvacrol was evaluated by adding sodium chloride (0.0–15.0%, w/v) into the water sample. As illustrated in Figure 6, increasing the NaCl concentration from 0.0 to 7.0% (w/v) resulted in an enhanced signal intensity and consequently increased analyte extraction. One possible explanation for this observation is that water molecules form hydration spheres around the salt ions, reducing the amount of water available to dissolve analyte molecules. This reduction in the water availability decreases the solubility of thymol and carvacrol in the aqueous phase, thereby driving more analytes into the extraction solvent [40].
Figure 6.
Effect of the % NaCl on the analytical signal in the determination of thymol (5.0 mg L−1) and carvacrol (5.0 mg L−1). Experimental conditions: extractant solvent (1-undecanol) = 20.0 µL; disperser solvent (acetone) = 0.50 mL; pH 7.0; sample volume = 5.0 mL; ultrasound duration time = 10.0 min; and centrifuging duration time (at 800 rpm) = 7.5 min (n = 3).
However, the results indicated that with further increases in the NaCl concentration, the analytical signals gradually decreased due to the increased aqueous phase viscosity and reduced diffusion rate of the analytes decreasing during the contact time. Based on these findings, a concentration of 7.0% (w/v) of NaCl was chosen as the optimum concentration.
2.1.7. Breakthrough Volume
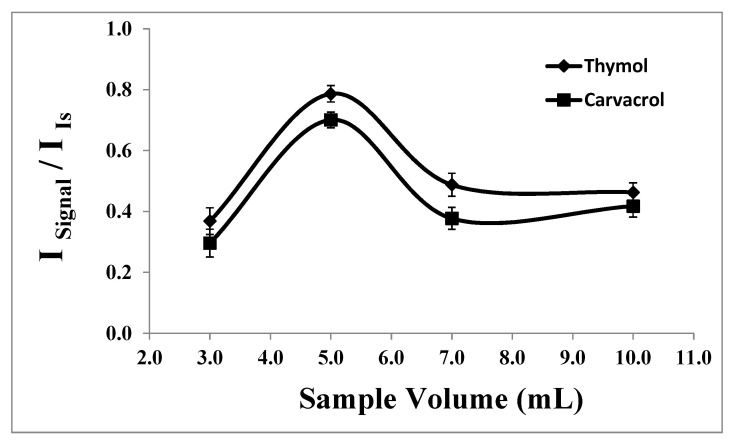
For the preconcentration of trace analytes, achieving a high preconcentration factor necessitates determining the breakthrough volume of the sample solution. The effect of the sample volume on the microextraction procedure was studied to ascertain the minimum volume that can be effectively utilized [41].
Various volumes of sample solutions, each containing 1.66 × 10⁻⁷ moles of analyte, were prepared in individual glass tubes, ranging from 3.0 to 10.0 mL, under constant experimental conditions. As illustrated in Figure 7, the highest analytical response was attained at a sample volume of 5.0 mL. In smaller sample volumes, the high concentration of the salt inhibits effective interaction between the analytes and the extraction solvent. Conversely, in larger sample volumes, incomplete dispersion of the extraction solvent leads to decreased extraction efficiencies and analytical signals.
Figure 7.
Effect of the sample volume on the analytical signal of thymol (5.0 mg L−1) and carvacrol (5.0 mg L−1). Experimental conditions: extractant solvent (1-undecanol) = 20.0 µL; disperser solvent (acetone) = 0.50 mL; pH 7.0; %NaCl = 7.0%; ultrasound duration time = 10.0 min; and centrifuging duration time (at 800 rpm) = 7.5 min (n = 3).
The preconcentration factor is calculated as the ratio of the highest sample volume for the analyte (5.0 mL) to the lowest extraction solvent volume (20.0 µL) [41]. In this study, the preconcentration factor was determined to be 250.
2.1.8. Effect of Ultrasound and Centrifugation Period
Ultrasound was employed as a disperser in the ultrasound-assisted microextraction of thymol and carvacrol due to its capability to provide sufficient mechanical and thermal energy, enabling the extraction of these heat-sensitive essential oils at low temperatures. Generally, ultrasound enhances the mass transfer rates between two immiscible phases and facilitates emulsification, thereby improving the efficiency of simultaneous liquid–liquid microextraction analytes. Additionally, ultrasound offers an inexpensive and environmentally friendly method [40].
The analytical signals were examined by varying the ultrasound durations between 6.0, 8.0, 10.0, and 12.0 min, revealing that durations of 10.0 min or longer resulted in higher signals. Similarly, centrifugation times of 2.5, 5.0, 7.5, and 10.0 min at 800 rpm were tested, revealing that durations of 7.5 min or more resulted in enhanced analytical signals due to the more efficient separation of the organic and aqueous phases.
Consequently, an ultrasound duration of 10.0 min and a centrifugation time of 7.5 min were selected for further studies.
2.2. Analytical Figures of Merit
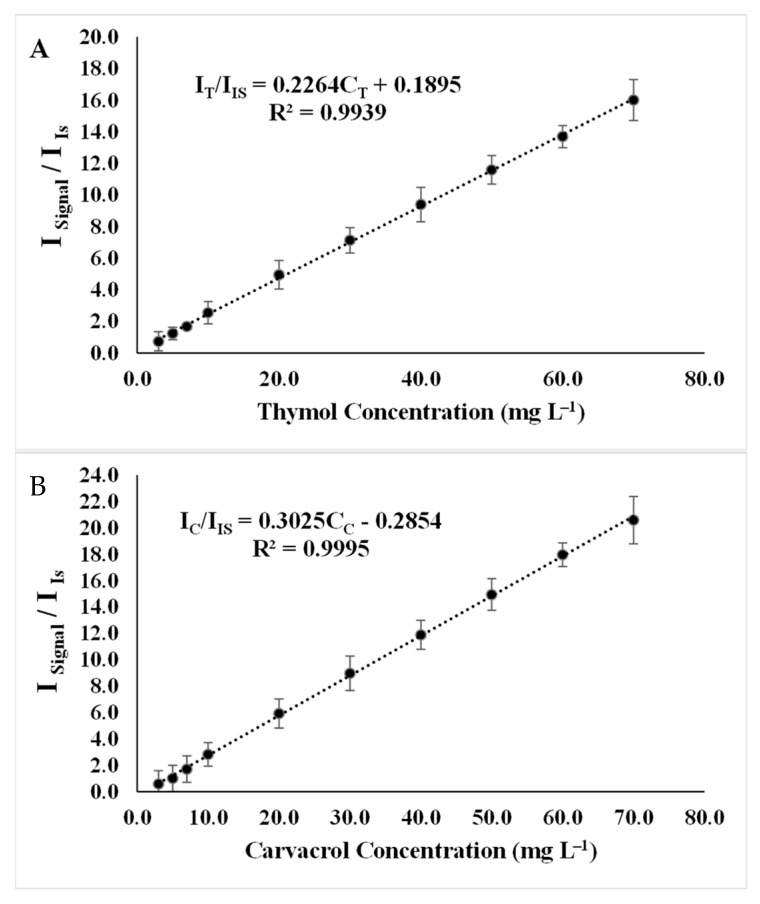
After optimizing all the experimental parameters, calibration curves were plotted on three different days for 10 concentration levels, with each concentration level replicated three times. The data obtained from these experiments were used for validation studies. It was observed that there exists a strong linear relationship between the relative signal intensity and the concentration of analytes in the concentration range of 3.5 to 70.0 μg mL−1 for thymol (Figure 8A) and carvacrol (Figure 8B).
Figure 8.
Calibration curve under experimental conditions: extractant solvent (1-undecanol) = 20.0 µL; disperser solvent (acetone) = 0.50 mL; pH 7.0; %NaCl = 7.0%; ultrasound duration time = 10.0 min; and centrifuging duration time = 7.5 min. (I/IIS = relative signal intensity of analyte to signal intensity of internal standard and CT = thymol concentration, CC = carvacrol concentration). (A) Thymol. (B) Carvacrol.
The limit of detection (LOD) was calculated to be 0.95 and 0.89 μg mL−1, while the limit of quantification (LOQ) was determined to be 3.16 and 2.96 μg mL−1 for thymol and carvacrol, respectively.
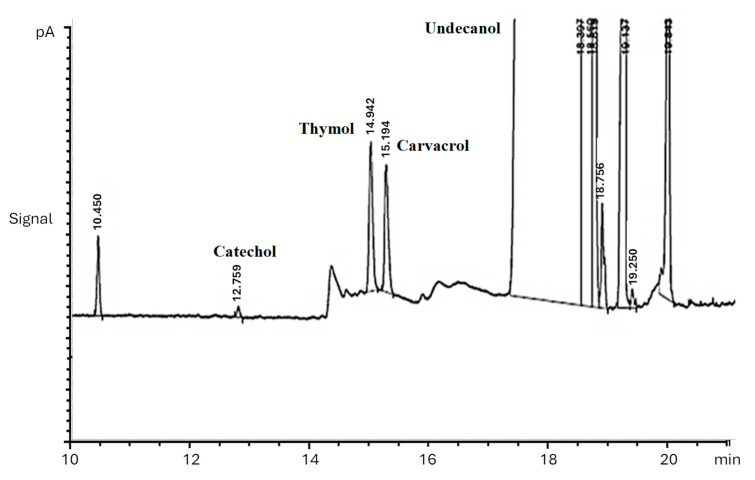
The precision of the method was assessed through five replicated analyses. The relative standard deviations (RSDs) for thymol and carvacrol are presented in Table 2. Five replicated measurements were conducted to determine both the within-day (RSD less than 3.4) and between-day (RSD less than 5.4) precisions, based on the average of the repeated measurements each day. The average RSD for the within-day determination of thymol was 2.7, and for carvacrol, it was 2.6, as presented in Table 2. A typical chromatogram under optimum conditions is presented in Figure 9.
Table 2.
Within-day and between-day precisions (n = 5) obtained for different concentrations of thymol and carvacrol.
| Precision | Analyte | Concentration (mg L−1) |
RSD% |
|---|---|---|---|
| Within-day | Thymol | 5.0 | 3.2 |
| 10.0 | 2.3 | ||
| 50.0 | 2.5 | ||
| Carvacrol | 5.0 | 3.4 | |
| 10.0 | 2.7 | ||
| 50.0 | 1.8 | ||
| Between-day | Thymol | 5.0 | 5.1 |
| 10.0 | 4.2 | ||
| 50.0 | 1.8 | ||
| Carvacrol | 5.0 | 5.4 | |
| 10.0 | 2.6 | ||
| 50.0 | 2.1 |
Figure 9.
Chromatograph for the determination of thymol and carvacrol. Conditions: extractant solvent: 1-undecanol (20.0 µL); disperser solvent = acetone (0.50 mL); pH 7.0; %NaCl = 7.0%; ultrasound duration time = 10.0 min; centrifuging duration time = 7.5 min.
2.3. Enrichment Factor and Extraction Recovery
The enrichment factor (EF) is defined as the ratio of the analyte concentration in the extraction phase (CO) to the initial concentration of the analyte in the source phase, typically an aqueous sample (CW) [40]:
| (1) |
The extraction recovery (ER) is defined as the percentage of the amount of analyte extracted in the organic phase (VO mL) from the aqueous sample (VW mL), and it is calculated according to the following equation [32]:
| (2) |
The calculated EF of 138.1 for thymol and 136.6 for carvacrol, along with the ER% of 55.2 for thymol and 54.6 for carvacrol, are presented in Table 3.
Table 3.
Enrichment factor (EF) and extraction recovery (ER%).
| Analyte | CW a (mg L−1) | VW b (µL) | CO c (mg L−1) | VO d (µL) | EF | ER% |
|---|---|---|---|---|---|---|
| Thymol | 5 | 5000 | 690.4 | 20 | 138.1 | 5.2 |
| Carvacrol | 5 | 5000 | 683.1 | 20 | 136.6 | 54.6 |
a Initial concentration of analyte in the aqueous phase. b Aqueous phase volume. c Analyte concentration in organic solvent (extraction phase). d Organic solvent volume.
2.4. Robustness
Robustness evaluates the ability of an analytical method to withstand the small changes (within 5%) in practical effective parameters that may vary (directional changes) during operation [42]. In fact, these small variations in the effective parameters can impact the measurement results and should be assessed during method validation. The reliability of the analysis can be evaluated through robustness testing, which measures the method’s ability to remain unaffected by minor changes to the effective method parameters.
To evaluate the robustness, small variations in the effective parameters were introduced, including the pH, %NaCl, extraction and disperser solvent volumes given in Table 4, and the resulting quantitative influences were determined. The results, as shown in Table 4, indicated that the presence of negligible variation in the analytical signal, despite the instability of the effective parameters, demonstrates the method’s robustness.
Table 4.
Evaluating the robustness of the method at three different experimental condition levels for two different concentrations of thymol and carvacrol.
| Experimental Conditions | Analyte | Picked (mg L−1) |
Found ± SD (mg L−1) |
Accuracy (RE) a | Recovery% (n = 3) |
|---|---|---|---|---|---|
| A | Thymol | 5.0 50.0 5.0 50.0 |
4.8 ± 0.14 49.3 ± 0.32 4.7 ± 0.05 50.5 ± 0.51 |
−0.040 −0.014 −0.060 +0.010 |
96.0 98.6 94.0 101.0 |
| Carvacrol | |||||
| B | Thymol | 5.0 50.0 5.0 50.0 |
4.5 ± 0.13 50.4 ± 0.42 4.3 ± 0.81 48.8 ± 0.22 |
−0.10 +0.032 −0.140 −0.024 |
90.0 100.8 86.0 97.6 |
| Carvacrol | |||||
| C | Thymol | 5.0 50.0 5.0 50.0 |
5.1 ± 0.16 49.2 ± 0.22 4.6 ± 0.34 49.0 ± 0.47 |
+0.060 −0.016 −0.080 −0.020 |
102.0 98.4 92.0 98.0 |
| Carvacrol |
A. pH 7.0, %NaCl: 7.0, extraction solvent: 20.0 µL, disperser solvent: 0.50 mL. B. pH 7.3, %NaCl: 7.3, extraction solvent: 21.0 µL, disperser solvent: 0.52 mL. C. pH 6.7, %NaCl: 6.7, extraction solvent: 19.0 µL, disperser solvent: 0.48 mL. a
2.5. Analytical Approaches for Determination of Thymol and Carvacrol
Compared to other methods, the presented technique is notable for its speed, simplicity, low cost, and efficiency, as it consumes minimal solvents and ensures the essential oil extraction safety.
The use of low-density and low-melting-point organic solvents, such as 1-undecanol, as the extraction solvent enables the easy collection of the extraction micro droplets by solidification, thereby facilitating phase transfer. Additionally, the use of a low-toxicity extraction solvent makes this technique environmentally friendly. The USA-DLLME-SFO method exhibits excellent clean-up capabilities and effectively eliminates matrix effects. It demonstrates good precision, selectivity, stability, and robustness, making it suitable for routine monitoring of thymol and carvacrol.
The comparison of these findings with those of previous works listed in Table 5 highlights the environmental friendliness and acceptable analytical figures of merit of the developed technique for the determination of these oils.
Table 5.
Characteristics of some methods reported for the determination of thymol and carvacrol in the literature to be compared with the developed technique.
| Method | Solvent | Analyte | LOD (mg mL−1) |
R2 | Linear Range (mg mL−1) |
tR g (min) | RSD h % | Recovery % |
Ref |
|---|---|---|---|---|---|---|---|---|---|
| HD-HSME-GC-FID a | Tetradecane, Pentadecane, Hexadecane, Heptadecane |
Thymol | 1.9 × 10⁻³ | 0.9944 | 6.2 × 10⁻³–8.1 × 10⁻² | <20 | 6.4 | 89–101 | [4] |
| Carvacrol | 2.3 × 10⁻⁴ | 0.9979 | 1.2 × 10⁻³–8.8 × 10⁻² | <20 | 11.4 | 95–116 | |||
| UAME-NMSPD-HPLC b | Acetonitrile Methanol |
Thymol | 2.3 × 10⁻⁷ | 0.9995 | 0.5 × 10⁻⁵–2.0 × 10⁻³ | - | 2.1–4.8 | 95–99 | [16] |
| Carvacrol | 2.1 × 10⁻⁷ | 0.9993 | 0.5 × 10⁻⁵–2.0 × 10⁻³ | - | 2.7–4.9 | 94–98 | |||
| HS-SPME-GC-MS c | Methanol | Thymol | 8.9 × 10⁻⁷ | 0.9994 | 2.0 × 10⁻⁶–4.0 × 10⁻⁴ | <7 | 2.2–11.3 | - | [42] |
| Carvacrol | 5.7 × 10⁻⁷ | 0.9997 | 2.0 × 10⁻⁶–4.0 × 10⁻⁴ | <7 | 0.8–9.8 | - | |||
| VASE-DLLME- HPLC d | Chloroform Acetonitrile |
Thymol | 1.6 × 10⁻⁶ | 0.9998 | 0.5 × 10⁻⁵–4.0 × 10⁻³ | <14 | 1.0–4.8 | 97 | [11] |
| Carvacrol | 1.6 × 10⁻⁶ | 0.9998 | 0.5 × 10⁻⁵–4.0 × 10⁻³ | <14 | 1.0–4.8 | 97 | |||
| MMIP-DSPME- HPLC e | Acetonitrile | Thymol | (0.4–1.0) × 10−5 | 0.999 | 0.4 × 10⁻⁶–5.0 × 10⁻² | <7 | 1.0–4.9 | 97–104 | [15] |
| Carvacrol | (0.4–1.0) × 10−5 | 0.999 | 0.4 × 10⁻⁶–5.0 × 10⁻² | <7 | 1.7–6.3 | 97–105 | |||
| DLLME-SFO-GC-FID f | Undecanol | Thymol | 9.5 × 10⁻⁴ | 0.9939 | (0.3–7.0) × 10−2 | 14.9 | 2.7 | 96–98 | [This work] |
| Carvacrol | 8.9 × 10⁻⁴ | 0.9995 | (0.3–7.0) × 10−2 | 15.2 | 2.6 | 94–101 |
a Hydro distillation-headspace solvent microextraction gas chromatography-flame ionization detector. b Ultrasound-assisted microextraction-nano material solid phase dispersion high-performance liquid chromatography. c Headspace solid-phase microextraction gas chromatography-mass spectrometry. d Vortex-assisted surfactant-enhanced dispersive liquid–liquid microextraction high-performance liquid chromatography. e Nano-sized magnetic molecularly imprinted polymer-dispersive solid phase microextraction-high performance liquid chromatography. f Ultrasound-assisted dispersive liquid–liquid microextraction by solidifying floating organic droplets gas chromatography-flame ionization detector. g Retention time. h Relative standard deviation.
3. Materials and Methods
3.1. Reagents
The thymol and carvacrol standards, catechol (1, 2-dihydroxy benzene), sodium chloride, acetone, tetrahydrofuran (THF), methanol (MeOH), ethanol (EtOH), acetonitrile (ACN), citric acid, phosphoric acid, hydrochloric acid, boric acid and 1-undecanol (>99%, w/w) were purchased from Merck Chemicals Company (Darmstadt, Germany). The sodium hydroxide was bought from KANTO Chemical Company (Tokyo, Japan), and the acetic acid was obtained from Panreac Quimica SA (Barcelona, Spain). All the experiments were performed using deionized water. The thymol and carvacrol stock solutions were individually prepared by dissolving 5.0 mg thymol, 5.2 µL carvacrol in ethanol in a 5.0 mL volumetric flask, and 75.0 mg catechol (as internal standard) in water in a 100.0 mL volumetric flask, and they were stored in a refrigerator. Different binary standard solutions were prepared from these stock solutions. A carefully measured quantity of the internal standard substance was introduced into each standard and sample solution.
3.2. Apparatus
The GC analysis was performed by using an Agilent gas chromatograph model 7890A (Santa Clara, CA, USA) equipped with an HP-1 methyl siloxane column (30 m in length × 250 µm × 0.25 μm) equipped with the FID. A digital ultrasound cleaner, trademark: Codyson (Shenzhen, China), model: CD-4820 was used.
3.3. GC Analysis Condition
Nitrogen was used as the carrier gas at a constant flow rate of 0.7 mL min−1. The oven temperature was increased from 45 to 120 °C at a rate of 6 °C min−1 and held for 5 min, then raised to 260 °C at a rate of 50 °C min−1 and then held for 5 min. The temperatures of the injection and detection systems (FID) were 240 and 280 °C, respectively. A sample volume of 0.2 µL was injected and the split ratio was 1:10.
3.4. Sample Preparation
Each sample was prepared by pouring 2.21 mL of distilled water, 20.0 µL of thymol in ethanol solution, 20.0 µL of carvacrol in ethanol solution, 1.0 mL of catechol in ethanol solution, and 1.75 mL of NaCl (final concentration 7.0% w/v) into a sample tube. The sample was then neutralized to pH 7.0 by adding 1.0 M NaOH. A mixture of 0.50 mL acetone and 20.0 µL 1-undecanol was dispersed in the solution using a syringe. Each sample was subsequently placed in an ultrasound bath for 10.0 min and then centrifuged for 7.5 min (800 rpm). The sample tube was refrigerated because undecanol has a melting point of 11 to 14 °C; thus, it could solidify rapidly compared to water and separate from the aqueous phase. The organic phase was now ready to be injected into the GC.
4. Conclusions
USA-DLLME-SFO and GC-FID were coupled for the extraction and determination of essential oils, marking the first time such a method has been employed. Ultrasonic-assisted extraction was leveraged to effectively extract the essential oils under moderate conditions (room temperature and atmospheric pressure) in a brief period.
The combination of the technique with GC-FID has proven to be an efficient and economical approach for the analysis of thymol and carvacrol. Moreover, the main advantage of the developed method lies in its simplicity and low cost, rendering it suitable for routine applications in biomedical analysis laboratories.
Acknowledgments
We would like to acknowledge the Welch Foundation for their generous support through grant number BT 0041. This funding has been instrumental in advancing our research and enabling us to achieve significant progress. The authors wish to acknowledge the support for this work by the Shiraz University Research Council.
Author Contributions
Conceptualization: S.B. and B.K.; formal analysis: S.B. and M.R.; investigation: S.B. and M.F.; methodology: S.B.; supervision: B.K. and G.A.; writing—original draft: S.B. and M.F.; review and editing: G.A., B.K. and M.R. All authors have read and agreed to the published version of the manuscript.
Institutional Review Board Statement
Not applicable.
Informed Consent Statement
Not applicable.
Data Availability Statement
The original contributions presented in this study are included in the article; further inquiries can be directed to the corresponding author.
Conflicts of Interest
The authors declare no conflicts of interest.
Funding Statement
This research was partly funded by WELCH foundation grant number BT 0041.
Footnotes
Disclaimer/Publisher’s Note: The statements, opinions and data contained in all publications are solely those of the individual author(s) and contributor(s) and not of MDPI and/or the editor(s). MDPI and/or the editor(s) disclaim responsibility for any injury to people or property resulting from any ideas, methods, instructions or products referred to in the content.
References
- 1.Gholami-Ahangaran M., Ahmadi-Dastgerdi A., Azizi S., Basiratpour A., Zokaei M., Derakhshan M. Thymol and carvacrol supplementation in poultry health and performance. Vet. Med. Sci. 2022;8:267–288. doi: 10.1002/vms3.663. [DOI] [PMC free article] [PubMed] [Google Scholar]
- 2.Rivas L., McDonnell M.J., Burgess C.M., O’Brien M., Navarro-Villa A., Fanning S., Duffy G. Inhibition of verocytotoxigenic Escherichia coli in model broth and rumen systems by carvacrol and thymol. Int. J. Food Microbiol. 2010;139:70–78. doi: 10.1016/j.ijfoodmicro.2010.01.029. [DOI] [PubMed] [Google Scholar]
- 3.Bagamboula C.F., Uyttendaele M., Debevere J. Inhibitory effect of thyme and basil essential oils, carvacrol, thymol, estragol, linalool and p-cymene towards Shigella sonnei and S. flexneri. Food Microbiol. 2004;21:33–42. doi: 10.1016/S0740-0020(03)00046-7. [DOI] [Google Scholar]
- 4.Kiyanpour V., Fakhari A.R., Alizadeh R., Asghari B., Jalali-Heravi M. Multivariate optimization of hydrodistillation-headspace solvent microextraction of thymol and carvacrol from Thymus transcaspicus. Talanta. 2009;79:695–699. doi: 10.1016/j.talanta.2009.04.068. [DOI] [PubMed] [Google Scholar]
- 5.Salehi B., Mishra A.P., Shukla I., Sharifi-Rad M., Contreras M.D.M., Segura-Carretero A., Fathi H., Nasrabadi N.N., Kobarfard F., Sharifi-Rad J. Thymol, thyme, and other plant sources: Health and potential uses. Phytother. Res. 2018;32:1688–1706. doi: 10.1002/ptr.6109. [DOI] [PubMed] [Google Scholar]
- 6.Sereshti H., Izadmanesh Y., Samadi S. Optimized ultrasonic assisted extraction-dispersive liquid-liquid microextraction coupled with gas chromatography for determination of essential oil of Oliveria decumbens vent. J. Chromatogr. A. 2011;1218:4593–4598. doi: 10.1016/j.chroma.2011.05.037. [DOI] [PubMed] [Google Scholar]
- 7.Du W.X., Olsen C.W., Avena-Bustillos R.J., McHugh T.H., Levin C.E., Friedman M. Storage stability and antibacterial activity against Escherichia coli O157:H7 of carvacrol in edible apple films made by two different casting methods. J. Agric. Food Chem. 2008;56:3082–3088. doi: 10.1021/jf703629s. [DOI] [PubMed] [Google Scholar]
- 8.Bazylko A., Strzelecka H. Quantitative determination of phenol derivatives from Oleum thymi. Chromatographia. 2000;52:112–114. doi: 10.1007/BF02490803. [DOI] [Google Scholar]
- 9.Cacho J.I., Campillo N., Viñas P., Hernández-Córdoba M. Evaluation of three headspace sorptive extraction coatings for the determination of volatile terpenes in honey using gas chromatography-mass spectrometry. J. Chromatogr. A. 2015;1399:18–24. doi: 10.1016/j.chroma.2015.04.041. [DOI] [PubMed] [Google Scholar]
- 10.Daneshfar A., Tabaraki R., Khodakarami R., Khezeli T. Determination of phenol and carvacrol in honey samples using dispersive liquid–liquid microextraction and experimental design for optimization. Anal. Bioanal. Chem. Res. 2016;3:41–51. [Google Scholar]
- 11.Ghaedi M., Roosta M., Khodadoust S., Daneshfar A. Application of optimized vortex-assisted surfactant-enhanced DLLME for preconcentration of thymol and carvacrol, and their determination by HPLC-UV: Response surface methodology. J. Chromatogr. Sci. 2015;53:1222–1231. doi: 10.1093/chromsci/bmu216. [DOI] [PubMed] [Google Scholar]
- 12.Ghiasvand A., Dowlatshah S., Nouraei N., Heidari N., Yazdankhah F. A solid-phase microextraction platinized stainless steel fiber coated with a multiwalled carbon nanotube-polyaniline nanocomposite film for the extraction of thymol and carvacrol in medicinal plants and honey. J. Chromatogr. A. 2015;1406:87–93. doi: 10.1016/j.chroma.2015.06.052. [DOI] [PubMed] [Google Scholar]
- 13.Ghobadloo P.A., Hamidi S., Nemati M., Jahed F.S. Ultrasound assisted dispersive solid phase microextraction of thymol and carvacrol in pharmaceutical products using graphene oxide as an adsorbent prior to analysis by high performance liquid chromatography. Curr. Pharm. Anal. 2020;16:578–584. doi: 10.2174/1573412915666190220102628. [DOI] [Google Scholar]
- 14.Hajimehdipoor H., Shekarchi M., Khanavi M., Adib N., Amri M. A validated high performance liquid chromatography method for the analysis of thymol and carvacrol in Thymus vulgaris L. volatile oil. Pharmacogn. Mag. 2010;6:154–158. doi: 10.4103/0973-1296.59961. [DOI] [PMC free article] [PubMed] [Google Scholar]
- 15.Kasiri E., Haddadi H., Javadian H., Asfaram A. Highly effective pre-concentration of thymol and carvacrol using nano-sized magnetic molecularly imprinted polymer based on experimental design optimization and their trace determination in summer savoury, Origanum majorana and Origanum vulgare extracts. J. Chromatogr. B. 2021;1182:122941. doi: 10.1016/j.jchromb.2021.122941. [DOI] [PubMed] [Google Scholar]
- 16.Roosta M., Ghaedi M., Daneshfar A., Sahraei R. Ultrasound assisted microextraction-nano material solid phase dispersion for extraction and determination of thymol and carvacrol in pharmaceutical samples: Experimental design methodology. J. Chromatogr. B. 2015;975:34–39. doi: 10.1016/j.jchromb.2014.10.035. [DOI] [PubMed] [Google Scholar]
- 17.Viñas P., Soler-Romera M.J., Hernández-Córdoba M. Liquid chromatographic determination of phenol, thymol and carvacrol in honey using fluorimetric detection. Talanta. 2006;69:1063–1067. doi: 10.1016/j.talanta.2005.12.030. [DOI] [PubMed] [Google Scholar]
- 18.Adamczyk S., Lázaro R., Pérez-Arquillué C., Conchello P., Herrera A. Evaluation of Residues of Essential Oil Components in Honey after Different Anti-Varroa Treatments. J. Agric. Food Chem. 2005;53:10085–10090. doi: 10.1021/jf051813f. [DOI] [PubMed] [Google Scholar]
- 19.Nozal M.J., Bernal J.L., Jiménez J.J., González M.J., Higes M. Extraction of thymol, eucalyptol, menthol, and camphor residues from honey and beeswax: Determination by gas chromatography with flame ionization detection. J. Chromatogr. A. 2002;954:207–215. doi: 10.1016/S0021-9673(02)00153-X. [DOI] [PubMed] [Google Scholar]
- 20.Tsigouri A., Passaloglou-Katrali M., Sabatakou O. Determination of eucalyptol camphor menthol and thymol in Greek thyme honey by GC-FID. Acta Aliment. 2008;37:181–189. doi: 10.1556/AAlim.2007.0032. [DOI] [Google Scholar]
- 21.Ares A.M., Nozal M.J., Bernal J.L., Bernal J. Simultaneous determination of carvacrol and thymol in bee pollen by using a simple and efficient solvent extraction method and gas chromatography-mass spectrometry. J. Pharm. Biomed. Anal. 2020;181:113124. doi: 10.1016/j.jpba.2020.113124. [DOI] [PubMed] [Google Scholar]
- 22.Bernal J., Nozal M.J., Bernal J.L., Ares A.M. Determination of Carvacrol and Thymol in Honey by Using a Simple and Efficient Headspace-Gas Chromatography-Mass Spectrometry Method. Food Anal. Methods. 2020;13:2138–2146. doi: 10.1007/s12161-020-01833-0. [DOI] [PubMed] [Google Scholar]
- 23.Nerín C. Focus on sample handling. Anal. Bioanal. Chem. 2007;388:1001–1002. doi: 10.1007/s00216-007-1340-x. [DOI] [PubMed] [Google Scholar]
- 24.Tang S., Qi T., Ansah P.D., Fouemina J.C.N., Shen W., Basheer C., Lee H.K. Single-drop microextraction. TrAC Trends Anal. Chem. 2018;108:306–313. doi: 10.1016/j.trac.2018.09.016. [DOI] [Google Scholar]
- 25.Li X., Li H., Ma W., Guo Z., Li X., Li X., Zhang Q. Determination of patulin in apple juice by single-drop liquid-liquid-liquid microextraction coupled with liquid chromatography-mass spectrometry. Food Chem. 2018;257:1–6. doi: 10.1016/j.foodchem.2018.02.077. [DOI] [PubMed] [Google Scholar]
- 26.Jain R., Singh R. Applications of dispersive liquid–liquid micro-extraction in forensic toxicology. TrAC Trends Anal. Chem. 2016;75:227–237. doi: 10.1016/j.trac.2015.07.007. [DOI] [Google Scholar]
- 27.Wang Y., Miao X., Wei H., Liu D., Xia G., Yang X. Dispersive Liquid-Liquid Microextraction Combined with Gas Chromatography-Mass Spectrometry for the Determination of Multiple Pesticides in Celery. Food Anal. Methods. 2016;9:2133–2141. doi: 10.1007/s12161-015-0390-5. [DOI] [Google Scholar]
- 28.Rezaee M., Assadi Y., Milani Hosseini M.R., Aghaee E., Ahmadi F., Berijani S. Determination of organic compounds in water using dispersive liquid-liquid microextraction. J. Chromatogr. A. 2006;1116:1–9. doi: 10.1016/j.chroma.2006.03.007. [DOI] [PubMed] [Google Scholar]
- 29.Mansour F.R., Danielson N.D. Solidification of floating organic droplet in dispersive liquid-liquid microextraction as a green analytical tool. Talanta. 2017;170:22–35. doi: 10.1016/j.talanta.2017.03.084. [DOI] [PubMed] [Google Scholar]
- 30.Mousavi L., Tamiji Z., Khoshayand M.R. Applications and opportunities of experimental design for the dispersive liquid–liquid microextraction method. Talanta. 2018;190:335–356. doi: 10.1016/j.talanta.2018.08.002. [DOI] [PubMed] [Google Scholar]
- 31.Šandrejová J., Campillo N., Viñas P., Andruch V. Classification and terminology in dispersive liquid-liquid microextraction. Microchem. J. 2016;127:184–186. doi: 10.1016/j.microc.2016.03.007. [DOI] [Google Scholar]
- 32.Leong M.I., Huang S.D. Dispersive liquid-liquid microextraction method based on solidification of floating organic drop combined with gas chromatography with electron-capture or mass spectrometry detection. J. Chromatogr. A. 2008;1211:8–12. doi: 10.1016/j.chroma.2008.09.111. [DOI] [PubMed] [Google Scholar]
- 33.Albero B., Tadeo J.L., Pérez R.A. Ultrasound-assisted extraction of organic contaminants. TrAC Trends Anal. Chem. 2019;118:739–750. doi: 10.1016/j.trac.2019.07.007. [DOI] [Google Scholar]
- 34.Rahimi Moghadam M., Zargar B., Rastegarzadeh S. Determination of Tetracycline Using Ultrasound-Assisted Dispersive Liquid-Liquid Microextraction Based on Solidification of Floating Organic Droplet Followed by HPLC-UV System. J. AOAC Int. 2021;104:999–1004. doi: 10.1093/jaoacint/qsab044. [DOI] [PubMed] [Google Scholar]
- 35.Hou X., Zheng X., Zhang C., Ma X., Ling Q., Zhao L. Ultrasound-assisted dispersive liquid-liquid microextraction based on the solidification of a floating organic droplet followed by gas chromatography for the determination of eight pyrethroid pesticides in tea samples. J. Chromatogr. B. 2014;969:123–127. doi: 10.1016/j.jchromb.2014.08.010. [DOI] [PubMed] [Google Scholar]
- 36.Delgado-Povedano M.M., Luque de Castro M.D. Ultrasound-assisted analytical emulsification-extraction. TrAC Trends Anal. Chem. 2013;45:1–13. doi: 10.1016/j.trac.2012.12.011. [DOI] [Google Scholar]
- 37.Li Y., Peng G., He Q., Zhu H., Al-Hamadani S.M. Dispersive liquid–liquid microextraction based on the solidification of floating organic drop followed by ICP-MS for the simultaneous determination of heavy metals in wastewaters. Spectrochim. Acta A. Mol. Biomol. Spectrosc. 2015;140:156–161. doi: 10.1016/j.saa.2014.12.091. [DOI] [PubMed] [Google Scholar]
- 38.Nathional Library of Medicine, National Center for Biotechnology Information. [(accessed on 15 June 2024)]; Available online: https://pubchem.ncbi.nlm.nih.gov/
- 39.Libre Texts Chemistry, Acidity of Phenols. [(accessed on 15 June 2024)]. Available online: https://chem.libretexts.org/@go/page/732.
- 40.Zamani-Kalajahi M., Fazeli-Bakhtiyari R., Amiri M., Basiratpour A., Zokaei M., Derakhshan M. Dispersive liquid–liquid microextraction based on solidification of floating organic droplet followed by spectrofluorimetry for determination of carvedilol in human plasma. Bioanalysis. 2013;5:437–448. doi: 10.4155/bio.12.326. [DOI] [PubMed] [Google Scholar]
- 41.Tavallali H., Fakhraee V. Preconcentration and determination of trace amounts of Cd2+ using multiwalled carbon nanotubes by solid phase extraction-flame atomic absorption spectrometry. Int. J. Chemtech. Res. 2011;3:1628–1634. [Google Scholar]
- 42.Fernandez M.E., Palacio M.A., Labaque M.C. Thymol detection and quantitation by solid-phase microextraction in faeces and egg yolk of Japanese quail. J. Chromatogr. B. 2017;1044:39–46. doi: 10.1016/j.jchromb.2016.12.042. [DOI] [PubMed] [Google Scholar]
Associated Data
This section collects any data citations, data availability statements, or supplementary materials included in this article.
Data Availability Statement
The original contributions presented in this study are included in the article; further inquiries can be directed to the corresponding author.


