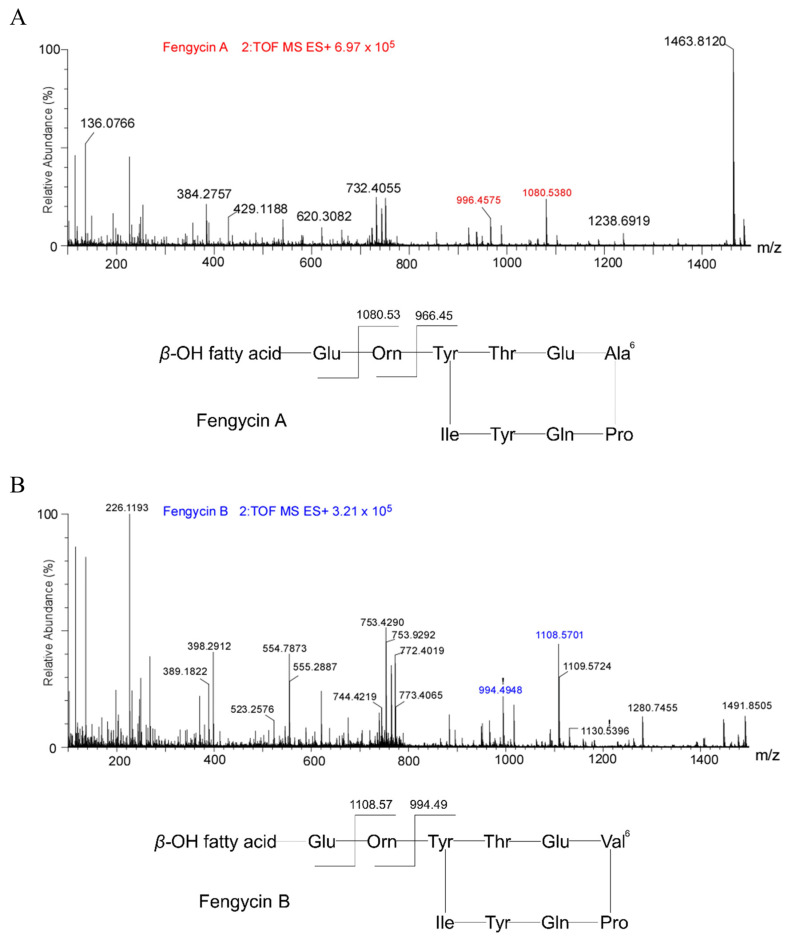
Figure 4.
MS/MS analysis of fengycin. (A) MS/MS spectra of the peak at m/z of 1463.8120 fengycin produced by B. velezensis Y6 and possible basic structures of Fengycin A; (B) MS/MS spectra of the peak at m/z of 1491.8505 fengycin produced by B. velezensis Y6 and possible basic structures of Fengycin B.

