

Abstract
Purpose
To analyze the role of qualitative and quantitative 3 T MR imaging assessment as a non-invasive method for the evaluation of disease severity in patients with primary sclerosing cholangitis (PSC).
Methods
A series of 26 patients, with histological diagnosis of PSC undergoing 3 T MRI and hepatological evaluation, was retrospectively enrolled. All MR examinations included diffusion-weighted imaging (DWI), T2-weighted (T2w) and T1-weighted (T1w) sequences, before and after administration of Gd-EOB-DTPA with the acquisition of both dynamic and hepato-biliary phase (HBP). Qualitative analysis was performed by assessment of liver parenchyma and biliary tract changes, also including biliary excretion of gadoxetic acid on HBP. Quantitative evaluation was conducted on liver parenchyma by measurement of apparent diffusion coefficient (ADC) and relative enhancement (RE) on 3-minute delayed phase and on HBP. Results of blood tests (ALT, ALP, GGT, total and direct bilirubin, albumin, and platelets) and transient elastography-derived liver stiffness measurements (TE-LSM) were collected and correlated with qualitative and quantitative MRI findings.
Results
Among qualitative and quantitative findings, fibrosis visual assessment and RE had the best performance in estimating disease severity, showing a statistically significant correlation with both biomarkers of cholestasis and TE-LSM. Statistical analysis also revealed a significant correlation of gadoxetic acid biliary excretion with ALT and direct bilirubin, as well as of ADC with total bilirubin.
Conclusion
Qualitative and quantitative 3 T MR evaluation is a promising non-invasive method for the assessment of disease severity in patients with PSC.
Keywords: Primary sclerosing cholangitis, Disease severity, Magnetic resonance imaging, Gadoxetic acid, Diffusion-weighted imaging, Relative enhancement
Highlights
-
•
MR imaging is of utmost importance in diagnosing the severity of PSC.
-
•
Progression may be identified by accurate MRI/MRCP qualitative and quantitative analysis in PSC patients.
-
•
The clinical-radiological approach could allow a better characterization of disease profile and prognosis.
1. Introduction
Primary sclerosing cholangitis (PSC) is a rare, idiopathic, cholestatic liver disease characterized by chronic inflammation and fibrosis of the intra- and extrahepatic bile ducts, leading to biliary cirrhosis and eventually hepatic failure [1], [2]. Despite its rarity, PSC is the fifth most common indication for liver transplantation in the USA and a leading indication in several other countries, likely because effective medical therapies are lacking [2], [3], [4], [5], [6], [7].
PSC is usually diagnosed by means of clinical, biochemical and cholangiographic findings, using magnetic resonance cholangiopancreatography (MRCP) [8], [9], [10]. Magnetic Resonance Imaging (MRI) is indicated by all major societies as the elective diagnostic procedure in patients with suspected PSC[9], [11], [12], replacing endoscopic retrograde cholangiopancreatography (ERCP) in view of its non-invasiveness [13]. To assess disease severity, histopathological examination was referred as a reliable method [14], [15]; however, liver biopsy is an invasive procedure not recommended in PSC patients [9]. Therefore, there is a growing interest in non-invasive tools for prognostic stratification of the patients, and liver stiffness (LS), measured by transient elastography (TE-LSM), has been shown to have a high diagnostic performance for detection of liver fibrosis and cirrhosis in chronic liver disease [18], [19], [20], [21]. Consistently, TE-LSM has been found to correlate with the degree of liver fibrosis in PSC patients also[22], [23].
In the field of MRI investigations, Ruiz et al. [24] evaluated qualitative variables and proposed two scores for disease progression (ANALI score), based on bile duct and liver parenchymal changes. MR elastography (MRE) proved highly accurate for fibrosis quantification analyzing liver LS; however, such technique is not widely available in daily practice [16], [17], [25], [26], [27]. Other studies investigated the usefulness of diffusion-weighted imaging (DWI) in detecting and staging liver fibrosis, with contradictory results [28], [29], [30]. In addition, gadolinium-based contrast agent (GBCA)-enhanced MRI using extracellular or hepatocyte-specific GBCA [31], [32] and dynamic contrast-enhanced (DCE) MRI have been proposed to assess hepatic function impairment [33]. Nolz et al. [34] emphasized the role of a simple quantitative method for functional assessment of liver parenchyma after administration of gadoxetic acid [GE]: the relative enhancement (RE) of signal intensity (SI) during the hepatobiliary phase, as compared to the unenhanced phase. Interestingly, RE showed a significant reduction in areas where liver parenchyma was more injured. Subsequently, several authors analyzed the role of RE in staging fibrosis and liver function [35], [36].
MRI represents the gold standard in diagnosing and staging the severity of PSC [37]; however, the correlation between specific MRI findings and liver function tests (LFT) and/or LS has not been fully investigated.
Our study was aimed to analyze how qualitative (morphologic and functional) and quantitative (ADC and RE) 3 T MRI evaluations correlate with the biomarkers of disease activity and fibrosis used by the hepatologists for clinical characterization of PSC patients [38].
2. Materials and methods
Ethical approval was waived by the local Ethics Committee of our hospital in view of the retrospective nature of the study and all the procedures being performed were part of the routine care. Before MR examinations, all patients provided written informed consent to the processing of personal data even for study purposes.
2.1. Study design
We retrospectively identified 26 patients (20 males; 6 females) with diagnosis of PSC, who underwent hepatological evaluation and 3 T MR examination at our Institution. Patients had a mean age of 53.5 years (±13.5) at time of MRI acquisition, with an average time of 10.7 years (±6.9) from the clinical onset of disease to the MR examinations. A liver biopsy confirming PSC diagnosis was performed in 19/26 patients (73.1 %) between the onset of the disease and the MRI assessment.
All patients underwent MRI with a protocol including DWI, Gd-EOB-DTPA-enhanced images, and MRCP. Patients previously undergoing liver transplantation were excluded.
2.2. MRI technique
MR examinations were performed at 3 T device (GE DISCOVERY MR750; GE Healthcare; Milwaukee, Wisconsin, USA) with an eight-channel phased array body coil. After the acquisition of T1w and T2w sequences with and without fat-suppression in the axial and coronal plane (FRFSE- Propeller T2w, single-shot fast spin echo T2w and spoiled gradient-echo Dual Echo T1w), conventional MRCP was performed through breath-hold, thick slab, single-shot T2w sequences and through a respiratory triggered, thin slab, three-dimensional, heavily T2w fast spin echo sequence. Axial DWI was acquired through the entire liver using a single-shot spin-echo planar sequence (SE-EPI) with multiple b values (0, 150, 500, 1000, 1500 sec/mm2), parallel imaging technique and with diffusion-weighted gradients applied in all the three orthogonal directions. A three-dimensional fat-suppressed LAVA (Liver Acquisition with Volumetric Acceleration) Flex T1 sequence was performed before and after intravenous administration of Gd-EOB-DTPA (Primovist®, Bayer Schering Pharma) at a dosage of 0.1 ml/Kg of body weight and a flow rate of 2 ml/s, followed by injection of 25 ml of isotonic saline solution. Dynamic (arterial, portal-venous and delayed) and hepatobiliary (between 20 and 60 minutes) phases were acquired in the axial and coronal plane. Sequences parameters of our MR imaging protocol are summarized in Table 1.
Table 1.
Sequences parameters of our MR imaging protocol.
| Sequence | TR (ms) | TE (ms) | FA (D°) | multiple b-values | Bandwidth (Hz/pixel) | Acceleration(Phase/Slice) | Slice Thickness / Spacing | BH/RTr* |
|---|---|---|---|---|---|---|---|---|
| 2D-Axial and Coronal SS-FSE T2w |
1600 | 95 | 90 | 62.50 | 2/1 | 5/0 | BH | |
| 2D-Axial FRFSE-Propeller T2w |
3500–6000 | 65–90 | 110 | 36* | 2/1 | 5/0 | RTr | |
| 2D-Axial SPGR-Dual Echo T1w |
150 | TE1=1.3 TE2=2.5 |
50 | 166.7 | 2/1 | 5/0 | BH | |
| 3D-MRCP FRFSE T2w |
3000–5000 | 600–700 | 90 | 83.33 | 2/1 | 2.4/−1.2 | RTr | |
| 2D-MRCP SSFSE T2w |
4000–5000 | 600–700 | 90 | 62.50 | 2/1 | 10–60/0 | BH | |
| 2D-Axial SE-EPI Diffusion T2w |
4500–7000 | Minimum | 90 | 0 150 500 1000 1500 |
250 | 2/1 | 5/0 | RTr |
| 3D axial LAVA Flex T1w |
4.3 | TE1=1.3 TE2=2.6 |
12 | 166.7 | 2/1 | 3/−1.5 | BH |
TR, repetition time; TE, echo time; FA flip angle; BH breath holding; RTr Respiratory Trigger; * Effect Bandwith
2.3. Image analysis
Two radiologists in consensus performed both qualitative and quantitative analysis of each MR examination. With respect to the qualitative analysis, all images were assessed using our departmental PACS system (Esaote-Fuji), whereas quantitative analysis was performed on a dedicated workstation (Advantage Windows Volume Share 4.7; GE Healthcare, Milwaukee, Wisconsin, USA).
2.4. Qualitative analysis
In accordance with the study of Ruiz et al. [24], the biliary tree was split into four portions, listed below (with their normal values):
-
•
common bile duct, CBD (NV≤10 mm);
-
•
right hepatic duct, RHD (NV≤6 mm);
-
•
left hepatic duct, LHD (NV≤6 mm);
-
•
intrahepatic bile ducts, HBDs (NV ≤ 3 mm).
The LHD, RHD and CBD were considered extrahepatic portions.
The following items were evaluated for biliary tree:
-
1)
presence and location of bile duct dilatations;
-
2)
presence of intrahepatic bile duct cystic appearance (intrahepatic bile duct ≥ 5 mm) [24];
-
3)
presence and location of bile duct strictures. Bile duct strictures were considered non-significant or significant, depending on the presence or absence, in the stenotic bile ducts, of gadoxetic acid excretion on HBP, 20 minutes after intravenous administration of the contrast agent [34];
-
4)
presence of pruned tree appearance;
-
5)
presence and location of hepatolithiasis;
-
6)
gadoxetic acid excretion in common bile duct on HBP, 20 minutes after intravenous administration of the contrast agent. Three grades of gadoxetic acid excretion were established: grade 0=complete excretion in common bile duct; grade 1=partial excretion; grade 2=absence of excretion.
The following items were evaluated for liver parenchyma:
-
1)
presence of cirrhosis;
-
2)
presence of liver fibrosis analyzed by visual assessment on T2w sequences and on T1w images after administration of Gd-EOB-DTPA. Three grades of fibrosis were established, depending on number of areas involved (grade 1=1 area; grade 2=2–3 areas; grade 3=diffuse involvement);
-
3)
modified caudate/right lobe (mC/RL) ratio, according to Awaya et al. [39] was calculated after taking the following measurements: a first line (1) was drawn through the right lateral wall of the bifurcation of the right portal vein. A second line (2) was drawn through the most medial margin of the caudate lobe and parallel to line 1. A third line (3) was drawn perpendicular to lines 1 and 2 and midway between the main portal vein and inferior vena cava. The distances along line 3 between the lines 1 and 2 (C), and along line 3 between the right lateral margin and line 1 (R) were measured; then the ratio of C to R was calculated [Fig. 1a]. The upper limit of normal mC/RL ratio was 1;
-
4)
presence of T2w hyperintense wedge-shaped areas;
-
5)
presence of T2w hyperintensity around portal vein branches.
Fig. 1.

Modified caudate/right lobe ratio (mC/RL ratio) (a): The line 1 is drawn through the right lateral wall of the bifurcation of the right portal vein. The line 2 is drawn through the most medial margin of the caudate lobe and parallel to line 1. The line 3 is drawn perpendicular to lines 1 and 2 and midway between the main portal vein and inferior vena cava. The line C represents the distance between the lines 1 and 2, instead the line R measure the distance between the right lateral margin and the line 1. Regions of interest (ROI) in DW image (b) with corresponding ADC maps (c). Regions of interest (ROI) in unenhanced (d), 3-minute delayed phase (e) and hepatobiliary phase 20 minutes after administration of gadoxetic acid (f).
Regional features were also evaluated, namely:
-
1)
gallbladder appearance: presence, size, wall thickness, presence of masses, presence of gallstones;
-
2)
presence of lymph nodes more than one centimeter in diameter or increased number;
-
3)
presence of signs of portal hypertension: porto-systemic shunts; splenomegaly [40].
2.5. Quantitative analysis
This analysis was conducted on liver parenchyma. From two to three areas of increased SI on DWI were identified. In the case of absence of obvious differences in liver SI, from two to three areas were randomly selected. The apparent diffusion coefficient (ADC) semiquantitative analysis was performed on the aforementioned areas and in background liver parenchyma on a dedicated workstation. The ADC values were measured using a mono-exponential curve fitting with all the b values, by drawing a region of interest (ROI) with average size of 100 mm2 on fused images, obtained by the fusion of diffusion images (with b value=1000 s/mm) and automated ADC maps generated by the built-in software (GeniQ; GE Healthcare) [Figs. 1b-1c]. Mean ADC value for the areas with increased SI and for liver background was calculated. Each of the ROIs was copied to unenhanced images, as well as to delayed (3 minutes after IV administration of Gd-EOB-DTPA) and HBP contrast-enhanced T1w images [Figs. 1d-1f-1g]. The SI of each ROI was measured. Mean SI obtained from ROIs of the T1w unenhanced (SI unenhanced) and contrast-enhanced (SI on delayed phase and SI on HBP) images were used to calculate the RE of liver areas with increased SI on DWI and RE of liver background, using the following formula [34]:
-
•
RE DP= (SI on delayed phase-SI unenhanced)/SI unenhanced
-
•
RE HBP= (SI on HBP-SI unenhanced) /SI unenhanced
TE was performed by Fibroscan (EchoSens, Paris, France) on the same day of MR by trained physicians. The US guide was used to identify a target liver area, at least 6 cm thick, without major vascular structures on the right liver lobe through intercostal spaces in the patient lying on his back, with right arm in maximal abduction. The procedure was considered valid if at least 10 valid measurements were performed, with a success rate (ratio between numbers of valid and total measurements) ≥ 60 % and interquartile range (IQR) < 20 %. LS was recorded in kPa as the median value of all measurements.
Blood tests closest to the date of MR examinations were collected. The laboratory tests included alanine aminotransferase (ALT), alkaline phosphatase (ALP), gamma-glutamyl transferase (GGT), total and direct bilirubin (TBIL and DBIL, respectively), albumin (ALB) and platelets (PLT).
2.6. Statistical analysis
Continuous data were described as mean±standard deviation (SD), while categorical data by absolute and relative frequency. To compare continuous with categorical variables two-tailed Independent Samples t Test was used. Comparison between continuous variables was performed by Pearson correlation analysis and Pearson correlation coefficient (Pearson’s r) was determined. Statistical significance level was set at 0.05. All analyses were performed with software SPSS version 27.
3. Results
3.1. Qualitative MRI analysis
Biliary tree, liver parenchyma and regional features are summarized in Table 2.
Table 2.
Qualitative MRI analysis: biliary tree, liver parenchyma and regional features aspects.
| 1Bile duct dilatations | Intrahepatic bile duct cystic appearance | 2Bile duct strictures | Pruned tree appearance | Intrahepatic lithiasis | 3Biliary excretion of gadoxetic acid (Grade 0) | Biliary excretion of gadoxetic acid (Grad 1–2) | |
|---|---|---|---|---|---|---|---|
| Biliary tree | 18/26 (69.2 %) |
3/26 (11.5 %) |
21/26 (80.7 %) |
6/26 (23 %) |
3/26 (11.5 %) |
13/26 (50 %) |
13/26 (50 %) |
| Detected areas of fibrosis (Grade 1) | Detected areas of fibrosis (Grade 2) | Detected areas of fibrosis (Grade 3) | Cirrhosis |
mRC/L Ratio measurable |
T2W hyperintense wedge-shaped areas | T2W hyperintensity around portal vein branches | |
| Liver parenchyma | 4/26(15.4 %) | 8/26 (30,8 %) |
8/26 (30.8 %) |
18/26 (69.2 %) |
25/26 (96 %) |
18/26 (69.2 %) |
17/26 (72 %) |
| 4Gallbladder enlargement | 5Gallbladder wall thickening | 6Gallbladder gallstones |
Abdominal lymph nodes (>1 cm or increased in number) |
Portosystemic shunts | Splenomegaly | ||
| Regional features | 6/19 (31.6 %) |
3/19 (15,8 %) |
4/19 (21 %) |
22/26 (84.6 %) |
3/26 (11.5 %) |
16/26 (61.5 %) |
1intrahepatic location in 11 patients, both intra- and extra-hepatic location in 7 patients.
2intrahepatic location in 1 patient, an extrahepatic location in 8 patients, both intra- and extra-hepatic in 12 patients. Significant bile duct strictures were found in 6 patients.
3Grade 1 in 11/26 patients, and grade 2 in 2/26 patients.
4,5,6 Gallbladder was evaluable in 19 patients (7 patients had undergone cholecystectomy)
Fig. 2 shows advanced stage-PSC, while Fig. 3 shows early-stage PSC.
Fig. 2.
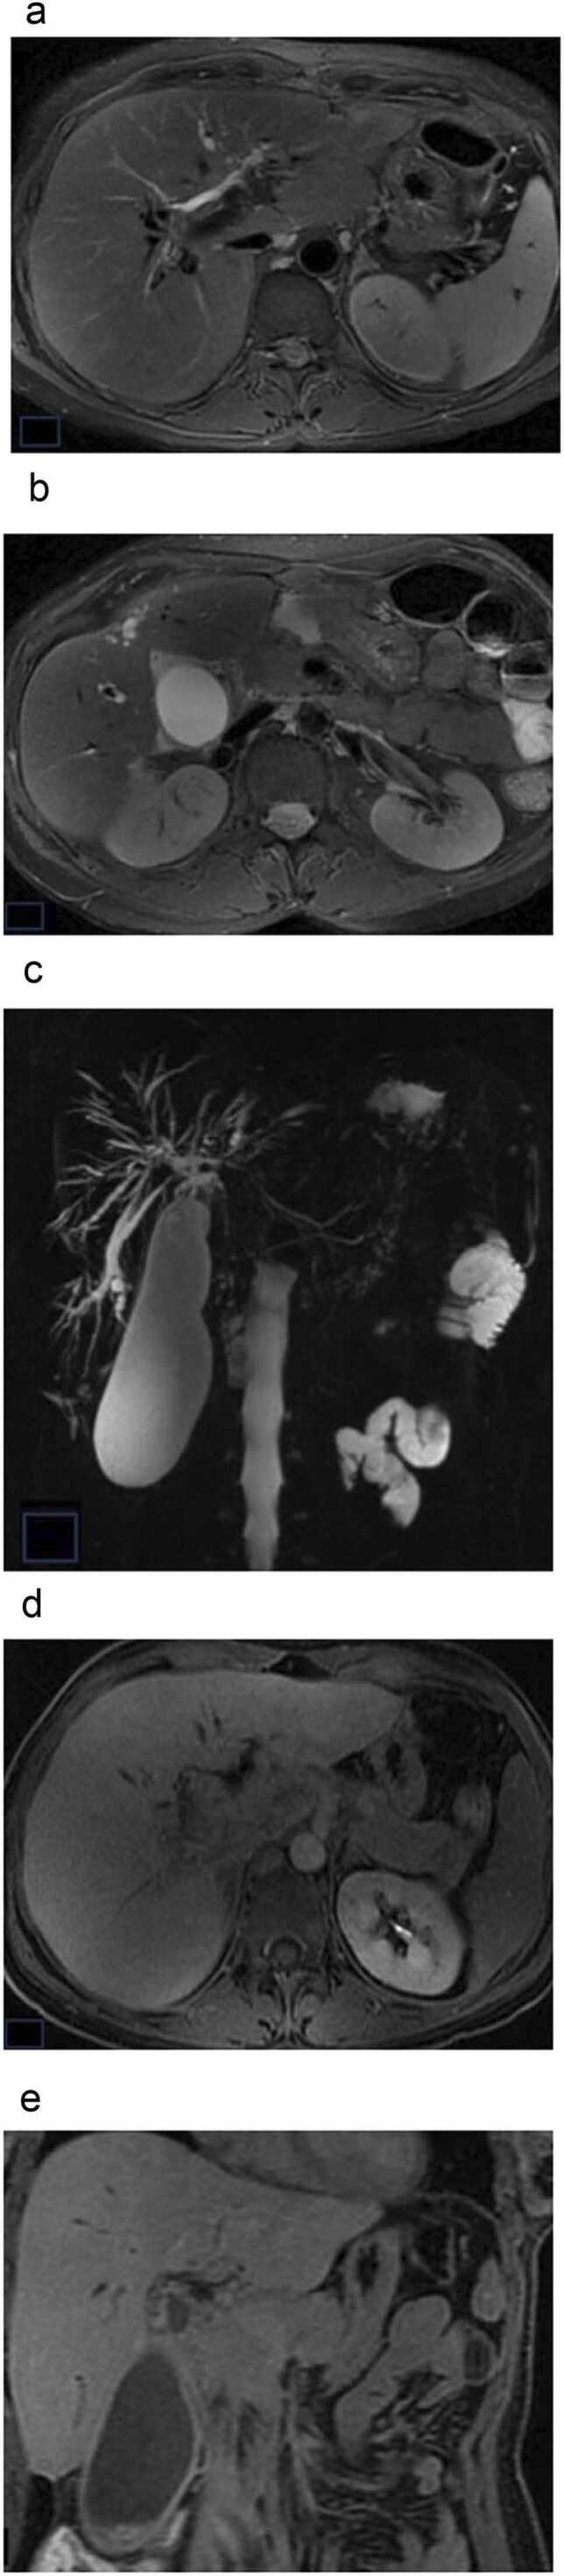
Man, 47 years-old, end-stage PSC: cirrhotic liver configuration. (a), (b) axial T2w fat-suppression PROPELLER; (c) MRCP; (d), (e) axial and coronal T1w LAVA 20 minutes after gadoxetic acid administration. MRI images and MRCP show intrahepatic bile duct dilatations and strictures; gallbladdder is enlarged (a-c); Absent contrast enhancement and excretion of gadoxetic acid in the CBD in HBP (d-e).
Fig. 3.

Woman, 54 years-old, early-stage PSC: no remarkable changes of liver parenchyma (a), (b) axial T2w fat-suppression PROPELLER; (c) MRCP; (d), (e) axial and coronal T1w LAVA 20 minutes after gadoxetic acid administration. No remarkable bile duct changes, except for a slight attenuation of peripheral bile ducts on T2W images (a-b) and MRCP (c). Homogeneous parenchymal enhancement and regular excretion of gadoxetic acid in the CBD in HBP; poorly detectable excretion of gadoxetic acid in right posterior bile duct (d-e).
Statistical analysis revealed no significant differences in results of blood tests in patients with and without bile ductal changes (Table 3, Table 4). A significant (p=0.016) difference in TBIL values (mean=0.9730 vs 0.4833) was observed in patients with and without liver fibrosis detected on MR images, with higher levels of TBIL in patients with liver fibrosis (Table 5). Statistically significant (p=0.035) difference between values of TE-LSM (mean=14.568 vs 6.217) was identified in patients with and without liver fibrosis at MRI visual assessment (Table 6). A statistically significant (p=0.002) difference was also found between grades (mean=2.500 vs 1.214) of liver fibrosis at MRI visual assessment among 2 group of patients with different values of TE-LSM, using 9 kPa as a cut-off for significant liver fibrosis [41]. In other words, patients with higher grades of liver fibrosis at MRI visual assessment had higher values of TE-LSM (>9 kPa) (Table 7). In patients with splenomegaly, no statistically significant difference was found between values of TE-LSM (Table 6) or between values of blood tests (Table 8). Significant correlation was observed of gadoxetic acid biliary excretion grading with ALT (r=0.448; p=0.022), and DBIL (r=0.533; p=0.005) (Table 9a). In other words, patients with lower gadoxetic acid biliary excretion had higher levels of ALT and DBIL.
Table 3.
Independent Samples t Test for comparison between MRI categorical variables and blood tests.
| Bile duct dilatations | N | Mean | S | p-value | |
|---|---|---|---|---|---|
| ALT (IU/L) | No | 8 | 39.00 | 20.695 | 0.198 |
| Yes | 18 | 59.89 | 42.084 | ||
| GGT (IU/L) | No | 8 | 161.88 | 115.956 | 0.807 |
| Yes | 18 | 149.00 | 125.713 | ||
| ALP (x ULN) | No | 8 | 1.1088 | 0.38365 | 0.175 |
| Yes | 18 | 1.4811 | 0.70349 | ||
| TBIL (mg/dL) | No | 8 | 0.6775 | 0.37598 | 0.173 |
| Yes | 18 | 0.9411 | 0.46659 | ||
| DBIL (mg/dL) | No | 8 | 0.3713 | 0.14515 | 0.245 |
| Yes | 18 | 0.5378 | 0.37981 | ||
| ALB (mg/dL) | No | 8 | 1.13 | 0.354 | 0.428 |
| Yes | 18 | 1.33 | 0.686 | ||
| PLT (/mm3) | No | 7 | 225,428.57 | 67810.661 | 0.881 |
| Yes | 18 | 219,222.22 | 98888.265 |
SD: standard deviation; ALT: alanine aminotransferase; GGT: gamma-glutamyl transferase; TBIL: total bilirubin; DBIL: direct bilirubin; ALB: albumin; PLT: platelets
Table 4.
Independent Samples t Test for comparison between MRI categorical variables and blood tests.
| Bile duct stricture | N | Mean | SD | p-value | |
|---|---|---|---|---|---|
| ALT (IU/L) | No | 5 | 34.60 | 21.232 | 0.220 |
| Yes | 21 | 57.95 | 39.697 | ||
| GGT (UI/L) | No | 5 | 108.00 | 104.764 | 0.364 |
| Yes | 21 | 163.67 | 123.953 | ||
| ALP (xULN) | No | 5 | 0.9140 | 0.22244 | 0.077 |
| Yes | 21 | 1.4743 | 0.66128 | ||
| TBIL (mg/dL) | No | 5 | 0.5580 | 0.18472 | 0.096 |
| Yes | 21 | 0.9319 | 0.46767 | ||
| DBIL (mg/dL) | No | 5 | 0.2520 | 0.10521 | 0.078 |
| Yes | 21 | 0.5424 | 0.34414 | ||
| ALB (gr/dl) | No | 5 | 1.00 | 0.000 | 0.276 |
| Yes | 21 | 1.33 | 0.658 | ||
| PLT (/mm3) | No | 5 | NA | NA | 0.409 |
| Yes | 20 | NA | NA |
SD: standard deviation; ALT: alanine aminotransferase; GGT: gamma-glutamyl transferase; TBIL: total bilirubin; DBIL: direct bilirubin; ALB: albumin; PLT: platelets.
Table 5.
Independent Samples t Test for comparison between MRI categorical variables and blood tests.
| Liver fibrosis | N | Mean | SD | p-value | |
|---|---|---|---|---|---|
| ALT (IU/L) | No | 6 | 43.17 | 11.566 | 0.457 |
| Yes | 20 | 56.55 | 42.319 | ||
| GGT (IU/L) | No | 6 | 121.50 | 81.625 | 0.478 |
| Yes | 20 | 162.40 | 130.317 | ||
| ALP (x ULN) | No | 6 | 1.0167 | 0.31252 | 0.129 |
| Yes | 20 | 1.4715 | 0.67933 | ||
| TBIL (mg/dL) | No | 6 | 0.4833 | 0.23062 | 0.016 |
| Yes | 20 | 0.9730 | 0.44146 | ||
| DBIL (mg/dL) | No | 6 | 0.2967 | 0.13426 | 0.112 |
| Yes | 20 | 0.5435 | 0.35408 | ||
| ALB (mg/dL) | No | 6 | 1.00 | 0.000 | 0.220 |
| Yes | 20 | 1.35 | 0.671 | ||
| PLT (/mm3) | No | 6 | NA | 69623.033 | 0.253 |
| Yes | 19 | NA | 93944.179 |
SD: standard deviation; ALT: alanine aminotransferase; GGT: gamma-glutamyl transferase; TBIL: total bilirubin; DBIL: direct bilirubin; ALB: albumin; PLT: platelets.
Table 6.
Independent Samples t Test for comparison between MRI categorical variables and TE-LSM.
| Liver fibrosis | N | Mean | SD | p-value | |
|---|---|---|---|---|---|
| TE-LSM (kPa) | No | 6 | 6.217 | 1.430 | 0035 |
| Yes | 19 | 14.568 | 15.798 | ||
| Splenomegaly | N | Mean | SD | p-value | |
| TE-LSM (kPa) | No | 10 | 6.900 | 3.230 | 0057 |
| Yes | 15 | 16.340 | 17.304 |
TE-LSM: transient elastography-derived liver stiffness measurements; SD: standard deviation.
Table 7.
Independent Samples t Test for comparison between MRI continuous variables and TE-LSM.
| TE-LSM (kPa) | N | Mean | SD | p-value | ||
|---|---|---|---|---|---|---|
| Liver fibrosis grade | <9 | 14 | 1.214 | 0.975 | 0002 | |
| >9 | 10 | 2.500 | 0.707 | |||
| ADC in high SI areas on DWI | <9 | 15 | 1.120 | 0.133 | 0129 | |
| >9 | 10 | 1.045 | 0.086 | |||
| ADC in liver background | <9 | 11 | 1.265 | 0.145 | 0658 | |
| >9 | 10 | 1.290 | 0.097 | |||
| RE DP in high SI areas on DWI | <9 | 14 | 0.919 | 0.218 | 0.511 | |
| >9 | 10 | 0.855 | 0.252 | |||
| RE DP in liver background | <9 | 12 | 0.781 | 0.243 | 0.043 | |
| >9 | 10 | 0.572 | 0.201 | |||
| RE HBP in high SI areas on DWI | <9 | 14 | 1.034 | 0.333 | 0.006 | |
| >9 | 10 | 0.617 | 0.335 | |||
| RE HBP in liver background | <9 | 12 | 1.130 | 0.297 | 0.008 | |
| >9 | 10 | 0.762 | 0.282 | |||
| Gadoxetic acid excretion grade | <9 | 15 | 0.533 | 0.834 | 0.824 | |
| >9 | 10 | 0.600 | 0.516 |
TE-LSM: transient elastography-derived liver stifness measurements; SD: standard deviation;ADC: apparent diffusion coefficient; DWI: diffusion-weighted imaging; RE: relative enhancement; DP: delayed phase; SI: signal intensity; HBP: hepato-biliary phase
Table 8.
Independent Samples t Test for comparison between MRI categorical variables and blood tests.
| Splenomegaly | N | Mean | SD | p-value | |
|---|---|---|---|---|---|
| ALT (UI/L) | No | 10 | 50.50 | 42.675 | 0.759 |
| Yes | 16 | 55.31 | 35.580 | ||
| GGT (UI/L) | No | 10 | 141.20 | 111.181 | 0.703 |
| Yes | 16 | 160.31 | 129.152 | ||
| ALP (x ULN) | No | 10 | 1.2030 | 0.77477 | 0.312 |
| Yes | 16 | 1.4688 | 0.54002 | ||
| TBIL (mg/dL) | No | 10 | 0.6730 | 0.33327 | 0.095 |
| Yes | 16 | 0.9769 | 0.48357 | ||
| DBIL (mg/dL) | No | 10 | 0.3270 | 0.17582 | 0.050 |
| Yes | 16 | 0.5863 | 0.37073 | ||
| ALB (mg/dL) | No | 10 | 1.00 | 0.000 | 0.071 |
| Yes | 16 | 1.44 | 0.727 | ||
| PLT (/mm3) | No | 10 | NA | NA | 0.069 |
| Yes | 15 | NA | NA |
SD: standard deviation; ALT: alanine aminotransferase; GGT: gamma-glutamyl transferase; TBIL: total bilirubin; DBIL: direct bilirubin; ALB: albumin; PLT: platelets.
Table 9a.
Pearson correlation analysis of MRI continuous variables with blood tests.
| ALT | GGT | ALP | TBIL | DBIL | ALB | PLT | ||
|---|---|---|---|---|---|---|---|---|
| (IU/L) | (IU/L) | (x ULN) | (mg/dL) | (mg/dL) | (mg/dL) | (/mm3) | ||
| RE DP in high SI areas on DWI | Pearson’s r | −0.258 | −0.230 | −0.464* | 0.111 | −0.080 | −0.116 | −0.157 |
| p-value | 0.214 | 0.269 | 0.019 | 0.598 | 0.703 | 0.581 | 0.464 | |
| N | 25 | 25 | 25 | 25 | 25 | 25 | 24 | |
| RE DP in liver background | Pearson’s r | −0.367 | −0.442* | −0.672** | −0.301 | −0.394 | −0.264 | 0.038 |
| p-value | 0.085 | 0.045 | <0.001 | 0.163 | 0.063 | 0.224 | 0.867 | |
| N | 23 | 23 | 23 | 23 | 23 | 23 | 22 | |
| RE HBP in high SI areas on DWI | Pearson’s r. | −0.313 | −0.123 | −0.489* | −0.328. | −0.445* | −0.250 | 0.069 |
| p-value | 0.127 | 0.558 | 0.013 | 0.110 | 0.026 | 0.228 | 0.748 | |
| N | 25 | 25 | 25 | 25 | 25 | 25 | 24 | |
| RE HBP in liver background | Pearson’s r | −0.493* | −0.350 | −0.728** | −0.299 | −0.589** | −0.401 | −0.135 |
| p-value | 0.017 | 0.102 | <0.001 | 0.165 | 0.003 | 0.058 | 0.551 | |
| N | 23 | 23 | 23 | 23 | 23 | 23 | 23 | |
| Gadoxetic acid excretion grade | Pearson’s r | 0.448* | 0.143 | 0.234 | 0.387 | 0.533** | 0.033 | 0.236 |
| p-value | 0.022 | 0.487 | 0.249 | 0.051 | 0.005 | 0.872 | 0.257 | |
| N | 26 | 26 | 26 | 26 | 26 | 26 | 25 |
**, correlation is significant at the 0.01 level (2-tailed); *, correlation is significant at the 0.05 level (2-tailed). DWI: diffusion-weighted imaging; RE: relative enhancement; DP: delayed phase; SI: signal intensity; HBP: hepato-biliary phase; ALT: alanine aminotransferase; GGT: gamma-glutamyl transferase; TBIL: total bilirubin; DBIL: direct bilirubin; ALB: albumin; PLT: platelets.
3.2. Quantitative MRI analysis
Mean value of ADC was 1.10 ×10⁻⁹ m2/s (±0.12) in high SI areas on DWI and 1.25 ×10⁻⁹ m2/s (±0.11) in liver background. RE DP had a mean value of 89.05 % (±22.06 %) in high SI areas on DWI and of 67.65 % (±23.76 %) in liver background. Mean value of RE HB was 84.9 % (±38.38 %) in high SI areas on DWI and 93.13 % (±35.67 %) in liver background. There were statistically significant (p=0.043) different values of RE DP (mean=0.781 vs 0.572) in liver background in patients with different values of TE-LSM (Table 7): notably, patients with lower values of RE DP in liver background had higher values of TE-LSM (>9 kPa). A statistically significant (p=0.006) difference was also found between values (mean=1.034 vs 0.617) of RE HBP in high SI areas in patients with different values of TE-LSM (Table 7): notably, patients with lower values of RE HBP had higher values of TE-LSM (>9 kPa). There was a statistically significant (p=0.008) difference between values (mean=1.130 vs 0.762) of RE HBP in liver background in patients with different values of TE-LSM (Table 7): notably, patients with lower values of RE HBP had higher values of TE-LSM (>9 kPa). Statistical analysis also revealed a correlation of RE with several laboratory tests. Remarkably, a significant inverse correlation was observed of RE DP in high SI areas and in liver background with ALP (p=0.019 and p<0.001, respectively); RE HBP in high SI areas with ALP (p=0.013) and DBIL (p=0.026); RE HBP in liver background with ALT (p=0.017), ALP (p<0.001) and DBIL (p=0.003) (Table 9a). Moreover, a significant (p=0.036) inverse correlation was identified between ADC in high SI areas and TBIL (Table 9b).
Table 9b.
Pearson correlation analysis of MRI continuous variables with blood tests.
| ALT | GGT | ALP | TBIL | DBIL | ALB | PLT | ||
| (IU/L) | (IU/L) | (x ULN) | (mg/dL) | (mg/dL) | (mg/dL) | (/mm3) | ||
| ADC in high SI areas on DWI | Pearson’s | −0.320 | −0.257 | −0.248 | −0.413* | −0.283 | −0.027 | 0.045 |
| p-value | 0.111 | 0.205 | 0.222 | 0.036 | 0.161 | 0.896 | 0.830 | |
| N | 26 | 26 | 26 | 26 | 26 | 26 | 26 | |
| ADC in liver background | Pearson’s | −0.114 | −0.111 | −0.123 | 0.306 | −0.095 | −0.208 | −0.261 |
| p-value | 0.613 | 0.623 | 0.586 | 0.165 | 0.674 | 0.352 | 0.252 | |
| N | 22 | 22 | 22 | 22 | 22 | 22 | 21 |
**, correlation is significant at the 0.01 level (2-tailed); *, correlation is significant at the 0.05 level (2-tailed); DWI: diffusion-weighted imaging; ADC: apparent diffusion coefficient; SI: signal intensity; ALT: alanine aminotransferase; GGT: gamma-glutamyl transferase; TBIL: total bilirubin; DBIL: direct bilirubin; ALB: albumin; PLT: platelets.
4. Discussion
Several efforts have already been done to find non-invasive tools, including MRI parameters, suitable for PSC severity assessment and stratification of the risk of progression. In the attempt to further investigate the relationship between specific MRI findings and the clinical features of the liver disease, we enrolled a series of patients with diagnosis of PSC who underwent at the same time 3 T MRI and a detailed hepatological evaluation, including LFT and TE-LSM.
Among qualitative evaluations, bile duct changes have an established prognostic value. Ponsioen et al. [42] created a model based on Amsterdam cholangiographic classification by ERCP [43]. This prognostic model, subsequently validated in a second cohort of patients [44], was able to predict patient’s survival. Ruiz et al. [24] built an interpretation standard model to score bile duct and liver parenchyma features on MRI examination, although they pointed out that parenchymal changes had better performance. Our findings about frequency of biliary ductal dilatations (69.2 % of patients) and strictures (80.7 % of patients) are in line with data from previous studies [24]. However, statistical analysis revealed no significant correlation between presence of bile duct changes and serum biomarkers of disease severity and progression. We analysed such apparent discrepancy dividing the strictures in significant and non-significant, depending on the presence or absence of gadoxetic acid in the strictures on HBP. In fact, T1w images better visualize the bile duct lumen, compared to MRCP sequences, and avoid overestimation of the stenosis, notably of central bile ducts [34], [45]. Accordingly, only 6 (23.1 %) patients showed significant strictures, and 3 (11.5 %) had intrahepatic bile duct cystic appearance, a marker of more aggressive disease and of poor outcome, often associated with acute bacterial cholangitis [46]. Pruned tree appearance was identified in 6 (23 %) patients, a sign generally found in advanced disease [47]. In additin, we found intrahepatic lithiasis in 3 (11.5 %) patients, which are considered an independent risk factor for intrahepatic cholangiocarcinoma development [48], [49]. Overall, our finding confirms the role of assessment of gadoxetic acid excretion for estimating disease severity in PSC patients, and the significative correlation observed between biliary excretion of gadoxetic acid with ALT and DBIL levels are in line with the study by Elkilany et al. [36].
Regarding evaluation of liver parenchyma, peripheral wedge-shaped T2w hyperintensity areas and T2w hyperintensity around portal vein branches were identified in most of our patients. Indeed, these are common findings in PSC. It is thought that the former is due to parenchymal edema and inflammatory changes in peripheral regions of the liver, likely because of impairment of lymphatic and venous drainage in portal triads. Nevertheless, T2w hyperintensity might also depend on the presence of confluent fibrosis, even if confluent fibrosis is generally associated with parenchymal atrophy [50], [51]. Regarding T2w hyperintensity around portal vein branches, it is non-specific of PSC, as it is also can be encountered in other diseases (i.e., primary biliary cholangitis) and depends on edema, ductal proliferation, and inflammatory cell infiltration in portal triads [52]. Concerning liver morphology, the mC/RL ratio greater than 1 was found in almost all patients. The mC/RL ratio greater than 1 depends mainly on compensatory hypertrophy of caudate lobe, which is less involved by the inflammatory process of PSC [50].
A peculiar feature of PSC is represented by confluent hepatic fibrosis, which appears as peripheral wedge-shaped areas hyperintense on T2w, as mentioned above. No consensus exists in literature whether inflammation or fibrosis contributes more to T2w hyperintense areas [53]. In our study, we evaluated liver parenchyma by visual assessment both on T2w sequences and on T1w after gadoxetic acid enhancement, notably on HBP, to better detect areas of fibrosis. Indeed, on HBP, areas of confluent fibrosis appear hypointense compared to the surrounding enhanced parenchyma [54]. Among qualitative parameters, fibrosis visual assessment had the best performance in estimating disease severity, showing a statistically significant correlation with LS measured by TE. The correlation with total bilirubin levels is also conceivable, given its proven role as prognostic marker in PSC [55].
Further findings worth of attention are enlargement of gallbladder and splenomegaly, which occurred in 23 % and 61.5 % of our patients, respectively. Splenomegaly, that Ehlken et al. [56] reported to be strongly associated with patient outcome in PSC, in our small cohort tended to be associated with higher values of LSM and bilirubin, and lower PLTs counts.
Among quantitative analysis potentially useful for assessing disease severity, the role of DWI has been widely investigated, with contradictory results. The rationale of these studies relies on the sensitivity of DWI to changes in the microdiffusion of water within the intracellular and extracellular spaces. Since diffusion of water is restricted by connective tissue, the ADC has been proposed to stage hepatic fibrosis [57], although some studies reported lower diagnostic accuracy than TE and MRE [28], [29]. According to the meta-analysis by Jiang et al. [30], the diagnostic accuracy of DWI in staging liver fibrosis improves using bmax ≥ 800 s/mm2, high field strength and intravoxel incoherent motion (IVIM)-DWI. Finally, in a prospective study by Keller et al. in PSC patients [21], DWI showed a higher diagnostic performance in detecting and staging fibrosis than dynamic contrast-enhanced MRI. In our cohort, ADC in areas with restricted diffusion had significant inverse correlation with TBIL, a marker of both cholestasis and liver function impairment, while did not correlate with LSM by TE. The fact that LSM was performed on the lateral right liver segments only, might explain this contrasting result. In addition, RE on HBP in areas with restricted diffusion was lower than in background liver, having a mean value of 84.9±38.4 % vs 93.1±35.7 %, in agreement with previous findings by Verloh et al. [58]. Interestingly, RE on HBP had a significant inverse correlation with both serum biomarkers of cholestasis and TE-LSM, regardless on whether measured in high SI areas on DWI or in background liver. This inverse correlation with serum biomarker of cholestasis, already reported by Elkilany et al. [36], further supports RE on hepatobiliary phase as a useful tool to evaluate liver function and estimate disease severity in patients with PSC. Moreover, Keller et al. [35] emphasized the role of RE on 5-minute delayed phase, after extracellular GBCA administration, in distinguishing fibrosis stages, using a cut-off value of 66.6 %. We evaluated RE on 3-minute delayed phase (RE-DP), when hepatobiliary phase had not begun yet, and we found a mean value of 89.0±22.1 % in high SI areas on DWI vs 67.6±23.8 % in background liver. Interestingly, lower values of RE-DP in background liver correlated with higher values of TE-LSM and with elevation of ALP and GGT, suggesting the diffuse involvement of the liver by the pathologic process.
Despite the new reletionships described between MRI, liver biochemistry assays and LS in PSC patients, we acknowledge that the retrospective design and the small number of patients represent major limitations of this study. Moreover, we used TE-LSM as a reference test for assessing liver fibrosis, in view of its non-invasiveness and easy applicability that allowed us to perform it on the same day of MRI. By contrast, liver biopsy, which could have assessed not only liver fibrosis but also inflammatory and cholestasis features [16], was not available or performed at a different time from MRI in many patients.
In conclusion, our preliminary results provide evidence that disease profile of PSC patients is heterogeneous but pathogenic factors driving progression may be identified at the earlier stages by accurate MRI/MRCP qualitative and quantitative analysis. Interestingly, specific functional and morphological features identified at MRI correlate with biochemical markers and LS used in the clinical practice. Further studies with larger number of patients and prospective evaluations are required to develop reliable scores that integrate both clinical-radiological features of the disease and could be used to stratify prognosis in PSC patients.
Funding statement
This research did not receive any specific grant from funding agencies in the public, commercial, or not-for-profit sectors.
CRediT authorship contribution statement
Barbara Vianello: Writing – review & editing, Software, Data curation. Andrea Pinna: Writing – review & editing, Resources, Data curation. Riccardo Morganti: Writing – review & editing, Formal analysis. Piero Colombatto: Writing – review & editing, Validation, Methodology, Investigation. Francescamaria Donati: Writing – review & editing, Writing – original draft, Visualization, Validation, Methodology, Investigation, Data curation, Conceptualization. Barbara Coco: Writing – review & editing, Validation, Methodology, Investigation. Valentina Mazzantini: Writing – review & editing, Writing – original draft, Visualization, Validation, Software, Resources, Project administration, Methodology, Conceptualization. Maurizia Rossana Brunetto: Writing – review & editing, Supervision. Emanuele Neri: Writing – review & editing, Supervision. Piero Boraschi: Writing – review & editing, Writing – original draft, Visualization, Validation, Project administration, Methodology, Investigation, Conceptualization.
Declaration of Competing Interest
The authors declare that they have no known competing financial interests or personal relationships that could have appeared to influence the work reported in this paper.
References
- 1.Karlsen T.H., Folseraas T., Thorburn D., Vesterhus M. Primary sclerosing cholangitis - a comprehensive review. J. Hepatol. 2017;67:1298–1323. doi: 10.1016/j.jhep.2017.07.022. [DOI] [PubMed] [Google Scholar]
- 2.Tabibian J.H., Bowlus C.L. Primary sclerosing cholangitis: a review and update. Liver Res. 2017;1:221–230. doi: 10.1016/j.livres.2017.12.002. [DOI] [PMC free article] [PubMed] [Google Scholar]
- 3.Boonstra K.B., Weersma R.K., van Erpecum K.J., Rauws E.A., Spanier B.W., Poen A.C., van Nieuwkerk K.M., Drenth J.P., Witteman B.J., Tuynman H.A., Naber A.H., Kingma P.J., van Buuren H.R., van Hoek B., Vleggaar F.P., van Geloven N., Beuers U., Ponsioen C.Y. EpiPSCPBC Study Group. Population-based epidemiology, malignancy risk, and outcome of primary sclerosing cholangitis. Hepatology. 2013;58:2045–2055. doi: 10.1002/hep.26565. [DOI] [PubMed] [Google Scholar]
- 4.Bjoro K., Brandsaeter B., Foss A., Schrumpf E. Liver transplantation in primary sclerosing cholangitis. Semin Liver Dis. 2006;26:69–79. doi: 10.1055/s-2006-933565. [DOI] [PubMed] [Google Scholar]
- 5.Karlsen T.H., Boberg K.M. Update on primary sclerosing cholangitis. J. Hepatol. 2013;59:571–582. doi: 10.1016/j.jhep.2013.03.015. [DOI] [PubMed] [Google Scholar]
- 6.Tabibian J.H., Weeding E., Jorgensen R.A., Petz J.L., Keach J.C., Talwalkar J.A., Lindor K.D. Randomised clinical trial: vancomycin or metronidazole in patients with primary sclerosing cholangitis-a pilot study. Aliment Pharm. Ther. 2013;37:604–612. doi: 10.1111/apt.12232. [DOI] [PubMed] [Google Scholar]
- 7.Vesterhus M., Karlsen T.H. Emerging therapies in primary sclerosing cholangitis: pathophysiological basis and clinical opportunities. J. Gastroenterol. 2020;55:588–614. doi: 10.1007/s00535-020-01681-z. [DOI] [PMC free article] [PubMed] [Google Scholar]
- 8.Ponsioen C.Y.Diagnosis. Differential Diagnosis, and Epidemiology of Primary Sclerosing Cholangitis. Dig. Dis. 2015;33:134–139. doi: 10.1159/000440823. [DOI] [PubMed] [Google Scholar]
- 9.European Association for the Study of the Liver EASL Clinical Practice Guidelines: management of cholestatic liver diseases. J. Hepatol. 2009;51:237–267. doi: 10.1016/j.jhep.2009.04.009. [DOI] [PubMed] [Google Scholar]
- 10.Schramm C., Eaton J., Ringe K.I., Venkatesh S., Yamamura J., MRI working group of IPSCSG Recommendations on the use of magnetic resonance imaging in PSC-A position statement from the International PSC Study Group. Hepatology. 2017;66:1675–1688. doi: 10.1002/hep.29293. [DOI] [PubMed] [Google Scholar]
- 11.Lindor K.D., Kowdley K.V., Harrison M.E. American College of Gastroenterology. ACG Clinical Guideline: Primary Sclerosing Cholangitis. Am. J. Gastroenterol. 2015;110:646–659. doi: 10.1038/ajg.2015.112. [DOI] [PubMed] [Google Scholar]
- 12.Chapman R., Fevery J., Kalloo A., Nagorney D.M., Boberg K.M., Shneider B., Gores G.J. American Association for the Study of Liver Diseases. Diagnosis and management of primary sclerosing cholangitis. Hepatology. 2010;51:660–678. doi: 10.1002/hep.23294. [DOI] [PubMed] [Google Scholar]
- 13.Dave M., Elmunzer B.J., Dwamena B.A., Higgins P.D. Primary sclerosing cholangitis: meta-analysis of diagnostic performance of MR cholangiopancreatography. Radiology. 2010;256:387–396. doi: 10.1148/radiol.10091953. [DOI] [PubMed] [Google Scholar]
- 14.de Vries E.M., de Krijger M., Färkkilä M., Arola J., Schirmacher P., Gotthardt D., Goeppert B., Trivedi P.J., Hirschfield G.M., Ytting H., Vainer B., Buuren H.R., Biermann K., Harms M.H., Chazouilleres O., Wendum D., Kemgang A.D., Chapman R.W., Wang L.M., Williamson K.D., Gouw A.S., Paradis V., Sempoux C., Beuers U., Hübscher S.G., Verheij J., Ponsioen C.Y. Validation of the prognostic value of histologic scoring systems in primary sclerosing cholangitis: An international cohort study. Hepatology. 2017;65:907–919. doi: 10.1002/hep.28963. [DOI] [PubMed] [Google Scholar]
- 15.Selvaraj E.A., Culver E.L., Bungay H., Bailey A., Chapman R.W., Pavlides M. Evolving role of magnetic resonance techniques in primary sclerosing cholangitis. World J. Gastroenterol. 2019;25:644–658. doi: 10.3748/wjg.v25.i6.644. [DOI] [PMC free article] [PubMed] [Google Scholar]
- 16.European Association for the Study of the Liver EASL Clinical Practice Guidelines on non-invasive tests for evaluation of liver disease severity and prognosis–2021 update. J. Hepatol. 2021;75:659–689. doi: 10.1016/j.jhep.2021.05.025. [DOI] [PubMed] [Google Scholar]
- 17.European Association for Study of Liver, Asociacion Latinoamericana para el Estudio del Higado EASL-ALEH Clinical Practice Guidelines: non- invasive tests for evaluation of liver disease severity and prognosis. J. Hepatol. 2015;63:237–264. doi: 10.1016/j.jhep.2015.04.006. [DOI] [PubMed] [Google Scholar]
- 18.Ziol M., Handra-Luca A., Kettaneh A., Christidis C., Mal F., Kazemi F., de Lédinghen V., Marcellin P., Dhumeaux D., Trinchet J.C., Beaugrand M. Noninvasive assessment of liver fibrosis by measurement of stiffness in patients with chronic hepatitis C. Hepatology. 2005;41:48–54. doi: 10.1002/hep.20506. [DOI] [PubMed] [Google Scholar]
- 19.Castéra L., Vergniol J., Foucher J., Le Bail B., Chanteloup E., Haaser M., Darriet M., Couzigou P., De Lédinghen V. Prospective comparison of transient elastography, Fibrotest, APRI, and liver biopsy for the assessment of fibrosis in chronic hepatitis C. Gastroenterology. 2005;128:343–350. doi: 10.1053/j.gastro.2004.11.018. [DOI] [PubMed] [Google Scholar]
- 20.Foucher J., Chanteloup E., Vergniol J., Castéra C., Le Bail B., Adhoute X., Bertet J., Couzigou P., de Lédinghen V. Diagnosis of cirrhosis by transient elastography (FibroScan): a prospective study. Gut. 2006;55:403–408. doi: 10.1136/gut.2005.069153. [DOI] [PMC free article] [PubMed] [Google Scholar]
- 21.Keller S., Sedlacik J., Schuler T., Buchert R., Avanesov M., Zenouzi R., Lohse A.W., Kooijman H., Fiehler J., Schramm C., Yamamura J. Prospective comparison of diffusion-weighted MRI and dynamic Gd-EOB-DTPA-enhanced MRI for detection and staging of hepatic fibrosis in primary sclerosing cholangitis. Eur. Radio. 2019;29:818–828. doi: 10.1007/s00330-018-5614-9. [DOI] [PubMed] [Google Scholar]
- 22.Corpechot C., Gaouar F., El Naggar A., Kemgang A., Wendum D., Poupon R., Carrat F., Chazouillères O. Baseline values and changes in liver stiffness measured by transient elastography are associated with severity of fibrosis and outcomes of patients with primary sclerosing cholangitis. Gastroenterology. 2014;146:970–979. doi: 10.1053/j.gastro.2013.12.030. [DOI] [PubMed] [Google Scholar]
- 23.Corpechot C., El Naggar A., Poujol-Robert A., Ziol M., Wendum D., Chazouillères O., de Lédinghen V., Dhumeaux D., Marcellin P., Beaugrand M., Poupon R. Assessment of biliary fibrosis by transient elastography in patients with PBC and PSC. Hepatology. 2006;43:1118–1124. doi: 10.1002/hep.21151. [DOI] [PubMed] [Google Scholar]
- 24.Ruiz A., Lemoinne S., Carrat F., Corpechot C., Chazouillères O., Arrivé L. Radiologic course of primary sclerosing cholangitis: assessment by three-dimensional magnetic resonance cholangiography and predictive features of progression. Hepatology. 2014;59:242–250. doi: 10.1002/hep.26620. [DOI] [PubMed] [Google Scholar]
- 25.Manduca A., Oliphant T.E., Dresner M.A., Mahowald J.L., Kruse S.A., Amromin E., Felmlee J.P., Greenleaf J.F., Ehman R.L. Magnetic resonance elastography: non-invasive mapping of tissue elasticity. Med Image Anal. 2001;5:237–254. doi: 10.1016/s1361-8415(00)00039-6. [DOI] [PubMed] [Google Scholar]
- 26.Rouviere O., Yin M., Dresner M.A., Rossman P.J., Burgart L.J., Fidler J.L., Ehman L., MR R. elastography of the liver: preliminary results. Radiology. 2006;240:440–448. doi: 10.1148/radiol.2402050606. [DOI] [PubMed] [Google Scholar]
- 27.Yin M., Talwalkar J.A., Glaser K.J., Manduca A., Grimm R.C., Rossman P.J., L Fidler J., L Ehman R. Assessment of hepatic fibrosis with magnetic resonance elastography. Clin. Gastroenterol. Hepatol. 2007;5:1207–1213. doi: 10.1016/j.cgh.2007.06.012. [DOI] [PMC free article] [PubMed] [Google Scholar]
- 28.Kovač J.D., Daković M., Stanisavljević D., Alempijević T., Ješić R., Seferović P., Maksimović R. Diffusion-weighted MRI versus transient elastography in quantification of liver fibrosis in patients with chronic cholestatic liver diseases. Eur. J. Radio. 2012;81:2500–2506. doi: 10.1016/j.ejrad.2011.10.024. [DOI] [PubMed] [Google Scholar]
- 29.Wang Q.B., Zhu H., Liu H.L., Zhang B. Performance of magnetic resonance elastography and diffusion-weighted imaging for the staging of hepatic fibrosis: A meta-analysis. Hepatology. 2012;56:239–247. doi: 10.1002/hep.25610. [DOI] [PubMed] [Google Scholar]
- 30.Jiang H., Chen J., Gao R., Huang Z., Wu M., Song B. Liver fibrosis staging with diffusion-weighted imaging: a systematic review and meta-analysis. Abdom. Radio. (NY) 2017;42:490–501. doi: 10.1007/s00261-016-0913-6. [DOI] [PubMed] [Google Scholar]
- 31.Nilsson H., Blomqvist L., Douglas L., Nordell A., Jacobsson H., Hagen K., Bergquist A., Jonas E. Dynamic gadoxetate- enhanced MRI for the assessment of total and segmental liver function and volume in primary sclerosing cholangitis. J. Magn. Reson Imaging. 2014;39:879–886. doi: 10.1002/jmri.24250. [DOI] [PubMed] [Google Scholar]
- 32.Van Beers B.E., Daire J.L., Garteiser P. New imaging techniques for liver diseases. J. Hepatol. 2015;62:690–700. doi: 10.1016/j.jhep.2014.10.014. [DOI] [PubMed] [Google Scholar]
- 33.Nilsson H., Blomqvist L., Douglas L., Nordell A., Janczewska I., Naslund E., Jonas E. Gd-EOB-DTPA- enhanced MRI for the assessment of liver function and volume in liver cirrhosis. Br. J. Radio. 2013;86:20120653. doi: 10.1259/bjr.20120653. [DOI] [PMC free article] [PubMed] [Google Scholar]
- 34.Nolz R., Asenbaum U., Schoder M., Wibmer A., Einspieler H., Prusa A.M., Peck-Radosavljevic M., Ba-Ssalamah A. Diagnostic workup of primary sclerosing cholangitis: the benefit of adding gadoxetic acid-enhanced T1-weighted magnetic resonance cholangiography to conventional T2-weighted magnetic resonance cholangiography. Clin. Radio. 2014;69:499–508. doi: 10.1016/j.crad.2013.12.008. [DOI] [PubMed] [Google Scholar]
- 35.Keller S., Aigner A., Zenouzi R., Kim A.C., Meijer A., Weidemann S.A., Krech T., Lohse A.W., Adam G., Schramm C., Yamamura J. Association of gadolinium-enhanced magnetic resonance imaging with hepatic fibrosis and inflammation in primary sclerosing cholangitis. PloS One. 2018;13 doi: 10.1371/journal.pone.0193929. [DOI] [PMC free article] [PubMed] [Google Scholar]
- 36.Elkilany A., Geisel D., Müller T., Fischer A., Denecke T. Gadoxetic acid-enhanced MRI in primary sclerosing cholangitis: added value in assessing liver function and monitoring disease progression. Abdom. Radio. 2021;46:979–991. doi: 10.1007/s00261-020-02731-z. [DOI] [PMC free article] [PubMed] [Google Scholar]
- 37.Morgan A.M., Khot R., Sundaram M.K., Ludwig R.D., Nair T.R., Mittal K.P., Ganeshan M.D., Venkatesh K.S. Primary sclerosing cholangitis: review for radiologists. Abdom. Radio. (NY) 2023;48:136–150. doi: 10.1007/s00261-022-03655-6. [DOI] [PMC free article] [PubMed] [Google Scholar]
- 38.European Association for the Study of the Liver EASL Clinical Practice Guidelines on sclerosing cholangitis. J. Hepatol. 2022;77:761–806. doi: 10.1016/j.jhep.2022.05.011. [DOI] [PubMed] [Google Scholar]
- 39.Awaya H., Mitchell D.G., Kamishima T., Holland G., Ito K., Matsumoto T. Cirrhosis: modified caudate-right lobe ratio. Radiology. 2002;224:769–774. doi: 10.1148/radiol.2243011495. [DOI] [PubMed] [Google Scholar]
- 40.Indiran V., Vinod Singh N., Ramachandra Prasad T., Maduraimuthu P. Does coronal oblique length of spleen on CT reflect splenic index. Abdom. Radio. (NY) 2017;42:1444–1448. doi: 10.1007/s00261-017-1055-1. [DOI] [PubMed] [Google Scholar]
- 41.Chang P.E., Hartono J.L., Ngai Y.L., Dan Y.Y., Lim K.B., Chow W.C. Optimal liver stiffness measurement values for the diagnosis of significant fibrosis and cirrhosis in chronic liver disease in Singapore. Singap. Med J. 2019;60:532–537. doi: 10.11622/smedj.2018156. [DOI] [PMC free article] [PubMed] [Google Scholar]
- 42.Ponsioen C.Y., Vrouenraets S.M., Prawirodirdjo W., Rajaram R., Rauws E.A., Mulder C.J., Reitsma J.B., Heisterkamp S.H., Tytgat G.N.J. Natural history of primary sclerosing cholangitis and prognostic value of cholangiography in a Dutch population. Gut. 2002;51:562–566. doi: 10.1136/gut.51.4.562. [DOI] [PMC free article] [PubMed] [Google Scholar]
- 43.Majoie C.B., Reeders J.W., Sanders J.B., Huibregtse K., Jansen P.L. Primary sclerosing cholangitis: A modified classification of cholangiographic findings. AJR Am. J. Roentgenol. 1991;157:495–497. doi: 10.2214/ajr.157.3.1651643. [DOI] [PubMed] [Google Scholar]
- 44.Ponsioen C.Y., Reitsma J.B., Boberg K.M., Aabakken L., Rauws E.A., Schrumpf E. Validation of a cholangiographic prognostic model in primary sclerosing cholangitis. Endoscopy. 2010;42:742–747. doi: 10.1055/s-0030-1255527. [DOI] [PubMed] [Google Scholar]
- 45.Ergen F.B., Akata D., Sarikaya B., Kerimoglu U., Hayran M., Akhan O., Hussain H.K. Visualization of the biliary tract using gadobenate dimeglumine: preliminary findings. J. Comput. Assist Tomogr. 2008;32:54–60. doi: 10.1097/RCT.0b013e3180616b87. [DOI] [PubMed] [Google Scholar]
- 46.Nguyen L., Cazzagon N., Corpechot C., El Mouhadi S., Lemoinne S., Chazouillères O., Arrivé L. Intrahepatic cystic biliary dilatation constitutes a significant prognostic factor in patients with primary sclerosing cholangitis. Eur. Radio. 2019;29:1460–1468. doi: 10.1007/s00330-018-5697-3. [DOI] [PubMed] [Google Scholar]
- 47.Seo N., Kim S.Y., Lee S.S., Byun J.H., Kim J.H., Kim H.J., Lee M.G. Sclerosing Cholangitis: Clinicopathologic Features, Imaging Spectrum, and Systemic Approach to Differential Diagnosis. Korean J. Radio. 2016;17:25–38. doi: 10.3348/kjr.2016.17.1.25. [DOI] [PMC free article] [PubMed] [Google Scholar]
- 48.Liu Z.Y., Zhou Y.M., Shi L.H., Yin Z.F. Risk factors of intrahepatic cholangiocarcinoma in patients with hepatolithiasis: a case-control study. Hepatobiliary Pancreat. Dis. Int. 2011;10:626–631. doi: 10.1016/s1499-3872(11)60106-9. [DOI] [PubMed] [Google Scholar]
- 49.Su C.H., Shyr Y.M., Lui W.Y., P'Eng F.K. Hepatolithiasis associated with cholangiocarcinoma. Br. J. Surg. 1997;84:969–973. doi: 10.1002/bjs.1800840717. [DOI] [PubMed] [Google Scholar]
- 50.Kovač J.D., Ješić R., Stanisavljević D., Kovač B., Maksimovic R. MR imaging of primary sclerosing cholangitis: additional value of diffusion-weighted imaging and ADC measurement. Acta Radio. 2013;54:242–248. doi: 10.1177/0284185112471792. [DOI] [PubMed] [Google Scholar]
- 51.Revelon G., Rashid A., Kawamoto S., Bluemke D.A. Primary sclerosing cholangitis: MR imaging findings with pathologic correlation. Am. J. Roentgenol. 1999;173:1037–1042. doi: 10.2214/ajr.173.4.10511174. [DOI] [PubMed] [Google Scholar]
- 52.Kovacˇ J.D., Jesˇic R., Stanisavljevic D., Kovač B., Banko B., Seferović P., Maksimović R. Integrative role of MRI in the evaluation of primary biliary cirrhosis. Eur. Radio. 2012;22:688–694. doi: 10.1007/s00330-011-2296-y. [DOI] [PubMed] [Google Scholar]
- 53.Lewin M., Vilgrain V., Ozenne V., Lemoine M., Wendum D., Paradis V., Ziol M., Arrivé L., Beaugrand M., Poupon R., Valla D., Chazouillères O., Corpechot C. Prevalence of sclerosing cholangitis in adults with autoimmune hepatitis: a prospective magnetic resonance imaging and histological study. Hepatology. 2009;50:528–537. doi: 10.1002/hep.23024. [DOI] [PubMed] [Google Scholar]
- 54.Husarik D.B., Gupta R.T., Ringe K.I., Boll D.T., Merkle E.M. Contrast enhanced liver MRI in patients with primary sclerosing cholangitis: inverse appearance of focal confluent fibrosis on delayed phase MR images with hepatocyte specific versus extracellular gadolinium based contrast agents. Acad. Radiol. 2011;18:1549–1554. doi: 10.1016/j.acra.2011.08.007. [DOI] [PubMed] [Google Scholar]
- 55.de Vries E.M., Beuers U., Ponsioen C.Y. Biomarkers for disease progression of primary sclerosing cholangitis. Curr. Opin. Gastroenterol. 2015;31:239–246. doi: 10.1097/MOG.0000000000000163. [DOI] [PubMed] [Google Scholar]
- 56.Ehlken H., Wroblewski R., Corpechot C., Arrivé L., Lezius S., Hartl J., Denzer U.W., Lohse A.W., Chazouilleres O., Schramm C. Spleen size for the prediction of clinical outcome in patients with primary sclerosing cholangitis. Gut. 2016;65:1230–1232. doi: 10.1136/gutjnl-2016-311452. [DOI] [PubMed] [Google Scholar]
- 57.Aubé C., Racineux P.X., Lebigot J., Oberti F., Croquet V., Argaud C., Calès P., Caron C. [Diagnosis and quantification of hepatic fibrosis with diffusion weighted MR imaging: preliminary results] J. Radio. 2004;85:301–306. doi: 10.1016/s0221-0363(04)97582-8. [DOI] [PubMed] [Google Scholar]
- 58.Verloh N., Haimerl M., Zeman F., Schlabeck M., Barreiros A., Loss M., Schreyer A.G., Stroszczynski C., Fellner C., Wiggermann P. Assessing liver function by liver enhancement during the hepatobiliary phase with Gd-EOB-DTPA-enhanced MRI at 3 Tesla. Eur. Radio. 2014;24:1013–1019. doi: 10.1007/s00330-014-3108-y. [DOI] [PubMed] [Google Scholar]