

Abstract
Background:
The influence of cerebral edema and resultant secondary complications on the clinical outcome of traumatic brain injury (TBI) is well known. Clinical studies of brain water homeostasis dynamics in TBI are limited, which determines the relevance of our work. The purpose is to study changes in brain water homeostasis after TBI of varying TBI severity compared to corresponding cerebral microcirculation parameters.
Materials:
This non-randomized retrospective single-center study complies with the Helsinki Declaration for patient’s studies. The study included 128 patients with posttraumatic ischemia (PCI) after moderate-to-severe TBI in the middle cerebral artery territory who were admitted to the hospital between July 2015 and February 2022. PCI was evaluated by perfusion computed tomography (CT), and brain edema was determined using net water uptake (NWU) on baseline CT images. The patients were allocated according to Marshall’s classification. Multivariate linear regression models were performed to analyze data.
Results:
NWU in PCI areas were significantly higher than in patients with its absence (8.1% vs. 4.2%, accordingly; p < 0.001). In the multivariable regression analysis, the mean transit time increase was significantly and independently associated with higher NWU (R2 = 0.089, p < 0.01). In the PCI zone, cerebral blood flow, cerebral blood volume, and time to peak were not significantly associated with NWU values (p > 0.05). No significant differences were observed between the NWU values in PCI foci in different Marshall groups (p = 0.308).
Conclusion:
Marshall’s classification does not predict the progression of posttraumatic ischemia. The blood passage delays through the cerebral microvascular bed is associated with brain tissue water content increase in the PCI focus.
Keywords: Net water uptake, Posttraumatic ischemia
61.1. Introduction
One of the leading complications of moderate and severe traumatic brain injury (TBI) is the development of posttraumatic cerebral ischemia (PCI), accompanied by an increase in water content in and around the lesion [1]. Such a trajectory of the acute period leads to an increase in intracranial pressure and may result in dislocation and herniation of the brain stem. The worst scenario is malignant ischemic stroke development, the frequency of which, fortunately, does not exceed 3% [2].
At the same time, the several causes of its development remain poorly understood, making it difficult to predict and timely treat it. The main difficulty is distinguishing brain edema phenotypes—vasogenic and cytotoxic—as well as the scarcity of means for quantifying its formation in the early stages [3].
The midline shift is the simplest but not an accurate marker of cerebral edema development because it cannot adequately predict PCI formation in the first 24 h, but only at later stages, when the PCI becomes decompensated. And even in this case, the mechanisms of temporal PCI development remain unclear, especially in terms of primary brain damage severity [4]. The diagnosis of cerebral edema using non-contrast computed tomography (CT) is based on a brain density decrease in Hounsfield units.
In 2018, Brooks et al. proposed an innovative way to assess net water uptake (NWU) by comparing brain density in the ischemic and contralateral hemispheres [5].
Further studies have shown that an NWU increase can predict ischemia age and malignant brain edema development and serve as a marker of a poor cerebral collateral state [5].
A recent meta-analysis showed that NWU is a biomarker of malignant post-stroke cerebral edema development and DWI/FLAIR mismatch—a mismatch between diffusion-weighted imaging (DWI) and fluid-attenuated inversion recovery (FLAIR) magnetic resonance imaging [6].
Although CT scanners are widely available, non-contrast CT cannot distinguish between vasogenic and cytotoxic edema and, therefore, cannot be a reliable tool for PCI recognition [7].
Due to this, the NWU calculation from native CT faces several challenges because it depends on early ischemia identification zone and delineation [8].
However, some other sequences (e.g., multiphase perfusion CT [PCT]) can recognize cytotoxic edema areas, making them indispensable for cerebral ischemia detection [9].
Moreover, the combination NWU measurement–perfusion CT allows more accurate determination of the brain hydration status in the cerebral ischemia foci, which improves diagnosis and prognosis [10].
The brain water content assessment is still rare, even in cerebral strokes, and it has not yet been used to study PCI development [11]. This determines the relevance of our work.
The aim was to study brain water homeostasis changes in PCI foci at moderate-to-severe TBI compared to the cerebral microcirculation parameters.
61.2. Materials and Methods
61.2.1. Study Population
This retrospective observational, non-randomized single-center study was conducted as an analysis of a prospectively maintained database cohort (2015–2022). We analyzed 128 patients with moderate-to-severe traumatic brain injury and PCI.
Inclusion criteria were as follows:
Moderate-to-severe TBI within 6 h after head injury
Glasgow Coma Scale (GCS) less than 12 and more than 4
CT perfusion done within 5 days from the moment of injury
Unilateral PCI foci at perfusion computed tomography
The exclusion criteria were as follows:
Age less than 18 and more than 60 years.
GCS at admission to the clinic more than 12 points.
Gunshot and explosive skull and brain injuries.
Severity on the Injury Severity Score (ISS) scale more than 16 points.
PCI was determined using perfusion CT, and brain edema was determined using NWU on baseline CT images. The patients were divided according to Marshall’s classification. The protocol of the study was reviewed and approved by the Institutional Ethical Committee and conformed to the standards of the Declaration of Helsinki.
61.2.2. Image Acquisitions
All patients received multiphase perfusion CT (PCT) 2–7 days after admission on a 160-slice scanner (Canon Aquilion Prime SP, Canon Medical Imaging, Japan). The perfusion examination report included an initial contrast-free CT of the brain. Extended scanning was further performed of 16 “areas of interest,” 160 mm in thickness, within 60 s with a contrast agent. The scanning parameters were 160 kVp, 160 mA, 70 mAs, and 512 × 512. The contrast agent Ultravist 370 (Schering AG, Germany) was administered with a syringe injector (Stellant, Medrad, USA) into a peripheral vein through a standard catheter (20 G) at a rate of 4–5 mL/s in a dose of 30–50 mL per examination. After scanning, data were transferred to a picture archiving and communication system (KIR, Russia). PCT data were processed using Vitrea workstation (Vitrea FX, Vital Images, USA), where standard perfusion maps were built, including: cerebral blood volume (CBV), cerebral blood flow (CBF), mean transit time (MTT), time maximum (Tmax), and time-to-peak (TTP). Artery and vein marks were automatically recorded, followed by the manual control of indices in the time-concentration diagram. The region of interest (ROI) was established based on subcortical areas of the middle cerebral artery. Errors introduced by delay and dispersion of the contrast bolus before arrival in the cerebral circulation were corrected by the block-circulant deconvolution algorithm [12]. Quantitative perfusion indices, including CBF, were calculated on a voxel-wise basis and were used to generate color-coded maps. The voxels with CBF of more than 100 mL/100 g/min and/or CBV of more than 8 mL/100 g were assumed to contain large vessels and removed from the perfusion map calculation (Fig. 61.1).
Fig. 61.1.
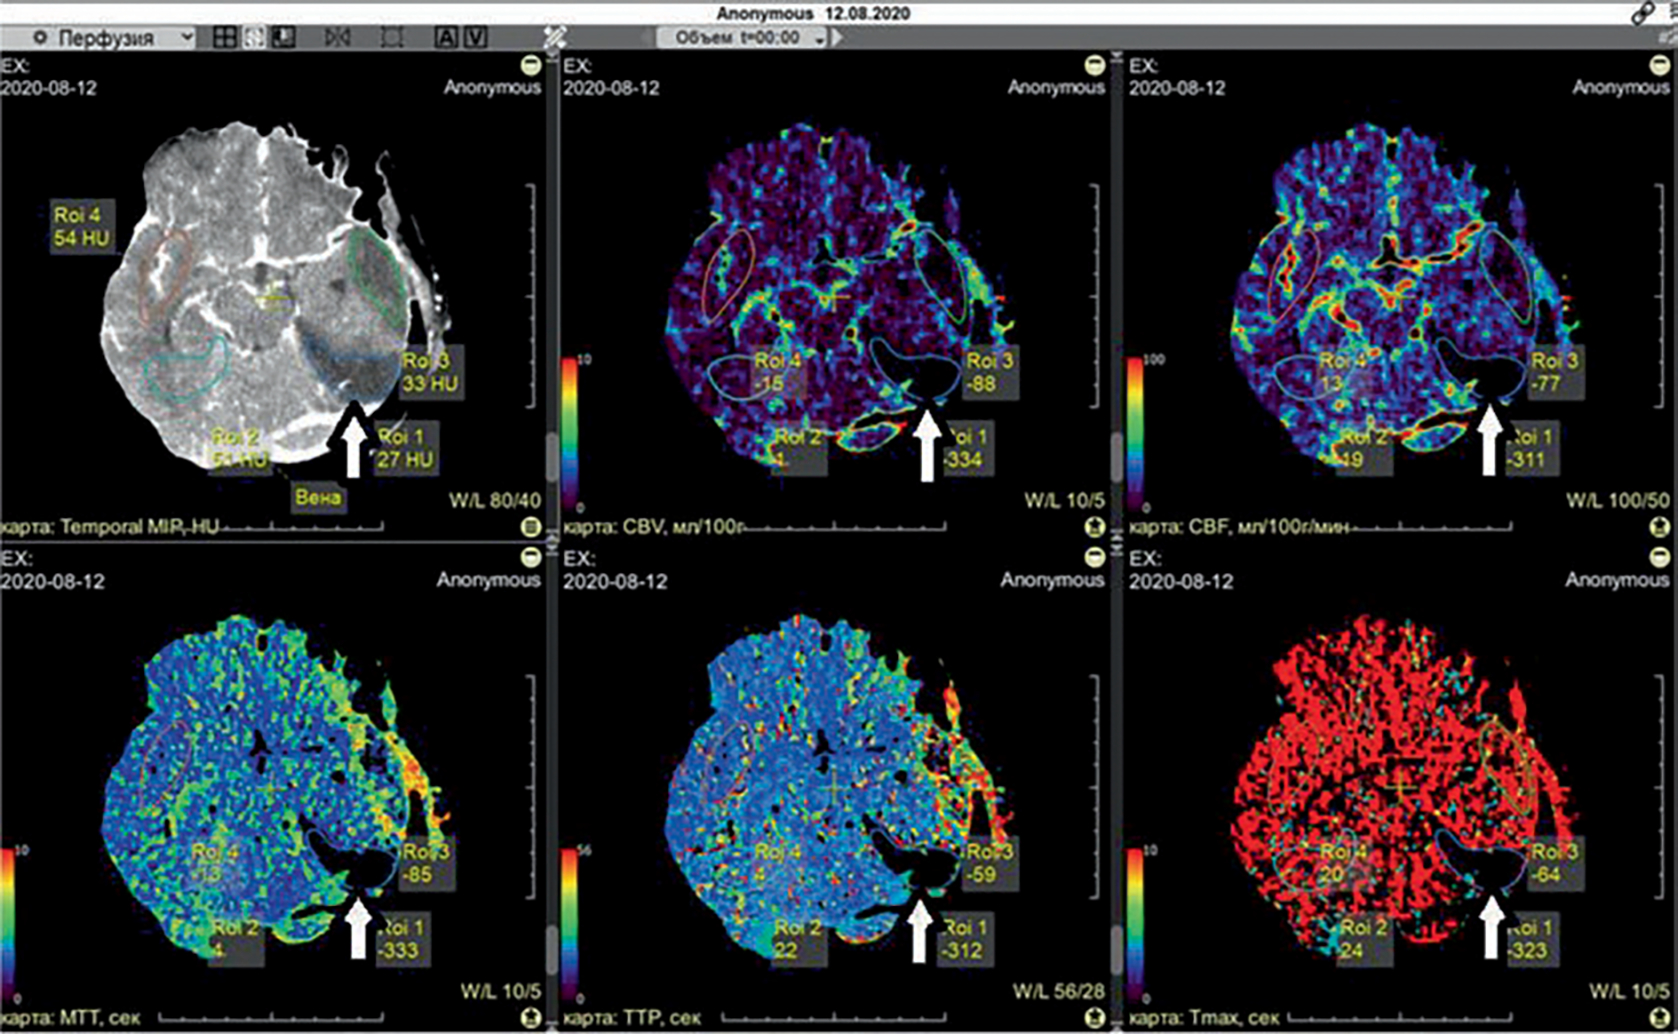
Perfusion maps in posttraumatic cerebral ischemia after TBI. White arrow indicates a zone of PCI in non-contrast CT and all maps: CBV, CBF, MTT, TTP, and Tmax. The thresholds of cerebral ischemia (core and penumbra) were as follows [13]: a CBV decrease <2.0 mL/100 g, or a CBV decrease <145% compared with the contralateral hemisphere
Net water uptake (NWU) was calculated using Formula 1 [12].
: the ischemic “core” density (Hounsfield unit, HU)
: the density of normal brain tissue in the symmetrical zone of the contralateral hemisphere (HU)
61.2.3. Statistical Analysis
The Shapiro-Wilk test was used to determine whether the data were normally distributed. Data are shown as mean ± standard deviation. Analysis of variance (ANOVA) models were performed to analyze data. Pearson’s correlation coefficients were used to assess agreement between computed variables. The regression line and confidence limits for each are for illustrative purposes only; p < 0.05 was considered statistically significant.
61.3. Results
NWU in PCI zones was significantly higher than in zones without PCI (8.1% versus 4.2%; p < 0.001).
In the PCI zone, PCT, CBF, CBV, and TTP were not significantly correlated with NWU values (p > 0.05).
Mean transit time increase in PCI zones was significantly and independently correlated with higher NWU (R2 = 0.089, p < 0.01; Fig. 61.2).
Fig. 61.2.
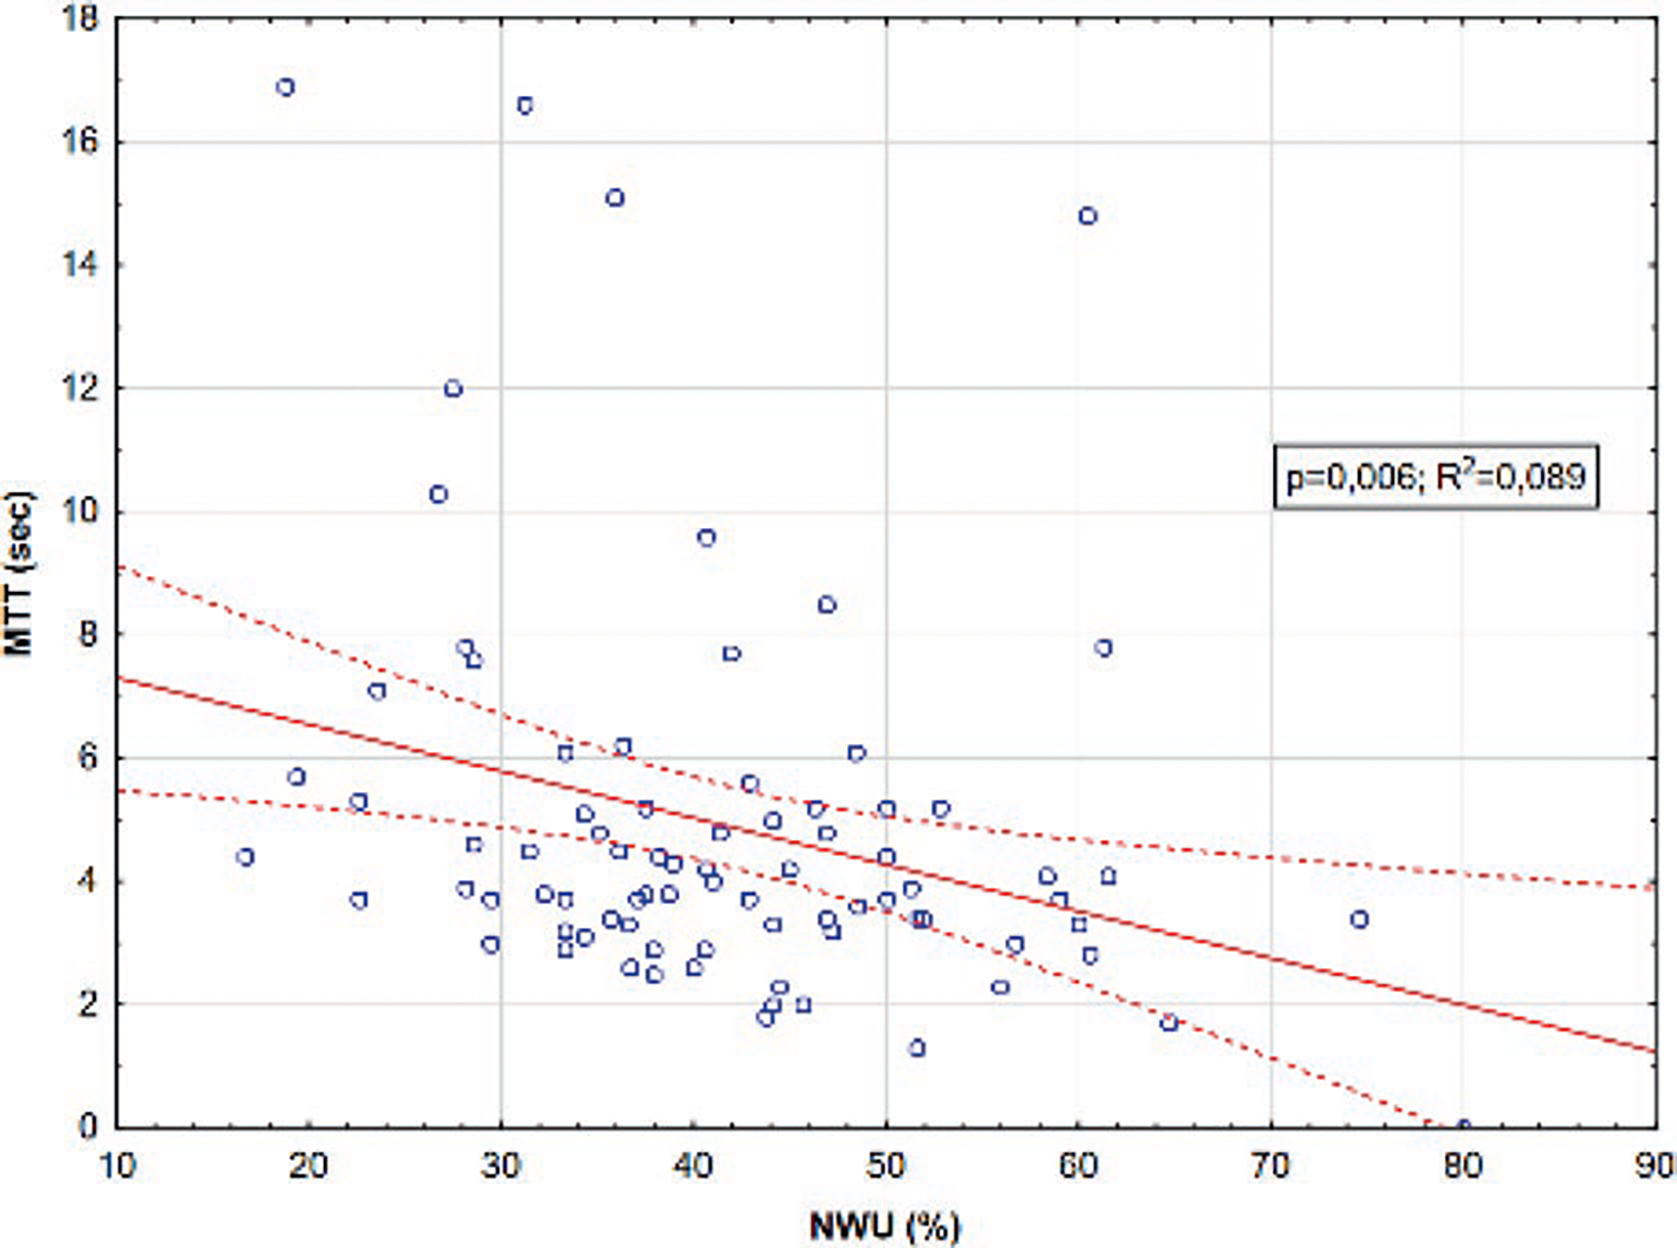
MTT in PCI zones plotted against NWU. Dashed red lines represent 95% confidence intervals for the regression (solid red line)
There were no significant differences between the NWU values in PCI foci in different Marshall groups (p = 0.308).
61.4. Discussion
The aim of our study was to assess net water uptake changes in relation with the cerebral microcirculation parameters at non-mild TBI.
The ANOVA showed no significant differences between the NWU values in PCI foci in different Marshall groups.
Earlier we considered that Marshall’s classification indicates PCI development. Still, it does not seem to be able to predict PCI progression because it does not consider the following factors: cerebral vasospasm, changes in cerebral microcirculation parameters (cerebrovascular resistance, cerebral arterial compliance, cerebrovascular time constant, and critical closing pressure), and the volume and localization of PCI foci, which play a significant role in PCI development [14].
We have shown that cerebral microcirculation impairments were significantly correlated with increased brain tissue water content in the PCI foci.
In our opinion, there were several reasons for this.
First, it has been shown earlier that PCI is developed against the backdrop of the blood-brain barrier permeability disorders that increase brain tissue water content [15].
Second, the venous outflow in the PCI focus decreases, which leads to “overlogging” of the microcirculatory bed and increases the NWU [16].
Third, as described earlier, the gradient between intravascular and extravascular (parenchymal) oncotic pressure in the ischemic focus makes a significant contribution to the increase in hydration in the lesion [17].
Most likely, it is a combination of all of the above mechanisms, but further studies need to clarify this.
Our study has several limitations. The first limitation includes the single-center, retrospective nature of our study and the lack of a control group. This might lead to a potential selection bias regarding PCI recognition.
The second limitation of the quantitative cerebral edema analysis using CT-densitometry was as follows: the volume-occupying lesions, the complex and time-consuming postprocessing, as well as significant CTP-artifacts.
The last limitation of this study is the unknown cerebral collateral circulation status, which might have an impact on secondary injury volumes. Furthermore, details on blood-pressure management, which might also affect the degree of secondary injury volumes, are unknown for this study.
61.5. Conclusion
The blood passage delay through the cerebral microvascular bed was significantly correlated with brain tissue hydration increase in the PCI focus. The Marshall’s classification does not seem to be able to predict the PCI progression of posttraumatic ischemia.
Acknowledgments
AT and KT were supported by a Grant-in-Aid for Exploratory Research from the Privolzhsky Research Medical University; DB was supported by NIH R01 NS112808.
Contributor Information
A. Trofimov, Department of Neurological Diseases, Privolzhsky, Research Medical University, Nizhny Novgorod, Russia
D. Agarkova, Department of Neurological Diseases, Privolzhsky, Research Medical University, Nizhny Novgorod, Russia
K. Trofimova, Department of Neurological Diseases, Privolzhsky, Research Medical University, Nizhny Novgorod, Russia
C. Lidji-Goryaev, Department of Neurological Diseases, Privolzhsky, Research Medical University, Nizhny Novgorod, Russia
D. Atochin, Cardiovascular Research Center, Massachusetts, General Hospital, Harvard Medical School, Charlestown, MA, USA
D. Bragin, Lovelace Biomedical Research Institute, Albuquerque, NM, USA Department of Neurology, University of New Mexico, School of Medicine, Albuquerque, NM, USA.
References
- 1.Kirsh E, Seiko N, Falcone GJ (2020) The genetic basis of cerebral edema in acute traumatic brain injury: an opportunity to discover a pathway. Neurosky Lett 730:135046. 10.1016/j.neulet.2020.135046 [DOI] [PMC free article] [PubMed] [Google Scholar]
- 2.Zhi-Ling C, Qi L, Jun-Yong Y, Bang-Qing Y (2022) The prevalence and risk factors of posttraumatic cerebral infarction in patients with traumatic brain injury: a systematic review and meta-analysis. Bioengineered 13(5):11706–11717. 10.1080/21655979.2022.2070999 [DOI] [PMC free article] [PubMed] [Google Scholar]
- 3.Kimberly WT, Battey TW, Wu O et al. (2016) New visualization markers ischemic cerebral edema and its association with neurological outcome. Acta Neurochir Suppl 121:223–226. 10.1007/978-3-319-18497-5_40 [DOI] [PubMed] [Google Scholar]
- 4.Battey TW, Karki M, Singhal AB et al. (2014) Cerebral edema predicts outcome after non-lacunary ischemic stroke. Stroke 45:3643–3648 [DOI] [PMC free article] [PubMed] [Google Scholar]
- 5.Broocks G, Flottmann F, Scheibel A et al. (2018) Quantitative lesion water uptake in acute stroke computed tomography is a predictor of malignant infarction. Stroke 49(8):1906–1912. 10.1161/STROKEAHA.118.020507 [DOI] [PubMed] [Google Scholar]
- 6.Broocks G, Kemmling A, Meyer L et al. (2019) Collateral computed tomography and angiography profile is directly related to the early rate of edema progression in acute ischemic stroke. Stroke 50:3424–3430 [DOI] [PubMed] [Google Scholar]
- 7.Broocks G, Leischner H, Hanning U et al. (2020) Lesion age imaging in acute stroke: water uptake in CT versus DWI-FLAIR mismatch. Ann Neurol 88(6):1144–1152. 10.1002/ana.25903 [DOI] [PubMed] [Google Scholar]
- 8.Avsenik J, Bajrović FF, Gradišek P et al. (2021) Prognostic value of CT perfusion and permeability imaging in traumatic brain injury. J Trauma Acute Care Surg 90(3):484–491. 10.1097/TA.0000000000002964 [DOI] [PubMed] [Google Scholar]
- 9.Ng FC, Yassi N, Sharma G et al. (2022) HERMES collaborators. Correlation between computed tomography-based tissue net water uptake and volumetric measures of cerebral edema after reperfusion therapy. Stroke 53(8):2628–2636. 10.1161/STROKEAHA.121.037073 [DOI] [PubMed] [Google Scholar]
- 10.Rigler I, Gspan T, Avsenik J et al. (2022) Independent significance of visual assessment of perfusion CT maps in anterior circulation stroke patients treated with mechanical thrombectomy. Clin Neuroradiol 32(3):829–837. 10.1007/s00062-022-01140-7 [DOI] [PubMed] [Google Scholar]
- 11.Haupt W, Meyer L, Wagner M et al. (2022) Assessment of irreversible tissue injury in extensive ischemic stroke-potential of quantitative cerebral perfusion. Transl Stroke Res. 10.1007/s12975-022-01058-9 [DOI] [PubMed] [Google Scholar]
- 12.Broocks G, Elsayed S, Kniep H et al. (2021) Early prediction of malignant cerebellar edema in posterior circulation stroke using quantitative lesion water uptake. Neurosurgery 88(3):531–537. 10.1093/neuros/nyaa438 [DOI] [PubMed] [Google Scholar]
- 13.Lin L, Bivard A, Kleinig T, Spratt NJ et al. (2018) Correction for delay and dispersion results in more accurate cerebral blood flow ischemic core measurement in acute stroke. Stroke 49:924–930. 10.1161/STROKEAHA.117.019562 [DOI] [PubMed] [Google Scholar]
- 14.Trofimov A, Dubrovin A, Martynov D et al. (2021) Microcirculatory biomarkers of secondary cerebral ischemia in traumatic brain injury. Acta Neurochir Suppl 131:3–5. 10.1007/978-3-030-59436-7_1 [DOI] [PMC free article] [PubMed] [Google Scholar]
- 15.Lin L, Bivard A, Krishnamurthy V et al. (2016) Whole-brain CT perfusion to quantify acute ischemic penumbra and core. Radiology 279:876–887. 10.1148/radiol.2015150319 [DOI] [PubMed] [Google Scholar]
- 16.Jungner M, Siemund R, Venturoli D et al. (2016) Blood-brain barrier permeability following traumatic brain injury. Minerva Anestesiol 82(5):525–533 [PubMed] [Google Scholar]
- 17.van Horn N, Heit JJ, Kabiri R et al. (2022) Venous outflow profiles are associated with early edema progression in ischemic stroke. Int J Stroke:17474930211065635. 10.1177/17474930211065635 [DOI] [PubMed] [Google Scholar]
- 18.Zusman BE, Kochanek PM, Jha RM (2022) Cerebral edema in traumatic brain injury: a historical framework for current therapy. Curr Treat Options Neurol 22(3):9. 10.1007/s11940-020-0614-x [DOI] [PMC free article] [PubMed] [Google Scholar]