Abstract
The ground vibration caused by rock blasting is an extremely hazardous outcome of the blasting operation. Blasting activity has detrimental effects on both the ecology and the human population living in proximity to the area. Evaluating the magnitude of blasting vibrations requires careful evaluation of the peak particle velocity (PPV) as a fundamental and essential parameter for quantifying vibration velocity. Therefore, this study employs models using the relevance vector machine (RVM) approach for predicting the PPV resulting from quarry blasting. This investigation utilized the conventional and optimized RVM models for the first time in ground vibration prediction. This work compares thirty-three RVM models to choose the most efficient performance model. The following conclusions have been mapped from the outcomes of the several analyses. The performance evaluation of each RVM model demonstrates each model achieved a performance of more than 0.85 during the testing phase, there was a strong correlation observed between the actual ground vibrations and the predicted ones. The analysis of performance metrics (RMSE = 21.2999 mm/s, 16.2272 mm/s, R = 0.9175, PI = 1.59, IOA = 0.8239, IOS = 0.2541), score analysis (= 93), REC curve (= 6.85E−03, close to the actual, i.e., 0), curve fitting (= 1.05 close to best fit, i.e., 1), AD test (= 11.607 close to the actual, i.e., 9.790), Wilcoxon test (= 95%), Uncertainty analysis (WCB = 0.0134), and computational cost (= 0.0180) demonstrate that PSO_DRVM model MD29 outperformed better than other RVM models in the testing phase. This study will help mining and civil engineers and blasting experts to select the best kernel function and its hyperparameters in estimating ground vibration during rock blasting project. In the context of the mining and civil industry, the application of this study offers significant potential for enhancing safety protocols and optimizing operational efficiency.
Keywords: Blasting, Genetic algorithm, Mining, Particle swarm optimization, PPV, Relevance vector machine
Subject terms: Engineering, Mathematics and computing
Introduction
Rock blasting is a frequently used and economically efficient method in the context of mining and civil engineering activities. Blasting is a widely employed technique in mining for obtaining metal and non-metal resources, such as in hard rock mining excavation and quarrying. During quarry operations, the process of blasting entails the systematic drilling of many rows of blast holes, each following to certain requirements for stemming, spacing, burden, sub-drill, face angle, bench height, and hole diameter1,2.
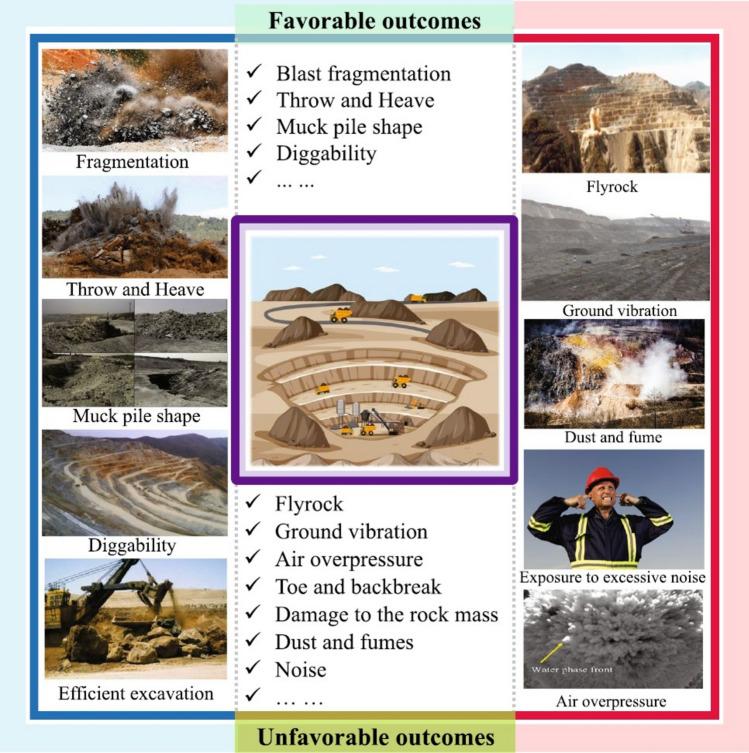
Different researchers like Fissha et al.3, underlines approximately 20–30% of the energy generated by the explosion is efficiently used to fragment the rock during blasting. The remaining energy is wasted in various ways, including back break, blasting vibration, fly rock, and air overpressure. The events mentioned have diverse environmental impacts and provide challenges for those living near the area where blasting occurs (Fig. 1). Among these impacts, ground vibration is particularly significant4–6. This phenomenon has the potential to inflict harm on physical constructions and eventually impact the lives and belongings of individuals, especially in cases when the buildings and structures were not specifically engineered to withstand the immense devastation caused by the explosion7,8. Explosive-induced ground vibrations have an impact on the development of plants and may result in the loss of forested areas. It also causes ground and slope instabilities, posing a risk to the safety of persons involved in loading, drilling, and subsequent blasting activities. In addition, individuals residing or working in close vicinity to the explosion site may experience physical discomfort as well as stress because of ground vibrations.
Fig. 1.
The favourable and unfavourable outcomes of rock blasting (Source:9).
Based on Hosseini et al.10, ground vibration is caused by the energy released during an explosion. The magnitude of the vibration is influenced by several variables, such as the quantity of explosives used, the composition of the rock being exploded, and the distance from the blast source. Lawal et al.11, state that the strength of the ground vibration caused by explosions is linked to both the factors that can be controlled and those that cannot be controlled during the blasting process. The adjustable parameters for blasting, such as burden, spacing, blast hole depth, hole diameter, stemming type and height, maximum charge weight per delay (W), specific charge, explosive type, detonation velocity (VoD), and powder factor, can be easily adjusted and are meticulously planned according to the current conditions. Hence, it is incumbent upon the blasting engineer to calibrate and formulate these components while devising the blasting methodology.
The uncontrolled variables of the rock include the mechanical and physical properties of the rock, as well as the geological features of the surrounding environment; most uncontrolled factors are contingent upon the rock's inherent creation12–14.
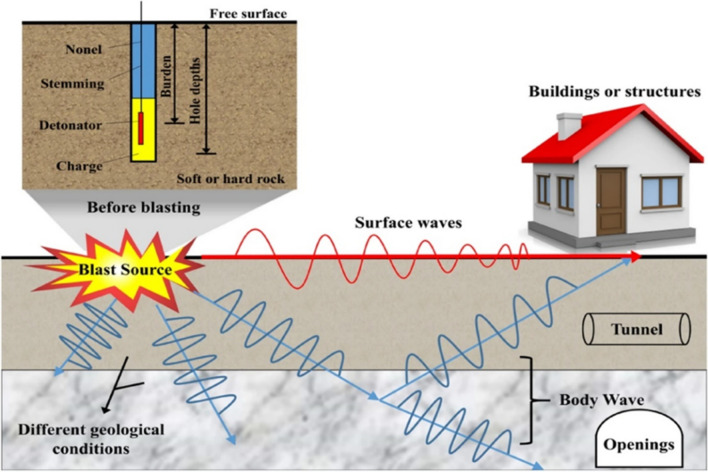
Mostly the ground vibration movement has a wave-like pattern that propagates in a radial direction away from the blasting source11,15. Figure 2 shows the movement of waves during blasting vibration. This wave motion has similarity to the circular ripples that propagate outward when an object hits into a body of water and comes into contact. The PPV is the main parameter utilised to assess the magnitude of ground vibration resulting from blasting activities. PPV represents the velocity of the primary particles in terms of their transverse (T), vertical (V), and longitudinal (L) velocity.
Fig. 2.
Propagation of ground vibration wave during rock blasting (Source:16).
Several scientists have established empirical formulae to anticipate the amplitude of blast-induced ground vibration coming from blasting operations. One of the earliest and most important equations to estimate PPV was developed by the USBM, Duvall, and Fogleson17–19. After many years, numerous academics produced adjustments to the USBM formula, considering the scaled distance and MC. The mathematical formulation of these techniques is found in Table 1. However, the precision of the predictive model, the assessment of the complex nature of the rock mass conditions and input data parameters, and other factors contribute to the increased difficulty and time required for predicting and estimating blasting vibration. Hence, empirical models are inadequate due to the constraints imposed by their empirical formulations.
Table 1.
Empirical equations applicable for the prediction of blast-induced vibrations.
| Name of empirical formula | Empirical equations |
|---|---|
| Duvall and Fogleson (USBM) | |
| Ambraseys and Hendron | |
| Langefors and Kihlstrom | |
| Indian standards |
D is the distance from the blasting face to the monitoring station (m), PPV is the peak particle velocity (mm/s), and Q is the maximum instantaneous charge (kg), whereas k and b are the site constants; each site has its site constants (k and b).
With the advent of digitalization, numerous researchers have begun employing artificial intelligence techniques such as machine learning, and deep learning methodologies to forecast blast-induced ground vibrations. The study by Hosseini et al.10, aims to analyse advanced deep learning, machine learning, and hybrid learning methods to provide an appropriate computational model for quantifying ground vibrations in mining blasting activities. The ANN, LSTM, ET, LSSVM, DT, SVM, GPR, and MLR models are utilised with a dataset consisting of 162 data points. The new black hole-optimized LSTM model has been utilised for the initial time to predict ground vibrations resulting from blasting. 15 performance metrics have been devised to precisely evaluate the predicting capabilities of different ML models. Table 2 presents a brief overview of the most recent research on utilising machine learning to predict ground vibrations.
Table 2.
Provides an overview of several machine learning models discussed in the literature review. The bold letters represent the most optimal soft computing model in the research.
| Authors | AI technique | Number of datapoints | Details of input variables | R2 test | |
|---|---|---|---|---|---|
| Variables | No. | ||||
| Nguyen et al.20 | SSO-ELM | 216 | B/S, DI, ST, MC, PF, HD, RQD, N, SD | 9 | 0.91 |
| Zhang et al.21 | RF, CART, CHAID | 102 | DI, MC | 2 | 0.94 |
| Zhou et al.22 | RF | 102 | DI, MC, PF, B, S, HD | 6 | 0.93 |
| Huang et al.23 | FA-ANN | 88 | DI, MC, B, S, N | 5 | 0.91 |
| Zhou et al.24 | GEP-MC | 102 | B/S, DI, ST, MC, PF, HD | 6 | 0.91 |
| Nguyen et al.25 | SVR-GA | 125 | DI, MC | 2 | 0.99 |
| Nguyen et al.26 | HKM-CA | 136 | DI, MC | 2 | 0.99 |
| Armaghani et al.27 | ICA | 73 | B, S, ST, D, HD, PF, MC, DI | 8 | 0.95 |
| Hasanipanah et al.28 | CART | 86 | DI, MC | 2 | 0.95 |
| Ghoraba et al.29 | ANN, ANFIS | 115 | DI, MC | 2 | 0.95 |
| Shirani Faradonbeh et al.30 | GEP | 102 | DI, MC | 2 | 0.88 |
| Hajihassani et al.31 | ICA-ANN | 95 | MC, DI, TC | 3 | 0.98 |
| Hajihassani et al.32 | PSO-ANN | 88 | BS, ST, PF, MC, DI, Vp, E | 7 | 0.89 |
| Hasanipanah et al.33 | SVM | 80 | RD, E, UCS, TS, Js, B, S, HD/B, SC, ST, DPR, DI | 12 | 0.96 |
| Armaghani et al.34 | ANFIS | 109 | BS, MC, HD, ST, SD, DI, PF, RQD | 8 | 0.97 |
| Armaghani et al.35 | PSO-ANN | 44 | B, S, ST, N, MC, DI | 6 | 0.94 |
| Mohamadnejad et al.36 | SVM, ANN | 37 | DI, MC | 2 | 0.89 |
| Monjezi et al.37 | ANN | 182 | CD, DI, ST, HD | 4 | 0.95 |
| Mohamed38 | ANN, FIS | 162 | DI, MC | 2 | 0.94 |
| Fişne et al.39 | FIS | 33 | DI, MC | 2 | 0.92 |
| Iphar et al.40 | ANFIS | 42 | DI, CD | 2 | 0.99 |
Novelty of the research
The present investigation has the following novelty.
The present study analyses and employs the capabilities of RVM models in assessing and predicting ground vibration for the first time.
This study compares the conventional RVM models configured by Laplacian, linear, Gaussian, exponential, sigmoid, and polynomial kernels. In addition, these models have been enhanced by the application of both genetic and particle swarm optimisation algorithms. Also, the comparison of conventional, genetic, and particle swarm-optimized single kernel-based RVM models reveals the impact of optimization on the accuracy and performance of RVM models.
This investigation employs dual kernel (k1 + k2) RVM models (k1 kernel is selected from the comparison of non-optimized single kernel RVM models). Thus, this research employs five dual kernels based RVM models and optimizes them using each genetic and particle swarm optimization algorithm.
Fifteen metrics, WI, LMI, RSR, MBE, NMBE, NS, BF, PI, VAF, MAPE, R, MAE, WMAPE, RMSE, IOS, IOA, and a20, evaluate the performance and precision of each model and showcase the dependability of the models.
Research significance
This study addresses the significant issue of blast-induced ground vibrations in sectors like mining and construction. Conventional models see (Table 1) often fall short due to oversimplified approaches. By employing relevance vector machines (RVM), this research offers a novel method to precisely analyse vibrations, considering complex relationships and uncertainties. This not only advances academic understanding but also provides practical insights for risk assessment and mitigation. The flexibility of the proposed model makes it valuable for various blasting scenarios, benefiting engineers, policymakers, and researchers in addressing environmental and structural impacts.
The rest of the paper is organized as follows: the research methodology of this study is provided in “Research methodology”, and details regarding the datasets and preprocessing, data analysis, and developing soft computing approaches are included in “Data analysis and soft computing approaches”. Section “Results and discussion” outlines the results and discussions of the RVM model predictions and the results of the different statistical analyses. The key conclusions and remarks from the research and their implications are presented in “Conclusion and summary”.
Research methodology
This study presents an optimised performance model for accurately predicting ground vibration caused by blasting using several RVM models. Two hundred datasets have been gathered from published work by Hammed et al.41 to test, train, and validate the RVM models. The data is collected from ten quarry sites in Nigeria. The dataset consists of different variables such as charge weight (W) in Kg, monitoring distance (D) in meters, scaled distance (SD) in m/kg½, and peak particle velocity (PPV) in mm/s. In this study, the PPV is the target output of the investigation hence we consider one vector sum PPV only because the data set from the literature consists of three different PPVs based on their vectorial direction such as longitudinal, vertical, and transverse. PPV by default it is a vector quantity so, it follows vector sum. The data set of this study is summarised in Table 3, as follows.
Table 3.
Total datasets of ground vibration measurements and design parameters for blasting from the ten-quarry site in Nigeria.
| Data monitoring points | Distance (m) | Charge per delay (kg) | Scaled distance (m/kg½) | PPV (mm/s) | Peak particle velocity (mm/s) | ||
|---|---|---|---|---|---|---|---|
| Vertical PPV (mm/s) | Longitudinal PPV (mm/s) | Transvers PPV (mm/s) | |||||
| 1 | 300 | 1850 | 6.97 | 189.46 | 110.5 | 109.45 | 108.2 |
| 2 | 350 | 1850 | 8.14 | 149.16 | 86.25 | 85.95 | 86.15 |
| 3 | 400 | 1875 | 9.24 | 122.17 | 70.45 | 71.25 | 69.65 |
| 4 | 450 | 1950 | 10.2 | 104.3 | 60.2 | 60.35 | 60.1 |
| 5 | 500 | 1950 | 11.32 | 87.1 | 50.9 | 50.2 | 49.75 |
| 6 | 550 | 1950 | 12.46 | 75.46 | 43.7 | 43.85 | 43.15 |
| 7 | 600 | 1950 | 13.59 | 68.68 | 39.5 | 40.5 | 38.95 |
| 8 | 650 | 1875 | 15.01 | 56.32 | 32.35 | 32.75 | 32.45 |
| 9 | 700 | 1875 | 16.17 | 48.74 | 28.8 | 27.5 | 28.1 |
| 10 | 750 | 1875 | 17.32 | 43.62 | 25.75 | 24.95 | 24.85 |
| 11 | 800 | 1912.5 | 18.29 | 40.48 | 23.6 | 22.65 | 23.85 |
| 12 | 850 | 1912.5 | 19.44 | 36.69 | 21.45 | 21.15 | 20.95 |
| 13 | 900 | 1912.5 | 20.58 | 33.81 | 19.55 | 19.15 | 19.85 |
| 14 | 950 | 1900 | 21.79 | 31.23 | 17.85 | 18.95 | 17.25 |
| 15 | 1000 | 1875 | 23.09 | 28.21 | 16.25 | 16.85 | 15.75 |
| 16 | 1050 | 2950 | 19.33 | 36.7 | 21.65 | 20.75 | 21.15 |
| 17 | 1100 | 1800 | 25.93 | 22.98 | 13.5 | 13.05 | 13.25 |
| 18 | 1150 | 2750 | 21.93 | 30.99 | 17.65 | 18.75 | 17.25 |
| 19 | 1200 | 2150 | 25.88 | 23.42 | 13.55 | 13.05 | 13.95 |
| 20 | 1250 | 2050 | 27.61 | 21.08 | 12.2 | 11.75 | 12.55 |
| 21 | 300 | 1450 | 7.88 | 156.95 | 90.85 | 90.75 | 90.25 |
| 22 | 350 | 1450 | 9.19 | 100.94 | 71.05 | 71.3 | 70.95 |
| 23 | 400 | 1400 | 10.69 | 96.18 | 55.75 | 55.75 | 55.08 |
| 24 | 450 | 1450 | 11.82 | 82.13 | 47.5 | 47.4 | 47.35 |
| 25 | 500 | 1400 | 13.36 | 67.64 | 39.05 | 39.15 | 38.95 |
| 26 | 550 | 1500 | 14.2 | 60.63 | 35.45 | 35.55 | 35.75 |
| 27 | 600 | 1200 | 17.32 | 45.63 | 25.7 | 25.85 | 27.45 |
| 28 | 650 | 1850 | 15.11 | 55.48 | 32.05 | 32 | 32.05 |
| 29 | 700 | 1850 | 16.27 | 49.19 | 28.4 | 28.45 | 28.35 |
| 30 | 750 | 950 | 24.33 | 25.81 | 14.95 | 14.9 | 14.85 |
| 31 | 800 | 1350 | 21.77 | 30.8 | 17.8 | 17.7 | 17.85 |
| 32 | 850 | 1250 | 24.04 | 26.33 | 15.25 | 15.2 | 15.15 |
| 33 | 900 | 1250 | 25.46 | 23.51 | 13.95 | 13.8 | 12.95 |
| 34 | 950 | 1500 | 24.53 | 25.32 | 14.75 | 14.85 | 14.25 |
| 35 | 1000 | 1500 | 25.82 | 23.3 | 13.5 | 13.25 | 13.35 |
| 36 | 1050 | 1750 | 25.1 | 24.39 | 14.25 | 13.95 | 14.05 |
| 37 | 1100 | 2350 | 22.69 | 28.32 | 16.75 | 16.05 | 16.25 |
| 38 | 1150 | 1350 | 31.3 | 17.26 | 10 | 9.85 | 10.05 |
| 39 | 1200 | 1450 | 31.51 | 16.75 | 9.9 | 9.85 | 9.25 |
| 40 | 1250 | 2755 | 23.81 | 26.36 | 15.5 | 15.2 | 14.95 |
| 41 | 300 | 1650 | 7.39 | 174.16 | 100.75 | 101.05 | 99.85 |
| 42 | 350 | 1550 | 8.89 | 128.35 | 74.9 | 73.45 | 73.95 |
| 43 | 400 | 1355 | 10.89 | 94.17 | 54.3 | 54.95 | 53.85 |
| 44 | 450 | 1555 | 11.22 | 86.63 | 50.25 | 49.75 | 50.05 |
| 45 | 500 | 1850 | 11.62 | 83.8 | 48.75 | 48.35 | 48.05 |
| 46 | 550 | 1900 | 12.62 | 62.24 | 35.95 | 36.15 | 36.95 |
| 47 | 600 | 1400 | 16.03 | 50.67 | 29.15 | 29.75 | 28.85 |
| 48 | 650 | 1100 | 19.6 | 36.17 | 21.15 | 20.55 | 20.95 |
| 49 | 700 | 1250 | 19.8 | 34.77 | 20.8 | 21.05 | 20.1 |
| 50 | 750 | 1500 | 19.3 | 36.41 | 21.55 | 20.45 | 21.05 |
| 51 | 800 | 1800 | 18.86 | 38.42 | 22.45 | 22.1 | 21.95 |
| 52 | 850 | 1950 | 19.25 | 36.85 | 21.75 | 20.65 | 20.05 |
| 53 | 900 | 1250 | 25.46 | 23.42 | 13.9 | 13.1 | 13.55 |
| 54 | 950 | 1250 | 26.87 | 21.25 | 12.75 | 11.95 | 12.1 |
| 55 | 1000 | 1200 | 28.88 | 18.62 | 10.75 | 11.05 | 10.45 |
| 56 | 1050 | 1950 | 23.78 | 26.58 | 15.5 | 14.55 | 15.95 |
| 57 | 1100 | 1800 | 25.93 | 22.73 | 13.05 | 13.55 | 12.75 |
| 58 | 1150 | 1800 | 27.11 | 21.17 | 12.55 | 11.85 | 12.25 |
| 59 | 1200 | 1800 | 28.28 | 19.44 | 11.75 | 10.65 | 11.25 |
| 60 | 1250 | 1950 | 28.31 | 18.83 | 10.25 | 11.75 | 10.55 |
| 61 | 300 | 1600 | 7.5 | 191.01 | 110.44 | 110.42 | 109.98 |
| 62 | 350 | 1450 | 9.19 | 142.44 | 82.24 | 82.26 | 82.22 |
| 63 | 400 | 1850 | 9.3 | 140 | 80.85 | 80.81 | 80.83 |
| 64 | 450 | 1700 | 10.91 | 111.06 | 64.1 | 64.15 | 64.12 |
| 65 | 500 | 1300 | 13.87 | 78.29 | 45.3 | 44.95 | 45.35 |
| 66 | 550 | 1750 | 13.15 | 84.74 | 48.94 | 48.85 | 48.98 |
| 67 | 600 | 1950 | 13.59 | 80.79 | 46.66 | 46.65 | 46.62 |
| 68 | 650 | 1800 | 15.32 | 68.04 | 39.2 | 39.25 | 39.4 |
| 69 | 700 | 1200 | 20.21 | 45.44 | 26.24 | 26.15 | 26.32 |
| 70 | 750 | 1150 | 22.12 | 39.85 | 23.02 | 22.95 | 23.05 |
| 71 | 800 | 1650 | 19.69 | 47.11 | 27.24 | 27.15 | 27.2 |
| 72 | 850 | 1050 | 26.23 | 30.65 | 17.98 | 17.85 | 17.25 |
| 73 | 900 | 1850 | 20.92 | 42.93 | 24.95 | 24.55 | 24.85 |
| 74 | 950 | 1300 | 26.35 | 28.87 | 17.86 | 17.65 | 17.95 |
| 75 | 1000 | 1950 | 22.65 | 38.37 | 22.25 | 22.05 | 22.15 |
| 76 | 1050 | 1100 | 31.66 | 23.55 | 13.69 | 13.45 | 13.65 |
| 77 | 1100 | 1250 | 31.11 | 24.15 | 14.03 | 13.85 | 13.95 |
| 78 | 1150 | 1350 | 31.3 | 23.8 | 13.91 | 13.45 | 13.85 |
| 79 | 1200 | 1500 | 30.98 | 24.29 | 14.12 | 13.9 | 14.05 |
| 80 | 1250 | 1750 | 29.88 | 25.74 | 14.88 | 14.8 | 14.9 |
| 81 | 300 | 1500 | 7.75 | 182.33 | 105.61 | 104.95 | 105.24 |
| 82 | 350 | 1950 | 7.93 | 175.74 | 101.52 | 101.32 | 101.55 |
| 83 | 400 | 1850 | 9.3 | 129.45 | 77.11 | 77 | 69.88 |
| 84 | 450 | 1100 | 13.57 | 69.715 | 40.27 | 40.15 | 40.33 |
| 85 | 500 | 1050 | 15.43 | 55.67 | 32.28 | 31.98 | 32.17 |
| 86 | 550 | 1750 | 13.15 | 73.31 | 42.51 | 42.02 | 42.45 |
| 87 | 600 | 1200 | 17.32 | 45.77 | 26.46 | 26.39 | 26.42 |
| 88 | 650 | 1400 | 17.37 | 45.6 | 26.33 | 26.3 | 26.35 |
| 89 | 700 | 1700 | 16.98 | 47.42 | 27.39 | 27.32 | 27.43 |
| 90 | 750 | 1350 | 20.41 | 34.38 | 19.95 | 19.75 | 19.84 |
| 91 | 800 | 1800 | 18.86 | 39.54 | 22.86 | 22.84 | 22.79 |
| 92 | 850 | 1300 | 23.57 | 26.87 | 15.57 | 15.45 | 15.52 |
| 93 | 900 | 1550 | 22.86 | 28.39 | 16.42 | 16.35 | 16.4 |
| 94 | 950 | 1200 | 27.42 | 20.83 | 12 | 12.05 | 12.02 |
| 95 | 1000 | 1950 | 22.65 | 28.85 | 16.69 | 16.66 | 16.62 |
| 96 | 1050 | 1900 | 24.09 | 26.02 | 15 | 15.05 | 15.02 |
| 97 | 1100 | 1100 | 33.17 | 13.94 | 8.66 | 8.59 | 8.62 |
| 98 | 1150 | 1400 | 30.74 | 15.36 | 8.87 | 8.89 | 8.84 |
| 99 | 1200 | 1550 | 30.48 | 17.4 | 10.01 | 10.05 | 10.08 |
| 100 | 1250 | 1650 | 30.77 | 15.01 | 9.85 | 9.79 | 9.81 |
| 101 | 300 | 1400 | 8.02 | 198.71 | 114.7 | 114.75 | 114.72 |
| 102 | 350 | 1250 | 9.9 | 146.44 | 84.85 | 84.82 | 83.97 |
| 103 | 400 | 1600 | 10 | 144.37 | 83.63 | 82.98 | 83.45 |
| 104 | 450 | 1150 | 13.27 | 96.67 | 55.81 | 55.78 | 55.84 |
| 105 | 500 | 1000 | 15.81 | 75.27 | 43.44 | 43.41 | 43.52 |
| 106 | 550 | 2050 | 12.15 | 109.62 | 63.32 | 63.25 | 63.3 |
| 107 | 600 | 1350 | 16.33 | 71.75 | 41.48 | 41.35 | 41.44 |
| 108 | 650 | 1250 | 18.38 | 60.52 | 35.01 | 34.85 | 34.96 |
| 109 | 700 | 1650 | 17.23 | 64.28 | 38.4 | 38.38 | 34.42 |
| 110 | 750 | 1250 | 21.21 | 49.38 | 28.53 | 28.49 | 28.51 |
| 111 | 800 | 1900 | 18.35 | 60.73 | 35.1 | 35.03 | 35.06 |
| 112 | 850 | 1350 | 23.13 | 43.65 | 25.21 | 25.14 | 25.26 |
| 113 | 900 | 1300 | 24.96 | 39.16 | 22.61 | 22.63 | 22.58 |
| 114 | 950 | 1700 | 23.04 | 43.85 | 25.35 | 25.29 | 25.31 |
| 115 | 1000 | 1550 | 25.4 | 38.26 | 22.05 | 22.12 | 22.09 |
| 116 | 1050 | 1650 | 25.85 | 37.24 | 21.51 | 21.46 | 21.54 |
| 117 | 1100 | 1500 | 28.4 | 32.49 | 18.8 | 18.75 | 18.72 |
| 118 | 1150 | 1250 | 32.53 | 26.73 | 15.48 | 15.39 | 15.43 |
| 119 | 1200 | 1450 | 31.51 | 27.95 | 16.2 | 16.08 | 16.13 |
| 120 | 1250 | 1750 | 29.88 | 30.26 | 17.48 | 17.42 | 17.51 |
| 121 | 300 | 1050 | 9.26 | 247.53 | 142.91 | 142.94 | 142.89 |
| 122 | 350 | 1150 | 10.32 | 217.742 | 125.71 | 125.69 | 125.74 |
| 123 | 400 | 1250 | 11.31 | 195.31 | 112.8 | 112.72 | 112.77 |
| 124 | 450 | 1400 | 12.03 | 181.15 | 104.95 | 104.91 | 103.89 |
| 125 | 500 | 1450 | 13.13 | 163.81 | 94.62 | 94.58 | 94.53 |
| 126 | 550 | 1300 | 15.25 | 137.41 | 79.28 | 79.34 | 79.38 |
| 127 | 600 | 1450 | 15.76 | 131.94 | 76.31 | 75.95 | 76.26 |
| 128 | 650 | 1350 | 17.69 | 115.29 | 66.56 | 66.51 | 66.62 |
| 129 | 700 | 1650 | 17.23 | 118.47 | 68.65 | 67.93 | 68.62 |
| 130 | 750 | 1500 | 19.36 | 103.57 | 59.83 | 59.87 | 59.68 |
| 131 | 800 | 1100 | 24.12 | 79.86 | 46.17 | 46.1 | 46.05 |
| 132 | 850 | 1000 | 26.88 | 70.28 | 40.63 | 40.57 | 40.53 |
| 133 | 900 | 1300 | 24.96 | 76.87 | 44.34 | 44.39 | 44.42 |
| 134 | 950 | 1200 | 27.42 | 68.66 | 39.68 | 39.6 | 39.65 |
| 135 | 1000 | 1700 | 24.25 | 79.37 | 45.87 | 45.83 | 45.78 |
| 136 | 1050 | 1600 | 26.25 | 72.26 | 41.78 | 41.66 | 41.72 |
| 137 | 1100 | 1100 | 33.17 | 54.88 | 31.71 | 31.7 | 31.64 |
| 138 | 1150 | 1050 | 35.49 | 50.59 | 29.27 | 29.15 | 29.21 |
| 139 | 1200 | 1350 | 32.66 | 55.9 | 32.29 | 32.35 | 32.19 |
| 140 | 1250 | 1250 | 35.36 | 50.84 | 29.4 | 29.34 | 29.31 |
| 141 | 300 | 1550 | 7.62 | 138.28 | 79.83 | 79.8 | 79.88 |
| 142 | 350 | 1600 | 8.75 | 105.96 | 61.13 | 61.22 | 61.18 |
| 143 | 400 | 1650 | 9.85 | 84.19 | 48.67 | 48.53 | 48.62 |
| 144 | 450 | 1450 | 11.82 | 59.22 | 34.23 | 34.15 | 34.2 |
| 145 | 500 | 1950 | 11.32 | 64.51 | 37.17 | 37.32 | 37.24 |
| 146 | 550 | 1750 | 13.15 | 48.27 | 27.86 | 27.91 | 27.83 |
| 147 | 600 | 1550 | 15.24 | 36.21 | 20.95 | 20.87 | 20.9 |
| 148 | 650 | 1250 | 18.38 | 25.24 | 14.59 | 14.5 | 14.63 |
| 149 | 700 | 1350 | 19.05 | 23.5 | 13.62 | 13.57 | 13.51 |
| 150 | 750 | 1450 | 19.7 | 22.11 | 12.77 | 12.7 | 12.82 |
| 151 | 800 | 1450 | 21.01 | 19.45 | 11.27 | 11.22 | 11.19 |
| 152 | 850 | 1500 | 21.95 | 18 | 10.36 | 10.42 | 10.39 |
| 153 | 900 | 1600 | 22.5 | 17 | 9.88 | 9.75 | 9.82 |
| 154 | 950 | 1350 | 25.86 | 13.07 | 7.55 | 7.48 | 7.61 |
| 155 | 1000 | 1250 | 28.28 | 10.98 | 6.35 | 6.27 | 6.4 |
| 156 | 1050 | 1050 | 32.4 | 8.35 | 4.89 | 4.81 | 4.76 |
| 157 | 1100 | 1100 | 33.17 | 8 | 4.67 | 4.55 | 4.63 |
| 158 | 1150 | 1250 | 32.53 | 8.33 | 4.85 | 4.8 | 4.78 |
| 159 | 1200 | 1600 | 30 | 9.75 | 5.67 | 5.59 | 5.62 |
| 160 | 1250 | 1750 | 29.88 | 9.98 | 5.71 | 5.76 | 5.82 |
| 161 | 300 | 1200 | 8.66 | 183.69 | 106 | 106.12 | 106.04 |
| 162 | 350 | 1150 | 10.32 | 144.06 | 83.21 | 83.12 | 83.19 |
| 163 | 400 | 1800 | 9.43 | 163.19 | 94.28 | 94.15 | 94.22 |
| 164 | 450 | 1850 | 10.46 | 141.31 | 81.66 | 81.58 | 81.52 |
| 165 | 500 | 1950 | 11.32 | 126.9 | 73.22 | 73.27 | 73.31 |
| 166 | 550 | 1450 | 14.44 | 90.52 | 52.33 | 52.26 | 52.2 |
| 167 | 600 | 1350 | 16.33 | 76.51 | 44.18 | 44.25 | 44.09 |
| 168 | 650 | 1450 | 17.07 | 71.97 | 41.56 | 41.48 | 41.61 |
| 169 | 700 | 1500 | 18.07 | 66.52 | 38.4 | 38.35 | 38.46 |
| 170 | 750 | 1750 | 17.93 | 67.26 | 38.83 | 38.79 | 38.88 |
| 171 | 800 | 1650 | 19.69 | 59.02 | 34.11 | 33.92 | 34.19 |
| 172 | 850 | 1700 | 20.62 | 55.49 | 32.03 | 32.11 | 31.98 |
| 173 | 900 | 1750 | 21.51 | 52.42 | 30.2 | 30.32 | 30.27 |
| 174 | 950 | 1600 | 23.75 | 45.55 | 26.34 | 26.25 | 26.3 |
| 175 | 1000 | 1850 | 23.25 | 46.77 | 27.13 | 26.85 | 27.02 |
| 176 | 1050 | 1400 | 28.06 | 36.12 | 20.93 | 20.79 | 20.84 |
| 177 | 1100 | 1450 | 28.89 | 34.93 | 20.11 | 20.23 | 20.16 |
| 178 | 1150 | 1350 | 31.3 | 31.35 | 18 | 18.19 | 18.11 |
| 179 | 1200 | 1800 | 28.28 | 35.87 | 20.7 | 20.81 | 20.62 |
| 180 | 1250 | 1950 | 28.31 | 35.68 | 20.68 | 20.52 | 20.6 |
| 181 | 300 | 850 | 10.29 | 144.74 | 83.56 | 83.47 | 83.66 |
| 182 | 350 | 750 | 12.78 | 107.13 | 61.96 | 61.84 | 61.75 |
| 183 | 400 | 1300 | 11.09 | 129.91 | 75.32 | 75.4 | 74.28 |
| 184 | 450 | 1100 | 13.57 | 98.97 | 57.05 | 57.22 | 57.15 |
| 185 | 500 | 650 | 19.61 | 59.54 | 34.31 | 34.38 | 34.43 |
| 186 | 550 | 1500 | 14.2 | 92.78 | 53.57 | 53.48 | 53.65 |
| 187 | 600 | 1750 | 14.34 | 91.49 | 52.84 | 52.72 | 52.9 |
| 188 | 650 | 950 | 21.09 | 53.94 | 31.04 | 31.15 | 31.24 |
| 189 | 700 | 1000 | 22.14 | 50.24 | 29.03 | 29.12 | 28.86 |
| 190 | 750 | 1300 | 20.8 | 54.8 | 31.63 | 31.56 | 31.72 |
| 191 | 800 | 950 | 25.96 | 40.48 | 23.31 | 23.42 | 23.38 |
| 192 | 850 | 950 | 27.58 | 37.23 | 21.44 | 21.56 | 21.49 |
| 193 | 900 | 1200 | 25.98 | 40.13 | 23.27 | 23.08 | 23.16 |
| 194 | 950 | 1550 | 24.13 | 44.51 | 25.77 | 25.62 | 25.7 |
| 195 | 1000 | 850 | 34.3 | 27.47 | 15.86 | 15.92 | 15.8 |
| 196 | 1050 | 1400 | 28.06 | 36.11 | 20.93 | 20.85 | 20.77 |
| 197 | 1100 | 1400 | 29.4 | 34.17 | 19.63 | 19.75 | 19.81 |
| 198 | 1150 | 700 | 43.47 | 19.69 | 11.44 | 11.29 | 11.38 |
| 199 | 1200 | 1600 | 30 | 33.07 | 19.08 | 19.22 | 18.97 |
| 200 | 1250 | 1000 | 39.53 | 22.81 | 13.04 | 13.17 | 13.29 |
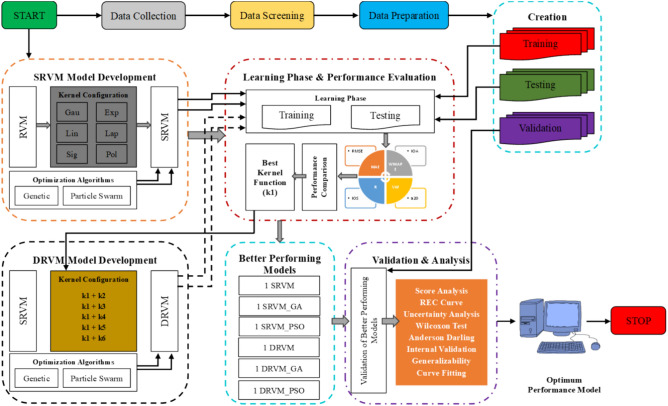
Using the data proportionality method, the testing, validation, and training databases have been created by selecting 20, 20, and 160 data points arbitrarily. In this study, we developed thirty-three RVM models. The conventional single kernel based SRVM models were developed using linear, polynomial, Gaussian, sigmoid, exponential, and Laplacian kernel functions. Therefore, these SRVM models were optimized by each GA and PSO algorithm. Conversely, to determine the kernel 1 (k1), the effectiveness of conventional SRVM models was evaluated. After finding k1, the different combinations of kernels were prepared. In this research, the Gaussian kernel based conventional SRVM model achieved higher performance. Hence, the following combinations were prepared to develop the dual kernel based DRVM model: (1) Gaussian + linear, (2) Gaussian + exponential, (3) Gaussian + sigmoid, (4) Gaussian + Laplacian, and (5) Gaussian + polynomial. Thus, five conventional DRVM models were developed, similarly the five DRVM models were optimized each by PSO and GA algorithms are compared and analysed to introduce an optimal performance model for predicting the ground vibration during blasting. To compute the performance of each model, the, LMI, WI, NMBE, RSR, BF, PI, NS, MBE, WMAPE, VAF, MAPE, RMSE, R, MAE, IOS, IOA, and a20 statistical metrics were implemented. These statistical metrics have been compared for each case, i.e., SRVM, SRVM_GA, SRVM_PSO, DRVM, DRVM_GA, and DRVM_PSO, and determined six better-performing models. In addition, the score analysis has been performed and compared for each model. Furthermore, the predictive abilities of the six top-performing models have been examined by visualising the regression error characteristics (REC) curve. Uncertainty analysis, Wilcoxon test, and Anderson–Darling (AD) test were conducted on the better-performing models to determine the ideal performance model for predicting ground vibration in blasting. Additionally, the optimum performance model has undergone calculations for curve fitting, generalizability, and internal validation. After conducting several analysis and experiments, this study presents an optimum RVM model for precisely predicting ground vibration in rock blasting. Figure 3 illustrates the comprehensive flow of the research approach used in this study.
Fig. 3.
Illustration of flow chart of the main research methodology.
Software support
MATLAB R2020a: for developing soft computing models, evaluation, analysis, and prediction. Origin Lab 2022b: for graphical presentations and data analysis, and Minitab Statistical Software: for statistical analysis.
Data analysis and soft computing approaches
Data analysis
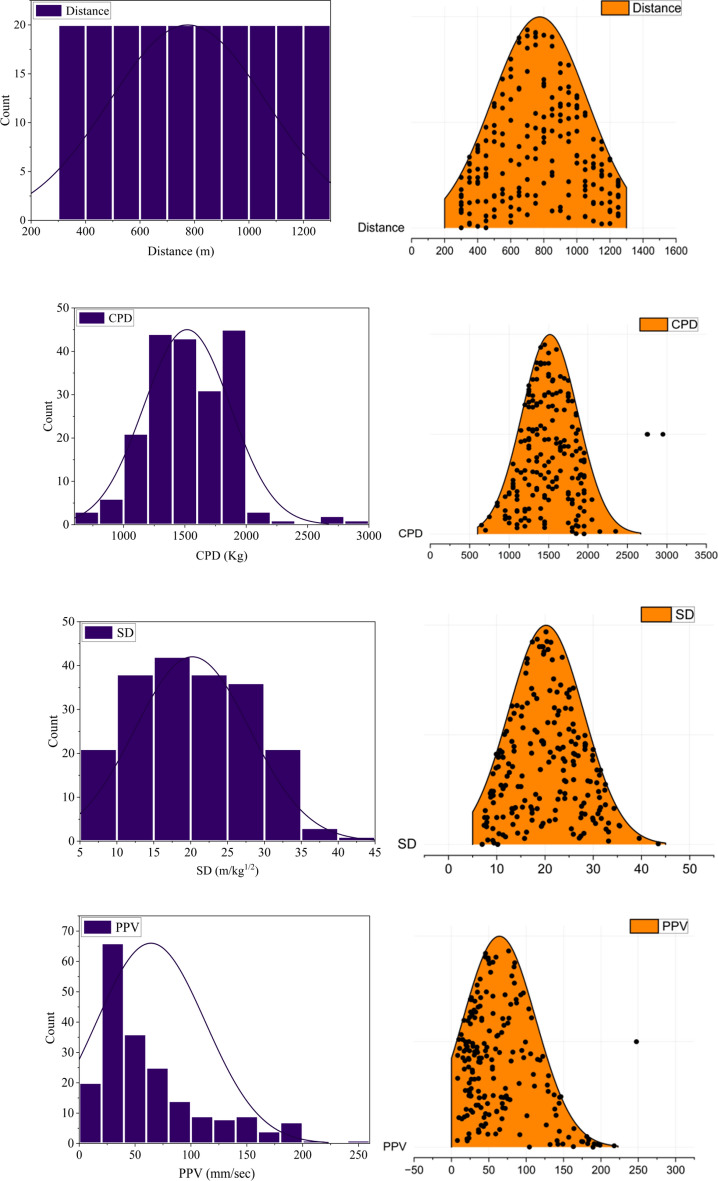
The authors investigated a dataset collected from Hammed et al.41, to develop accurate predictive models for the PPV. The dataset consisted of 200 test results for the PPV induced from the quarry blasting in Nigeria. The data analysis section is done using Origin Pro 2024 software. Table 4 reveals the summary of the database's descriptive statistics. It also contained many possible input factors that were believed to have an impact on the PPV. Figure 4 provides further clarification on the distribution of each variable using a frequency histogram plot in navy blue (left) and ridgeline plots in orange (right). This study utilizes both frequency histograms and ridgeline plots to verify the normal distribution of the dataset for each variable. Based on this analysis, each variable shows a normal distribution. The visual representation of the data in this figure is advantageous for identifying any possible outliers or trends that might impact the accuracy of the models. Histograms provide a visual representation of the distribution of data points within a variable. By examining the shape, spread, and skewness of the histogram, we can identify unusual observations that deviate significantly from the overall pattern of the data. Specifically, outliers can often be observed as isolated bars or gaps in the histogram that are distant from the main cluster of data.
Table 4.
Overview of the statistical features associated with the database.
| Descriptive statistics | Distance (m) | CPD (kg) | SD (m/kg½) | PPV (mm/s) |
|---|---|---|---|---|
| Mean | 775 | 1517.637 | 20.230 | 64.173 |
| SE | 20.438 | 25.024 | 0.551 | 3.447 |
| Median | 775 | 1500 | 19.75 | 46.94 |
| Mode | 300 | 1250 | 11.32 | 40.48 |
| Standard deviation | 289.037 | 353.894 | 7.795 | 48.750 |
| Kurtosis | − 1.206 | 1.514 | − 0.756 | 1.300 |
| Skewness | 0 | 0.551 | 0.194 | 1.355 |
| Range | 950 | 2300 | 36.5 | 239.53 |
| Minimum | 300 | 650 | 6.97 | 8 |
| Maximum | 1250 | 2950 | 43.47 | 247.53 |
| Sum | 155,000 | 303,527.5 | 4046.05 | 12,834.717 |
| Count | 200 | 200 | 200 | 200 |
Fig. 4.
Graphic representation depicting the distribution of variables based on frequency histogram plot in blue navy colour (left) and ridgeline plots in orange colour (right).
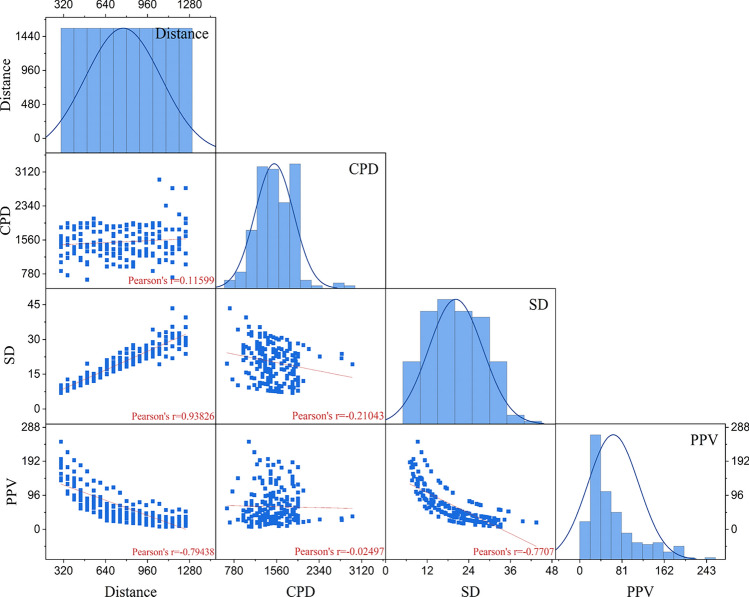
Figure 5 demonstrates the relationship between variables in terms of the scatter matrix plot. It illustrates that all variables very strongly correlate with each other. It shows a strong correlation between D and SD with (r = 0.94).
Fig. 5.
Graphic representation of scatter matrix plot of all the variables to elaborate the relationship between the variables.
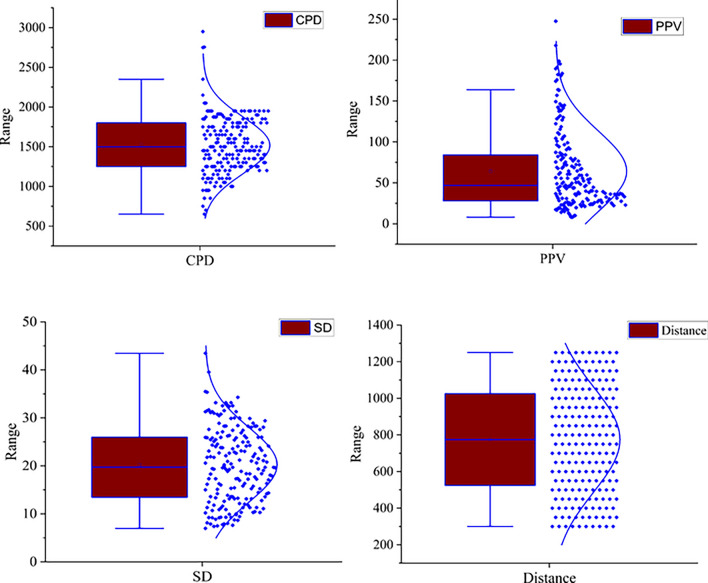
The violin plots of the variables are depicted in Fig. 6. It is useful for visualizing the distribution of the blasting dataset of this study, especially it describes in terms of quartiles. Quartile 1 (Q1) represents the 25th percentile, and Quartile 3 (Q3) represents the 75th percentile. The box-in-a-box plot spans from Q1 to Q3. Based on this analysis the data set in the distance shows distributed equally. Hence this is due to the monitoring station distance taking place at 50-m intervals starting from the first point up to the last 20 monitoring points with 1250 m. For SD it shows the data points are highly scattered in Q1 and Q3, at a range of 7 m/kg1/2–35 m/kg1/2. Similarly, the CPD data set is highly distributed in a range of 750–2250 kg.
Fig. 6.
Depiction of violin plots of all variables.
Pearson and Spearman correlation coefficients are the most popular correlation coefficients in statistics, both ranging from − 1 to 1, and are frequently used to evaluate the relationship between two variables A correlation coefficient of 0 indicates no connection between variables. A positive correlation coefficient suggests a positive relationship, while a negative coefficient implies a negative relationship. The strength of the correlation is gauged by the absolute value of the coefficient; a higher absolute number indicates a stronger correlation.
In this current study, we introduce Spearman correlation technique (Fig. 7) to capture both linear and nonlinear correlation relationships among the variables. Spearman quantifies how much information about one variable can be gained by observing another. Both methods handle categorical and continuous variables. Figure 7 confirms a strong positive correlation between SD and distance with a correlation value of 0.95, and a correlation value of 0.047 between CPD and PPV, and 0.065 between distance and CPD.
Fig. 7.
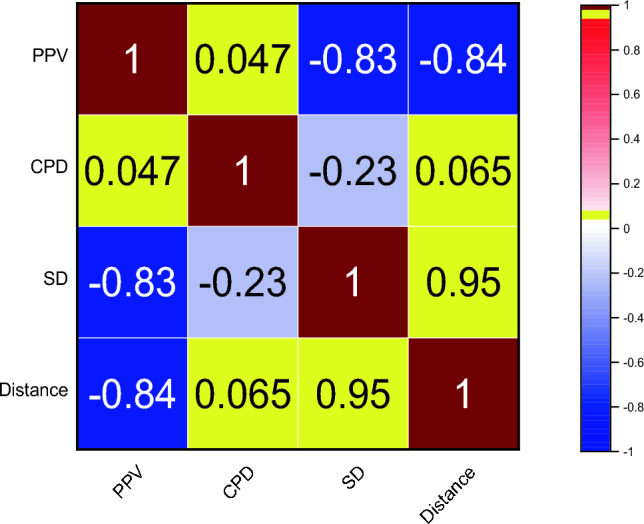
Illustration of spearman correlation plot.
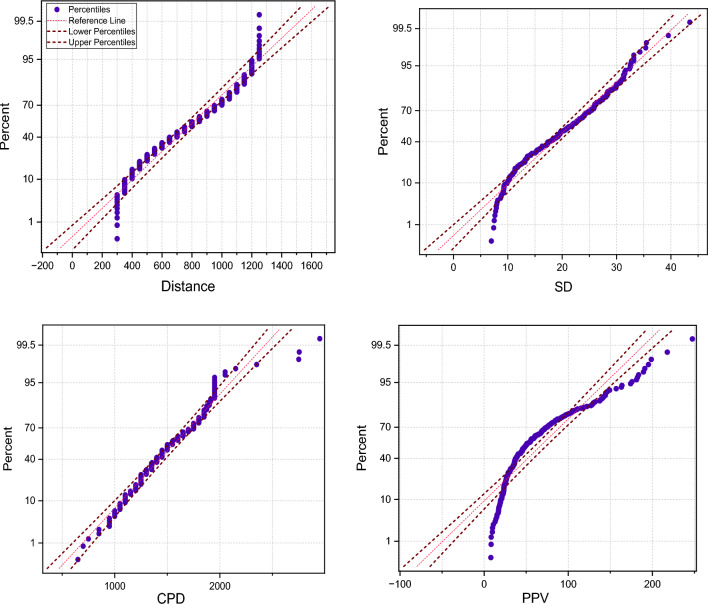
During the data analysis stage, researchers use the probability (PP) plot to visualize dataset dispersion. The PP plot compares real data quantiles to predictions of a theoretical distribution, revealing the data's distribution. This graph helps determine whether data follows a probability distribution like the normal distribution. Variations from a linear trajectory in the PP plot may indicate variations from the anticipated distribution, highlighting dataset issues. For this current study, the PP plot investigates each variable (Fig. 8). Based on the PP plot result variables such as CPD, and SD show almost good distribution in terms of the normal pattern of the data, however, the PP plot for PPV and distance shows there is no fully perfect normal distribution among the data points, some of the data points are distributed outside of the normal line. Specifically, the normal probability plot for the target variable of this study PPV indicates a mean (μ) of 64.17 and a standard deviation (σ) of 48.75 it suggests that the data is being compared or assessed in the context of a normal distribution with these specified parameters. Essentially, the specified μ and σ in the normal probability plot provide a reference for assessing the normality of the dataset under consideration.
Fig. 8.
Illustration of normal probability (PP) plot of all variables.
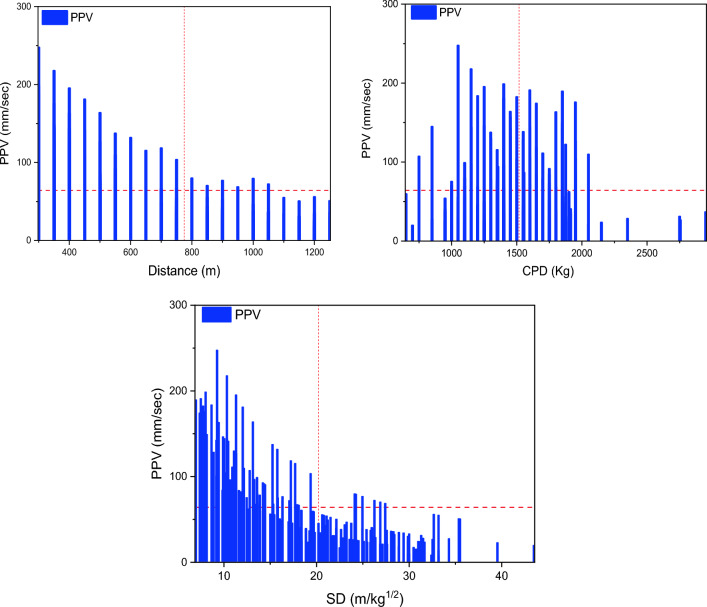
In addition to the above-advanced data analysis techniques, this study also integrates a 2D mean line graph to assess the visual depiction of data points on a coordinate system. Every point on the plot corresponds to a set of values for two variables in the blasting dataset. Examining a two-dimensional scatter plot may provide several significant observations, including the identification of patterns, detection of anomalies, and assessment of data distribution. Based on the 2D mean line graph in Fig. 9, shows that there is almost similar data distribution among CPD and PPV. However, there is no harmonize data distribution between PPV, SD, and distance.
Fig. 9.
Depiction of 2D mean line graph plot of each input variable (y-axis) with the target variable (x-axis) to illustrate the interaction between each variable.
Soft computing approaches
This current study introduces 33 RVM models. The conventional single kernel based SRVM models were developed using polynomial, linear, sigmoid, Gaussian, exponential, and Laplacian kernel functions. Therefore, these SRVM models were optimized by each GA and PSO algorithms. Conversely, the performance of conventional SRVM models was compared to find the kernel 1 (k1). After finding k1, the different combinations of kernels were prepared. In this research, the Gaussian kernel based conventional SRVM model achieved higher performance. Hence, the following combinations were prepared to develop the dual kernel based DRVM model: (1) Gaussian + exponential, (2) Gaussian + linear, (3) Gaussian + Laplacian, (4) Gaussian + sigmoid, and (5) Gaussian + polynomial. Thus, five conventional DRVM models were developed. These five DRVM models were optimized by each PSO and GA algorithm.
Relevance vector machine (RVM)
RVM belongs to the category of kernel methods in machine learning, tailored for both regression and classification tasks. Kernel SVM, a variation of Support Vector Machine (SVM), was introduced to handle uncertainties in training data by integrating a probabilistic approach. RVM aims to address certain drawbacks present in traditional SVMs, such as difficulties in handling vast datasets and the necessity of selecting appropriate kernel functions and regularization parameters42.
Khatti et al.43, in their research, describe the key features of RVM, based on their analysis the main features are probabilistic framework, sparsity, kernel trick, sparse Bayesian learning, and model training. It means it is very similar to a Gaussian model with kernel (Eq. 1)
| 1 |
where is the Gaussian kernel, are the variances of the prior on the weight vector N (0, ), and ,… are the input variables of the training datasets43,44. The Gaussian
| 2 |
kernels have developed the RVM models in the present study (Eq. 2). The , are the basic input and out variables, c is constant, m is the gradient/slope of a line, d is the degree, D is the scale factor, 1 is the length scale hyper-parameter, and is the standard deviation.
Therefore, for the first time this study introduced RVM models for predicting the ground vibration (PPV), a total of six RVM models were implemented for predicting the PPV. These are 6 single kernel-based RVM conventional models (SRVM), 5 dual kernel-based RVM conventional models (DRVM), 6 GA-optimized single kernel-based RVM models (GA_SRVM), 6 PSO-optimized single kernel-based RVM models (PSO_SRVM), 5 GA-optimized Dual kernel-based RVM models (GA_DRVM), and 5 PSO-optimized Dual kernel-based RVM models (PSO_DRVM).
Two types of kernel function based RVM models have been developed for PPV prediction: single (SRVM) and dual (DRVM) models. Table 5 presents the RVM model configurations that were developed. This research has created 33 RVM models by using the hyperparameters specified in Table 5.
Table 5.
Basic RVM model hyperparameters configured with a k-fold value of 5.
| Hyperparameters | SRVM model | DRVM model |
|---|---|---|
| Parameter settings | ||
| Kernel functions | Linear, Polynomial, Gaussian | and Laplacian |
| Maximum iterations | 1000 | 1000 |
| Number of kernels | Single | Two |
| Free basis | Enable | Enable |
| Optimizer settings | ||
| Methods | GA and PSO | GA and PSO |
| Target | Single kernel | Dual kernel |
| Lb | 2–6 | |
| uB | 2–6 | |
| Num. variable | 1 | 4 |
| Maximum iterations | 100 | 100 |
| k-folds | 5 | 5 |
Sensitivity analysis (SA)
The study employs sensitivity analysis (SA) to pinpoint the most influential independent variables in regression or numerical prediction models. Eliminating insignificant input parameters is crucial for improving model performance. In this research, the cosine amplitude technique (CAM) is utilized for SA. Figure 10 shows that charge per delay has the highest influence score of 0.772, followed by distance at 0.579 and scaled distance at 0.577. In Eq. 3, the vector x (of length m) represents the predictors xi in the data array is specified as follows.
| 3 |
Fig. 10.
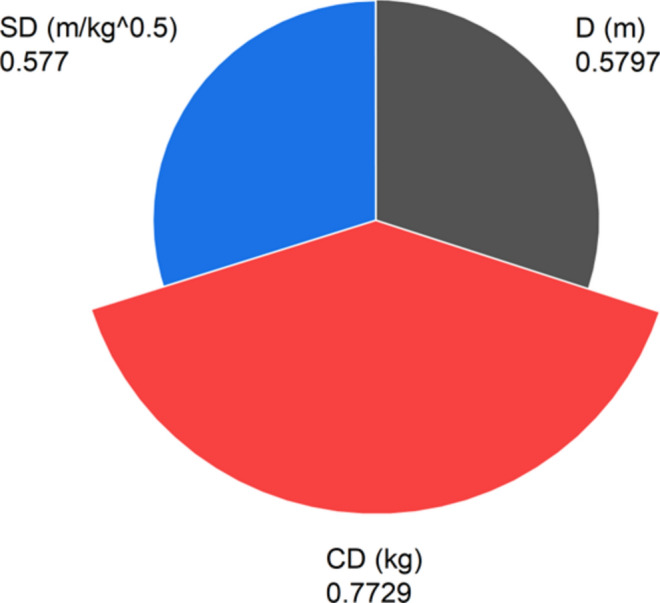
Depiction of cosine amplitude sensitivity analysis (SA) for input variables.
In Eq. (4), the significance between predictors (xi) and targets (xj) is estimated45.
| 4 |
In this study correlation plots and sensitivity analysis serve different purposes. Correlation plots visualize the relationship between variables, showing the strength and direction of linear or non-linear relationships through correlation coefficients. They are useful for identifying patterns within a dataset. For this target this study introduces different correlation plots such as Pearson and spearman correlation plots (see Figs. 5 and 7). Sensitivity analysis, on the other hand, assesses how variations in input variables affect the output of a model. It quantifies the impact of each variable, aiding in model validation and decision-making by identifying critical variables. In our current study we introduced cosine amplitude sensitivity analysis based on this CPD shows higher influence on the output with 0.77.
Performance evaluation
The current study has used the following eleven basic metrics to assess the performance of models: (1) Root means square error (RMSE), (2) Mean absolute percentage error (MAPE), (3) Mean absolute error (MAE), (4) Weighted Mean Absolute Percentage Error (WMAPE), (5) Correlation coefficient (R), (6) Variance account for (VAF), (7) Nash–Sutcliffe Efficiency (NS), (8) Ratio of Standard Deviation (RSR), and (9) the Bias factor (BF), (10) Performance index (PI), (11) Index of scatter (IOS), (12) Index of agreement (IOA), (13) Normalized mean bias error (NMBE), (14) Legate and McCabe’s index (LMI), (15) a20-index (a20), and (16) Mean bias error (NMBE)42. All the performance evaluation equations are included starting from Eqs. (5) to (20).
| 5 |
| 6 |
| 7 |
| 8 |
| 9 |
| 10 |
| 11 |
| 12 |
| 13 |
| 14 |
| 15 |
| 16 |
| 17 |
| 18 |
| 19 |
| 20 |
The variables α and ω represent the actual and predicted i-th values respectively. The variable n represents the total number of data points. β represents the mean of the actual values, while represents the mean of the predicted values. The variable k represents the number of independent variables. The variable m20 represents the ratio of experimental to predicted values, which can vary between 0.8 and 1.2. H represents the total number of data samples.
The main benefit of the a20-index is its ability to predict the values within a deviation range of ± 20% in comparison to the actual measured values. Conversely, the index of agreement is limited to a range of − 1.0 to 1.0n46. A perfect predictive model always has performance indicators value equal to the ideal value, as given in Table 6.
Table 6.
Main values of the different evaluation metrics in machine learning.
| Metrics | Value | Metrics | Value |
|---|---|---|---|
| R2 | 1 | RMSE | 0 |
| R | 1 | MAE | 0 |
| MAPE | 0–100 | WMAPE | 0 |
| VAF | 100 | PI | 2 |
| NMBE | 0 | NS | 1 |
| LMI | 0 | RSR | 0 |
| a20-index | 100 | IOA | 0 |
| BF | 0 | IOS | 0 |
Results and discussion
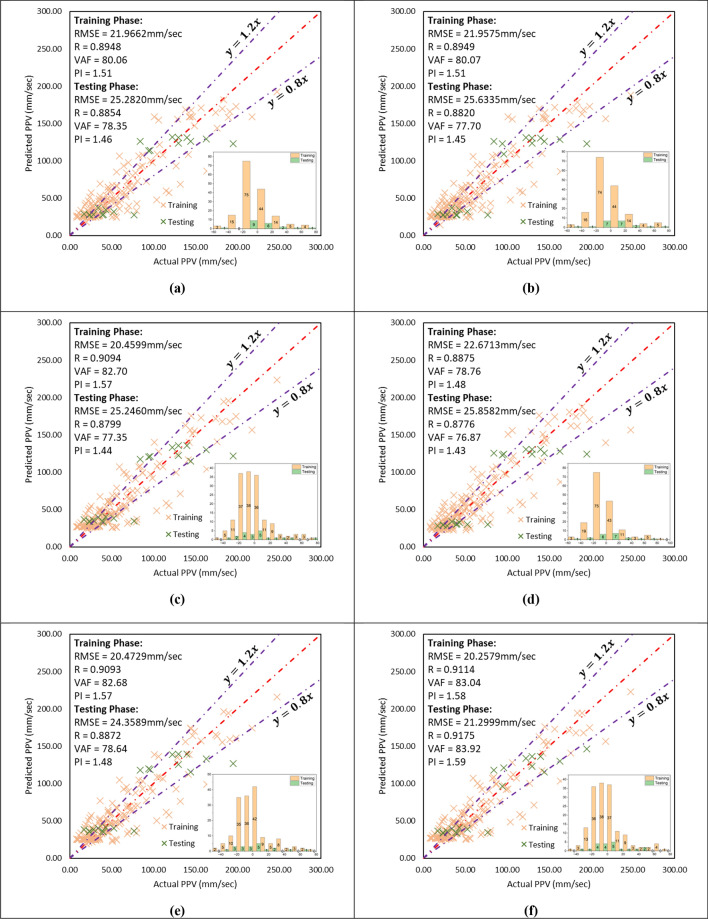
In this study total six models are selected from the thirty-three total models i.e. MD1, MD10, MD16, MD21, MD26, and MD29 based on their different kernel configurations. The conventional single kernel based SRVM models were developed using linear, polynomial, Gaussian, sigmoid, exponential, and Laplacian kernel functions. Therefore, these SRVM models were optimized by each GA and PSO algorithm. Conversely, the performance of conventional SRVM models was compared to find the kernel 1 (k1). After finding k1, the different combinations of kernels were prepared. In this research, the Gaussian kernel based conventional SRVM model achieved higher performance. Hence, the following combinations were prepared to develop the dual kernel based DRVM model: (1) Gaussian + exponential, (2) Gaussian + linear, (3) Gaussian + Laplacian, (4) Gaussian + sigmoid, and (5) Gaussian + polynomial. Thus, five conventional DRVM models were developed. These five DRVM models were optimized by each GA and PSO algorithm. 6 single kernel-based RVM conventional models (SRVM), 5 dual kernel-based RVM conventional models (DRVM), 6 GA-optimized single kernel-based RVM models (GA_SRVM), 6 PSO-optimized single kernel-based RVM models (PSO_SRVM), 5 GA-optimized Dual kernel-based RVM models (GA_DRVM), and 5 PSO-optimized Dual kernel-based RVM models (PSO_DRVM) approaches have been employed, performed, and analysed. The seventeen-evaluation metrics have measured the training (TR) and testing (TS) performances of all models, as summarized in Table 7. Table 7 demonstrates that the PSO-optimized Dual kernel-based RVM models (PSO_DRVM) model MD29 has higher performance (TS = 0.9175, TR = 0.9114) than other RVM models. It has been measured that model MD29 predicts the ground vibration with RMSE = 21.299 mm/s, MAE = 16.2272 mm/s, MAPE = 0.2094 mm/s, WMAPE = 0.1936 mm/s, and NMBE = 5.4120, in the TS phase. The comparison shows that model MD29 predicts ground vibration with the least residuals in the TR and TS phases. In similar style the results obtained from the soft computing models in the training, validation and testing phase include the different models and seventeen metrics are shown in Table 8.
Table 7.
Results obtained from the soft computing models in the training and testing phase.
| Model | Phase | RMSE | MAE | R | MAPE | VAF | WMAPE | NS | PI | BF | NMBE | WI | MBE | LMI | RSR | a20 | IOA | IOS |
|---|---|---|---|---|---|---|---|---|---|---|---|---|---|---|---|---|---|---|
| MD1 | Train | 21.9662 | 15.8079 | 0.8948 | 0.3445 | 80.06 | 0.2530 | 0.8006 | 1.51 | 1.1668 | 7.7234 | 0.9974 | 0.0341 | 0.4212 | 0.4466 | 56.25 | 0.7894 | 0.3516 |
| Test | 25.2820 | 17.7599 | 0.8854 | 0.2388 | 78.35 | 0.2119 | 0.7693 | 1.46 | 0.9772 | 7.6248 | 0.9965 | -6.2726 | 0.3855 | 0.4803 | 55.00 | 0.8072 | 0.3016 | |
| Valid | 22.5340 | 16.9839 | 0.7770 | 0.3467 | 54.28 | 0.2922 | 0.5265 | 1.05 | 1.1605 | 8.7375 | 0.9929 | 4.1799 | 0.6113 | 0.6881 | 30.00 | 0.6943 | 0.3877 | |
| MD10 | Train | 21.9575 | 15.7224 | 0.8949 | 0.3502 | 80.07 | 0.2517 | 0.8007 | 1.51 | 1.1661 | 7.7173 | 0.9974 | 0.0341 | 0.4189 | 0.4464 | 45.63 | 0.7906 | 0.3515 |
| Test | 25.6335 | 18.0084 | 0.8820 | 0.2407 | 77.70 | 0.2148 | 0.7629 | 1.45 | 0.9755 | 7.8383 | 0.9961 | -6.2585 | 0.3909 | 0.4869 | 50.00 | 0.8045 | 0.3058 | |
| Valid | 22.5340 | 16.9839 | 0.7770 | 0.3467 | 54.28 | 0.2922 | 0.5265 | 1.05 | 1.1605 | 8.7375 | 0.9929 | 4.1799 | 0.6113 | 0.6881 | 30.00 | 0.6943 | 0.3877 | |
| MD16 | Train | 20.4599 | 14.8188 | 0.9094 | 0.3451 | 82.70 | 0.2372 | 0.8270 | 1.57 | 1.1673 | 6.7005 | 0.9977 | 0.0341 | 0.3948 | 0.4159 | 48.75 | 0.8026 | 0.3275 |
| Test | 25.2460 | 18.6492 | 0.8799 | 0.2791 | 77.35 | 0.2225 | 0.7700 | 1.44 | 1.0767 | 7.6031 | 0.9959 | -3.1068 | 0.4048 | 0.4796 | 52.00 | 0.7976 | 0.3012 | |
| Valid | 22.5340 | 16.9839 | 0.7770 | 0.3467 | 54.28 | 0.2922 | 0.5265 | 1.05 | 1.1605 | 8.7375 | 0.9929 | 4.1799 | 0.6113 | 0.6881 | 30.00 | 0.6943 | 0.3877 | |
| MD21 | Train | 22.6713 | 15.5568 | 0.8875 | 0.3473 | 78.76 | 0.2490 | 0.7876 | 1.48 | 1.1695 | 8.2272 | 0.9974 | 0.0341 | 0.4145 | 0.4609 | 48.13 | 0.7928 | 0.3629 |
| Test | 25.8582 | 18.5053 | 0.8776 | 0.2479 | 76.87 | 0.2208 | 0.7587 | 1.43 | 0.9921 | 7.9763 | 0.9960 | -5.2581 | 0.4017 | 0.4912 | 52.00 | 0.7991 | 0.3085 | |
| Valid | 21.6117 | 15.5094 | 0.7544 | 0.3545 | 56.88 | 0.2669 | 0.5645 | 1.05 | 1.1439 | 8.0369 | 0.9901 | -2.1526 | 0.5583 | 0.6599 | 50.00 | 0.7209 | 0.3719 | |
| MD26 | Train | 20.4729 | 14.9638 | 0.9093 | 0.3435 | 82.68 | 0.2395 | 0.8268 | 1.57 | 1.1613 | 6.7091 | 0.9976 | 0.0341 | 0.3987 | 0.4162 | 49.38 | 0.8007 | 0.3277 |
| Test | 24.3589 | 18.2533 | 0.8872 | 0.2861 | 78.64 | 0.2177 | 0.7859 | 1.47 | 1.1110 | 7.0782 | 0.9962 | -1.1517 | 0.3963 | 0.4627 | 45.00 | 0.8019 | 0.2906 | |
| Valid | 22.1191 | 16.0132 | 0.7603 | 0.3405 | 54.39 | 0.2755 | 0.5438 | 1.03 | 1.1246 | 8.4187 | 0.9920 | 0.2884 | 0.5764 | 0.6754 | 55.00 | 0.7118 | 0.3806 | |
| MD29 | Train | 20.2579 | 14.6322 | 0.9114 | 0.3427 | 83.04 | 0.2342 | 0.8304 | 1.58 | 1.1437 | 6.5689 | 0.9977 | -0.2653 | 0.3898 | 0.4118 | 60.00 | 0.8051 | 0.3243 |
| Test | 21.2999 | 16.2272 | 0.9175 | 0.2094 | 83.92 | 0.1936 | 0.8363 | 1.59 | 0.9750 | 5.4120 | 0.9967 | -2.8230 | 0.3523 | 0.4046 | 65.00 | 0.8239 | 0.2541 | |
| Valid | 18.5467 | 13.4658 | 0.8369 | 0.3055 | 67.99 | 0.2317 | 0.6793 | 1.30 | 1.1144 | 5.9189 | 0.9941 | 0.8088 | 0.4847 | 0.5663 | 60.00 | 0.7577 | 0.3191 |
Table 8.
Results obtained from the soft computing models in the training and testing phase include the different models and seventeen metrics.
| Model | Phase | RMSE | MAE | R | MAPE | VAF | WMAPE | NS | PI | BF | NMBE | WI | MBE | LMI | RSR | a20 | IOA | IOS | Total |
|---|---|---|---|---|---|---|---|---|---|---|---|---|---|---|---|---|---|---|---|
| MD1 | Train | 2 | 1 | 2 | 4 | 2 | 1 | 2 | 2 | 4 | 2 | 1 | 4 | 1 | 2 | 5 | 1 | 2 | 38 |
| Test | 3 | 5 | 4 | 5 | 4 | 5 | 3 | 4 | 3 | 3 | 5 | 6 | 5 | 3 | 5 | 5 | 3 | 71 | |
| Valid | 1 | 1 | 3 | 4 | 1 | 1 | 1 | 3 | 4 | 1 | 5 | 2 | 1 | 1 | 1 | 1 | 1 | 32 | |
| MD10 | Train | 3 | 2 | 3 | 1 | 3 | 2 | 3 | 3 | 3 | 3 | 3 | 2 | 2 | 3 | 1 | 2 | 3 | 42 |
| Test | 2 | 4 | 3 | 4 | 3 | 4 | 2 | 3 | 2 | 2 | 3 | 5 | 4 | 2 | 2 | 4 | 2 | 51 | |
| Valid | 2 | 2 | 3 | 3 | 2 | 2 | 2 | 4 | 5 | 2 | 4 | 1 | 2 | 2 | 1 | 2 | 2 | 41 | |
| MD16 | Train | 5 | 5 | 5 | 3 | 5 | 5 | 5 | 5 | 5 | 5 | 5 | 3 | 5 | 5 | 3 | 5 | 5 | 79 |
| Test | 4 | 1 | 2 | 2 | 2 | 1 | 4 | 2 | 5 | 4 | 1 | 3 | 1 | 4 | 3 | 1 | 4 | 44 | |
| Valid | 3 | 3 | 5 | 2 | 3 | 3 | 3 | 5 | 6 | 3 | 3 | 3 | 3 | 3 | 1 | 3 | 3 | 55 | |
| MD21 | Train | 1 | 3 | 1 | 2 | 1 | 3 | 1 | 1 | 6 | 1 | 2 | 1 | 3 | 1 | 2 | 3 | 1 | 33 |
| Test | 1 | 2 | 1 | 3 | 1 | 2 | 1 | 1 | 4 | 1 | 2 | 4 | 2 | 1 | 3 | 2 | 1 | 32 | |
| Valid | 5 | 5 | 1 | 1 | 5 | 5 | 5 | 2 | 3 | 5 | 1 | 6 | 5 | 5 | 4 | 5 | 5 | 68 | |
| MD26 | Train | 4 | 4 | 4 | 5 | 4 | 4 | 4 | 4 | 2 | 4 | 4 | 5 | 4 | 4 | 4 | 4 | 4 | 68 |
| Test | 5 | 3 | 5 | 1 | 5 | 3 | 5 | 5 | 6 | 5 | 4 | 1 | 3 | 5 | 1 | 3 | 5 | 65 | |
| Valid | 4 | 4 | 2 | 5 | 4 | 4 | 4 | 1 | 2 | 4 | 2 | 5 | 4 | 4 | 5 | 4 | 4 | 62 | |
| MD29 | Train | 6 | 6 | 6 | 6 | 6 | 6 | 6 | 6 | 1 | 6 | 6 | 6 | 6 | 6 | 6 | 6 | 6 | 97 |
| Test | 6 | 6 | 6 | 6 | 6 | 6 | 6 | 6 | 1 | 6 | 6 | 2 | 6 | 6 | 6 | 6 | 6 | 93 | |
| Valid | 6 | 6 | 6 | 6 | 6 | 6 | 6 | 6 | 1 | 6 | 6 | 4 | 6 | 6 | 6 | 6 | 6 | 95 |
Bold shows values correspond to the best model having good prediction results.
The overall comparison reveals that MD29 (DRVM_PSO with Gaussian + Exponential kernel) is the optimum performance model for assessing the ground vibration during blasting. A statistical relationship is drawn between actual and predicted PPV using models MD1, MD10, MD16, MD21, MD26, and MD29, as depicted in Fig. 11.
Fig. 11.
Illustration of the relationship between actual and predicted PPV using RVM models (a) MD1, (b) MD10, (c) MD16, (d) MD21, (e) MD26, and (f) MD29.
Score analysis
The evaluation of computational models' effectiveness is conducted through score analysis, employing statistical methods. Each model is assigned a score, denoted as 'n', indicating its ability to accurately determine optimal values for performance indicators. This study utilized a sample size of 6 and focused on soft computing models. The highest and lowest values of performance indicators in the score analysis represent the best and worst training and testing instances for the models. The overall model score is determined by averaging the scores of performance indicators across both training and testing phases.
The testing and training results are used to get the overall score of a model. The score analysis findings for the training and testing performances of the computational models MD1, MD10, MD16, MD21, MD26, and MD29 are summarized and shown in Fig. 12.
Fig. 12.
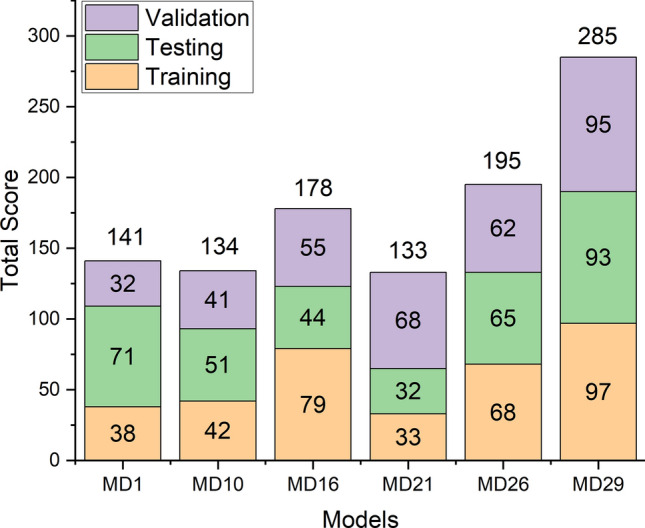
Total score of better performing models.
Figure 12 illustrate that MD29 exhibits superior performance in both training and testing phases. Consequently, MD29 emerges as the most effective model for assessing ground vibration PPV resulting from blasting activities. In contrast, MD21 is identified as the poor performing model in this study, given its lowest score.
Regression error characteristics (REC) curve
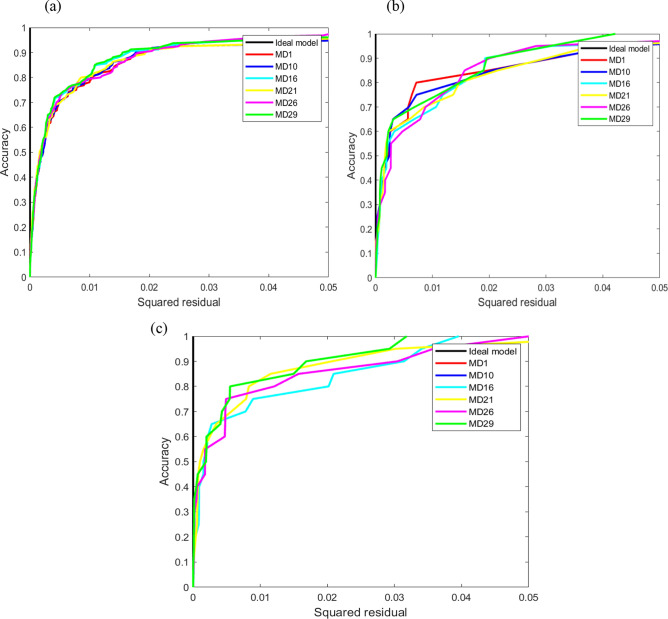
The REC curve is a visual tool that effectively illustrates the distribution of prediction errors, offering valuable insights into the performance of regression models. The REC curve differs from conventional metrics like MSE or MAE by emphasizing the cumulative distribution function of the absolute errors. The function graphs the ratio of occurrences with errors that are less or equal to a specified threshold, versus that threshold. REC curves extend the concept of ROC curves to regression problems. The y-axis of REC curves displays the proportion of projected points that are inside the specified error tolerance, while the x-axis represents the error tolerance. The resultant curve offers an approximation of the cumulative distribution function of the error. The current study included the creation of REC curves for testing, training, and validation of several RVM models.
These curves are shown in Fig. 13, along with the corresponding AOC values listed in Table 9.
Fig. 13.
Depiction of AOC results for (a) training and (b) testing, (c) validation phase.
Table 9.
AOC values for soft computing models for training, testing, and validation.
| Actual | MD1 | MD10 | MD16 | MD21 | MD26 | MD29 | |
|---|---|---|---|---|---|---|---|
| Train | 0.00E + 00 | 8.08E − 03 | 8.07E − 03 | 6.98E − 03 | 8.51E − 03 | 6.98E − 03 | 6.84E − 03 |
| Test | 0.00E + 00 | 8.85E − 03 | 9.16E − 03 | 8.75E − 03 | 9.44E − 03 | 8.28E − 03 | 6.85E − 03 |
| Valid | 0.00E + 00 | 7.86E − 03 | 7.86E − 03 | 7.86E − 03 | 6.49E − 03 | 7.27E − 03 | 5.20E − 03 |
Bold blue values present the optimum performance model.
Table 8 indicates that model MD29 achieved the lowest AOC values. Specifically, it obtained an AOC of 6.84E−03 during training, 6.85E−03 during testing, and 5.20E−03 during validation. These values are like the AOC of the real ground vibration. Therefore, model MD29 is a model that delivers optimal performance.
Curve fitting
In this study, six RVM models, i.e. MD1, MD10, MD16, MD21, MD26, and MD29, have been developed. MD29 is recognized as the better-performing model in predicting the PPV. Models MD1, MD10, MD16, MD21, MD26, and MD29 have been trained by 70%, 80%, 70%, 50%, 70%, 80%, 70%, 60%, 50%, and 100% training databases, respectively.
Based on Fig. 14, the overfitting comparison shows that model MD29 performs well with the lowest overfitting of 1.05 in the testing phase and 0.92 in the validation phase.
Fig. 14.
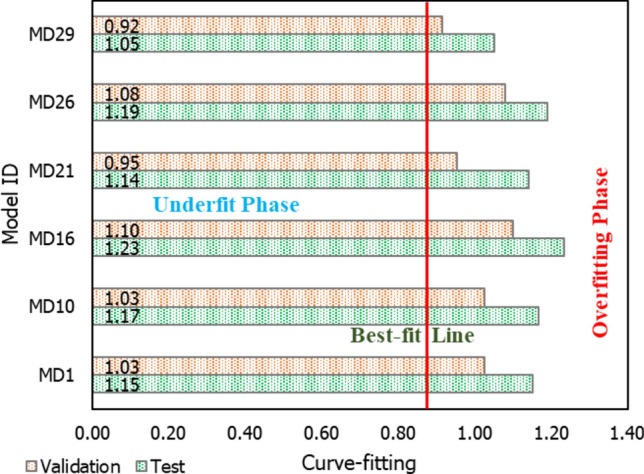
Illustration of curve fitting of the six RVM models, MD1, MD10, MD16, MD21, MD26, and MD29.
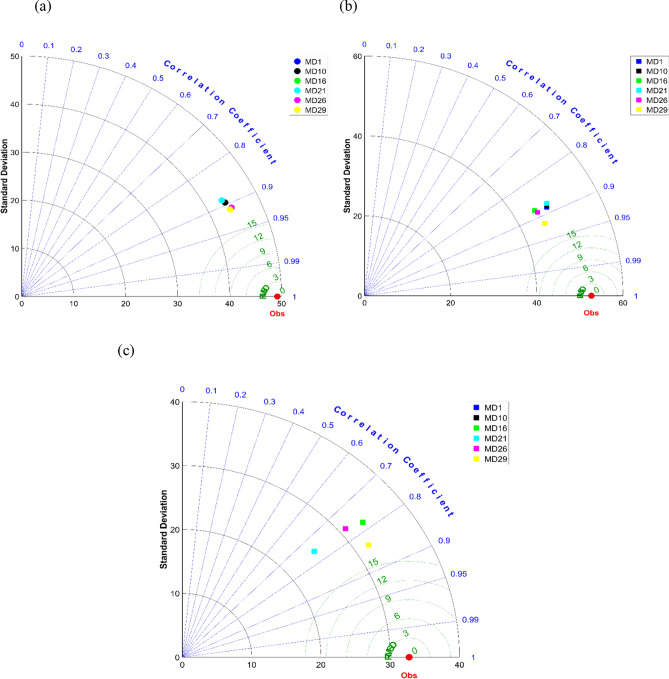
Illustrations of Taylor plots for (a) testing, (b) training, and (c) validation phase have been found in Fig. 15. Taylor plots offer invaluable advantages for predicting blasting vibration. They provide a clear visual representation of the relationship between predicted and observed values, facilitating easy interpretation and assessment of model performance. Through quantitative measures like correlation coefficient and standard deviation ratio, Taylor plots enable analysts to gauge the accuracy and precision of predictive models. Moreover, they pinpoint systematic bias and variability, aiding in model refinement and improvement. Taylor plots also allow for the comparison of multiple models on the same graph, facilitating informed decisions about model selection. Ultimately, they serve as a diagnostic tool for enhancing predictive accuracy and reliability, making them indispensable in the field of blasting vibration prediction.
Fig. 15.
Illustration of Taylor plots for (a) training, (b) testing, and (c) validation phase.
Anderson–Darling (AD) test
The Anderson–Darling (AD) test is a statistical tool used to assess whether a given dataset conforms to a particular probability distribution, particularly focusing on extreme values. It is commonly employed to evaluate normality, comparing the observed data to a theoretical distribution, often the normal (Gaussian) distribution. The research hypothesis (HR) suggests that the data deviate from the specified distribution, while the null hypothesis (H0) contends that the data are drawn from that distribution. A lower AD test statistic indicates a stronger alignment with the specified distribution. In our study, we applied the AD test to evaluate the fit of actual data and predictions from several models (MD1, MD10, MD16, MD21, MD26, and MD29), as depicted in Fig. 16. Notably, model MD29 exhibited an AD value of 11.607 for predicting the ground vibration PPV closely matching the actual PPV dataset. The AD test results support the hypothesis of a normal distribution and suggest that MD29 performs best among the models examined.
Fig. 16.
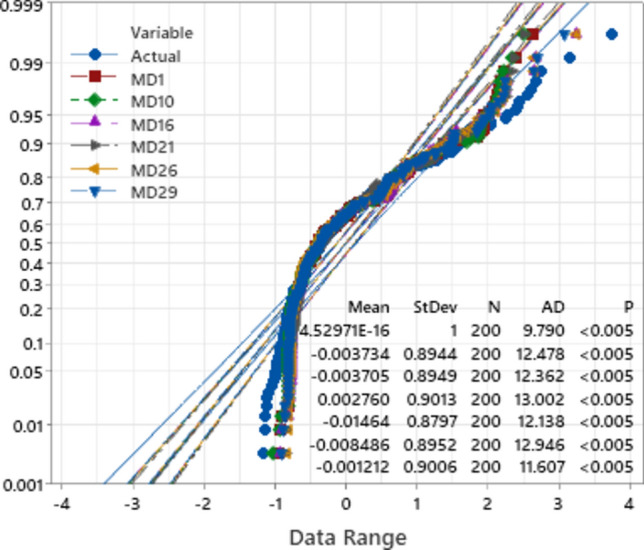
Depiction of AD test results for models MD1, MD10, MD16, MD21, MD26, and MD29.
Wilcoxon test
The Wilcoxon test includes two variations: the rank sum test and the signed-rank test. These tests are used to assess and compare two groups that have been effectively matched. The Wilcoxon test is used to evaluate the presence of a statistically significant difference between two or more sets of paired data. The Wilcoxon test was used on the RVM models to predict the PPV of the blasting in both the testing, and training phases. Table 10 presents the results of the Wilcoxon test. The table indicates that throughout the training phase, model MD29 made accurate predictions of the PPV, with a different confidence interval (CI). This confidence range is comparable to the confidence interval of the true PPV of the blasting in the testing database. In the training phase, model MD29 assessed the PPV with a confidence interval of 0.2240 (upper bound) and 0.1596 (lower bound). The confidence interval (CI) of the actual test database is quite like this CI, with an upper level of 0.4140 and a lower level of 0.1333. The findings indicate that model MD29 has superior performance compared to the MD1, MD10, MD16, MD21, and MD26.
Table 10.
Wilcoxon test for training, testing, and validation phase.
| Model ID | Num | Median | Confidence levels | Achieved confidence | |
|---|---|---|---|---|---|
| LCL | UCL | ||||
| Training phase | |||||
| Actual | 160 | 0.1859 | 0.1584 | 0.2221 | 95.00% |
| MD1 | 160 | 0.1867 | 0.1605 | 0.2219 | 95.00% |
| MD10 | 160 | 0.1869 | 0.1608 | 0.2210 | 95.00% |
| MD16 | 160 | 0.1836 | 0.1599 | 0.2277 | 95.00% |
| MD21 | 160 | 0.1886 | 0.1628 | 0.2218 | 95.00% |
| MD26 | 160 | 0.1867 | 0.1621 | 0.2220 | 95.00% |
| MD29 | 160 | 0.1838 | 0.1596 | 0.2240 | 95.00% |
| Testing phase | |||||
| Actual | 20 | 0.3140 | 0.1976 | 0.4284 | 95.00% |
| MD1 | 20 | 0.2930 | 0.1120 | 0.4435 | 95.00% |
| MD10 | 20 | 0.2931 | 0.1126 | 0.4515 | 95.00% |
| MD16 | 20 | 0.2998 | 0.1313 | 0.4560 | 95.00% |
| MD21 | 20 | 0.2936 | 0.1028 | 0.4831 | 95.00% |
| MD26 | 20 | 0.3079 | 0.1365 | 0.4554 | 95.00% |
| MD29 | 20 | 0.3085 | 0.1333 | 0.4140 | 95.00% |
| Validation phase | |||||
| Actual | 20 | 0.1992 | 0.1349 | 0.2732 | 95.00% |
| MD1 | 20 | 0.2291 | 0.1169 | 0.3587 | 95.00% |
| MD10 | 20 | 0.2291 | 0.1169 | 0.3587 | 95.00% |
| MD16 | 20 | 0.2291 | 0.1169 | 0.3587 | 95.00% |
| MD21 | 20 | 0.2024 | 0.1043 | 0.2892 | 95.00% |
| MD26 | 20 | 0.2108 | 0.0982 | 0.3230 | 95.00% |
| MD29 | 20 | 0.2143 | 0.1010 | 0.2824 | 95.00% |
Uncertainty analysis (UA)
Assessing the reliability of soft computing models is crucial for accurately predicting results, particularly in scenarios like projecting the PPV resulting from quarry blasting. This study employs UA to gauge the prediction error of the utilized models across both training and testing phases. A comparison between predicted outputs and actual data points is imperative to evaluate model reliability, for which UA proves highly suitable. This analysis involves computing various statistical measures such as absolute error, margin of error (MOE), standard deviation (StDev), standard error (SE), margin of error at a 95% confidence level (ME), white blood cell count (WBC), upper bound (UB), and lower bound (LB). The findings are subsequently documented in Table 11. A successful model regularly demonstrates a reduced WCB value47.
Table 11.
Results obtained from the uncertainty analysis (UA).
| Model ID | MOE | SD | SE | ME | LB | UB | WCB | Rank |
|---|---|---|---|---|---|---|---|---|
| Training phase | ||||||||
| MD1 | 0.0078 | 0.0082 | 0.0006 | 0.0013 | 0.0024 | 0.0132 | 0.0108 | 6 |
| MD10 | 0.0078 | 0.0082 | 0.0006 | 0.0013 | 0.0031 | 0.0124 | 0.0092 | 5 |
| MD16 | 0.0073 | 0.0075 | 0.0006 | 0.0012 | 0.0049 | 0.0096 | 0.0047 | 2 |
| MD21 | 0.0077 | 0.0088 | 0.0007 | 0.0014 | 0.0074 | 0.0080 | 0.0006 | 4 |
| MD26 | 0.0074 | 0.0075 | 0.0006 | 0.0012 | 0.0057 | 0.0091 | 0.0034 | 3 |
| MD29 | 0.0072 | 0.0075 | 0.0006 | 0.0012 | 0.0053 | 0.0091 | 0.0038 | 1 |
| Testing phase | ||||||||
| MD1 | 0.0091 | 0.0097 | 0.0022 | 0.0043 | 0.0030 | 0.0213 | 0.0182 | 2 |
| MD10 | 0.0093 | 0.0099 | 0.0022 | 0.0043 | 0.0032 | 0.0217 | 0.0185 | 3 |
| MD16 | 0.0096 | 0.0091 | 0.0020 | 0.0040 | 0.0027 | 0.0165 | 0.0137 | 6 |
| MD21 | 0.0095 | 0.0098 | 0.0022 | 0.0043 | 0.0001 | 0.0190 | 0.0189 | 5 |
| MD26 | 0.0094 | 0.0086 | 0.0019 | 0.0038 | 0.0046 | 0.0141 | 0.0095 | 4 |
| MD29 | 0.0083 | 0.0074 | 0.0017 | 0.0032 | 0.0016 | 0.0150 | 0.0134 | 1 |
| Validation phase | ||||||||
| MD1 | 0.0089 | 0.0079 | 0.0018 | 0.0035 | 0.0007 | 0.0185 | 0.0177 | 6 |
| MD10 | 0.0089 | 0.0079 | 0.0018 | 0.0035 | 0.0007 | 0.0185 | 0.0177 | 5 |
| MD16 | 0.0089 | 0.0079 | 0.0018 | 0.0035 | 0.0007 | 0.0185 | 0.0177 | 4 |
| MD21 | 0.0076 | 0.0082 | 0.0018 | 0.0036 | 0.0016 | 0.0136 | 0.0120 | 2 |
| MD26 | 0.0081 | 0.0082 | 0.0018 | 0.0036 | 0.0022 | 0.0184 | 0.0162 | 3 |
| MD29 | 0.0068 | 0.0069 | 0.0015 | 0.0030 | 0.0041 | 0.0177 | 0.0136 | 1 |
Table 11 indicates that models MD1, MD10, MD16, MD21, MD26, and MD29 both for training, testing, and validation in the uncertainty analysis, with MD29 getting the highest position. The width of the confidence bound (WCB) of various models has been examined to establish the most accurate architectural model for predicting the positive predictive value PPV of blasting.
In comparing the computational costs of different algorithms for predicting PPV resulting from blasting vibrations. While simpler algorithms like linear regression offer relatively fast computation times, they often struggle to capture the intricacies of the geological and blasting parameters that influence PPV accurately. Conversely, more sophisticated methods such as RVM or ensemble techniques like random forests may demand higher computational resources due to their complexity, especially during model training and optimization. Moreover, employing advanced techniques like convolutional neural networks (CNNs) for predicting the PPV could substantially increase computational expenses, especially due to the extensive preprocessing of data and fine-tuning of the model. Balancing computational efficiency with predictive accuracy is crucial in selecting the optimal algorithm for our PPV prediction task, ensuring timely insights into potential blast-induced ground vibrations while maintaining computational feasibility. The comparison of computational cost of this study both for training, testing and validation have summarised in Table 12. Based on Table 12, MD29 shows the highest value of comparison of computational cost such as 0.7243 in training, 0.0180 in testing, and 0.0191 in validation.
Table 12.
Comparison of computational cost.
| Model | Train | Test | Valid |
|---|---|---|---|
| MD1 | 0.5342 | 0.012 | 0.0141 |
| MD10 | 0.4892 | 0.0031 | 0.0097 |
| MD16 | 0.1982 | 0.0016 | 0.0095 |
| MD21 | 0.6388 | 0.0150 | 0.0168 |
| MD26 | 0.2491 | 0.0018 | 0.0118 |
| MD29 | 0.7243 | 0.0180 | 0.0191 |
Significant values are in bold.
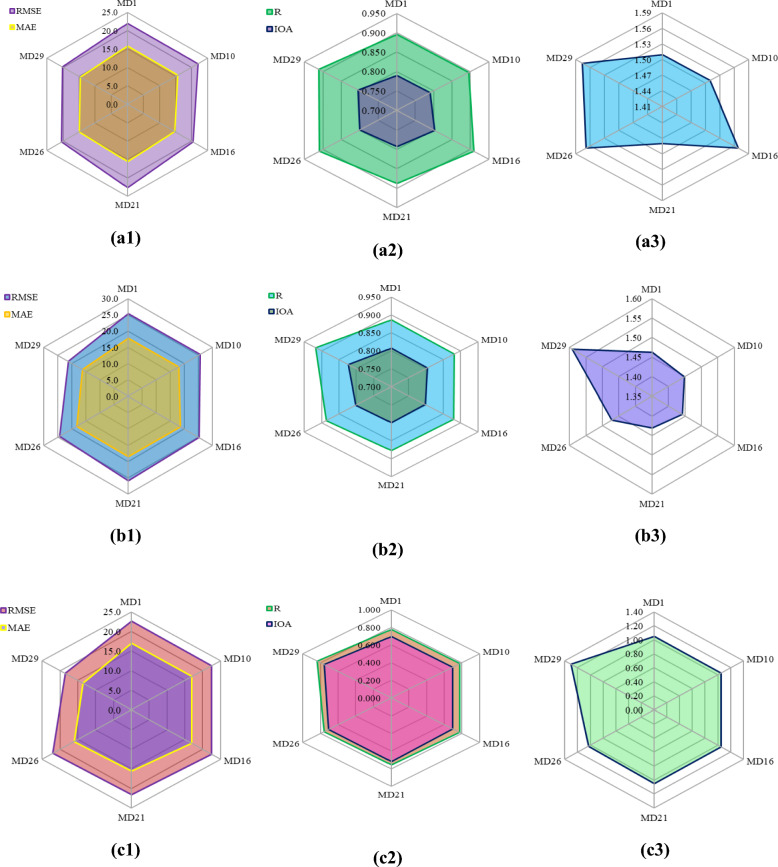
Figure 17 shows radar charts that show two mathematical measures used to rate how well training, testing, and validation sets work when using various optimization models48. To make it easier to compare the models, a thorough scoring method was employed. Using this method, many success indicators are put together and given a rank number based on how well they work. In our study, we calculate the final score for each model by summing up their individual ranks. The model with the highest total score is considered the best performing one.
Fig. 17.
Illustration of radar plots of RMSE & MAE (a1, b1, c1), R & IOA (a2, b2, c2), and PI (a3, b3, c3) in the prediction of ground vibration during (a) training, (b) testing, (c) validation.
Conclusion and summary
A precise and accurate assessment of ground vibration in the mining project is essential to mining engineering. Many researchers developed, trained, tested, and analysed machines, advanced machine, deep, and hybrid learning models in assessing ground vibration. This investigation utilized the conventional and optimized RVM models for the first time in ground vibration prediction. Thus, this work compares 33 RVM models (6 SRVM + 6 SRVM_GA + 6 SRVM_PSO, 5 DRVM, 5 DRVM_GA, 5 DRVM_PSO) to find the optimal performance model. The following conclusions have been mapped from the outcomes of the several analyses.
Capabilities of RVM models: The performance evaluation of each RVM model demonstrates each model achieved a performance of more than 0.85 in the testing phase, presenting a good agreement between actual and predicted ground vibrations.
Impact of Dual Kernel: The comparison of conventional SRVM and DRVM models reveals that implementing the secondary kernel function enhances the accuracy and performance of the single kernel based RVM models. Also, dual-kernel RVM models achieve higher computational costs than single-kernel SRVM models.
Effect of Optimization Algorithm: The genetic and particle swarm algorithms optimized each SRVM and DRVM model in this work. The analysis of performance reveals that the genetic and particle swarm algorithms did not improve the performance of SRVM models. Conversely, a significant performance improvement has been observed for DRVM models. The comparison of SRVM_GA, SRVM_PSO, DRVM_GA, and DRVM_PSO revealed that GA and PSO-optimized DRVM models achieved higher performance than SRVM_GA and SRVM_PSO models.
Optimal Performance Model : The analysis of performance metrics (RMSE = 21.2999 mm/s, 16.2272 mm/s, R = 0.9175, PI = 1.59, IOA = 0.8239, IOS = 0.2541), score analysis (= 93), REC curve (= 6.85E-03, close to the actual, i.e., 0), curve fitting (= 1.05 close to best fit, i.e., 1), AD test (= 11.607 close to the actual, i.e., 9.790), Wilcoxon test (= 95%), Uncertainty analysis (WCB = 0.0134), and computational cost (= 0.0180) demonstrate that PSO_DRVM model MD29 outperformed the MD1 (conventional SRVM), MD10 (SRVM_GA), MD16 (SRVM_PSO), MD21 (Conventional DRVM), and MD26 (DRVM_GA) models in the testing phase.
To conclude, the present investigation introduces a particle swarm-optimized Gaussian + exponential kernel-based DRVM model as an optimal performance model for assessing ground vibration in rock blasting. The performance and accuracy of model MD29 demonstrates high capabilities. Therefore, the MD29 model may be implemented to estimate the blasting vibration in mining projects. The current investigation uses 200 data points, which is a research limitation. The overfitting of the soft computing models may be examined using more field databases. In addition, this investigation may be extended by implementing metaheuristic algorithms, i.e., evolutionary, physical, nature, swarm-based, and biological algorithms. As per the authors' knowledge, the present work implements and compares the single kernel-based SRVM, dual kernel-based DRVM, SRVM_GA, SRVM_PSO, DRVM_GA, and DRVM_PSO models in assessing the ground vibrations for the first time. This research will help mining engineers and designers select the best kernel function and its hyperparameters in estimating ground vibration. Future research directions of this study include applying the model to different geological conditions, rock mass condition and explosive property and comparing its performance against other state-of-the-art predictive models. Additionally, investigating the impact of varying blasting parameters and environmental conditions on ground vibration predictions will provide more comprehensive insights.
Abbreviations
- ANFIS
Adaptive neuro-fuzzy inference system
- ANN-BR
Bayesian regularization-based artificial neural network
- AOC
Area over the curve
- B
Burden
- B/De
Burden-to-diameter ratio
- B/S
Burden-to-spacing
- BF
Bias factor
- Bi
Blastability Index
- CAM
Cosine amplitude method
- CART
Classification and regression tree
- CHIAD
Chi-square automatic interaction detection
- D
Hole diameter
- df
Degree of freedom
- DI
Distance from the blast face
- DPR
Delay per row
- E
Young's modulus
- ELM
Extreme learning machine
- f
Rock hardness
- F
F state
- F Crit
F critical
- FA
Firefly algorithm
- FIS
Fuzzy inference system
- GEP
Gene expression programming
- G-LSSVM
Gaussian kernel function-based LSSVM
- H/B
Stiffness ratio
- HD
Hole depth
- HD/B
Hole depth-to-burden ratio
- HKM
K-means clustering
- HL
Hole length
- ICA
Imperialist competitive algorithm
- IOA
Index of agreement
- IOS
Index of scatter
- IQR
Interquartile range
- Js
Joint spacing
- L-LSSVM
Linear kernel function-based LSSVM
- LMI
Legate and McCabe's Index
- LSSVM
Least square support vector machine
- LSTM
Long short-term memory
- MAE
Mean absolute error
- MAPE
Mean absolute percentage error
- Max.
Maximum
- MC
Maximum charge per delay
- Min.
Minimum
- MS
Means square
- MSSD
Mean of the squared successive differences
- N
Number of rows
- n
Number of drilling holes
- N
Number of datapoints
- N*
Number of missing datapoints
- NMBE
Normalized mean bias error
- NS
Nash-Sutcliffe efficiency
- PF
Powder factor
- PI
Performance index
- P-LSSVM
Polynomial kernel function-based LSSVM
- PPV
Peak particle velocity
- PSO
Particle swarm optimization
- Q
Explosive weight
- Q1
First quartile
- Q3
Third quartile
- R
Correlation coefficient
- R2
Coefficient of determination
- RD
Rock density
- REC
Regression error characteristics curve
- RF
Random forest
- RMR
Rock mass rating
- RMSE
Root mean square error
- ROC
Receiver operating characteristic curve
- RQD
Rock quality designation
- RSR
Root mean square error to observation’s standard deviation ratio
- RVM
Relevance vector machine
- S
Spacing
- SC
Specific charge
- SCA
Sine Cosine Algorithm
- SD
Sub-drilling
- SD
Scaling distance
- SE
Square error
- SS
Sum of squares
- SSO
Sparrow search optimization
- ST
Stemming
- StDev
Standard deviation
- SVM
Support vector machine
- TC
Total charge
- TS
Tensile strength
- UCS
Uniaxial compressive strength
- VAF
Variance accounted for
- VIF
Variance inflation factor
- Vp
P-wave velocity
- WMAPE
Weighted mean absolute percentage error
- WOA
Whale optimization algorithm
- XGBoost
Extreme gradient boosting
Author contributions
Y.F, and J.K: Conceptualization, Methodology, Investigation, Software, Writing – original draft, Application of AI models, Relevance vector machine model development, Statistical analysis, Detailing, and Overall analysis. H.I, K.S.G, and H.T.: Conceptualization, Resources, Supervision, Testing. Y.F and J.K.: Conceptualization, Writing – original draft, Methodology, Software, Investigation, Resources, Validation, Formal analysis. Y.F, N.O. and J.K.: Investigation, Formal analysis, Validation, Software, Writing – review & editing. H.I, K.S.G, T.A, and H.T.: Visualization, Validation, Project administration, acquired the funding for this research.: Investigation, Formal analysis, Validation, Software, Writing – review & editing. H.T. T.A., and Y. K.: Visualization, Project administration, Software, Formal analysis, Validation, Writing – review & editing.
Funding
Yewuhalashet Fissha want to acknowledge the funding supported by Akita University Fellowship Program.
Data availability
All data generated or analysed during this study are included in this article.
Competing interests
The authors declare no competing interests.
Footnotes
Publisher's note
Springer Nature remains neutral with regard to jurisdictional claims in published maps and institutional affiliations.
Contributor Information
Yewuhalashet Fissha, Email: yowagaye@gmail.com.
Jitendra Khatti, Email: jitendrakhatti197@gmail.com.
References
- 1.B. O. Taiwo et al. Assessment of charge initiation techniques effect on blast fragmentation and environmental safety: An application of WipFrag software. 1–17 (2023).
- 2.Taiwo, B. O. et al. Artificial neural network modeling as an approach to limestone blast production rate prediction: A comparison of PI-BANN and MVR models. J. Min. Environ.14(2), 375–388. 10.22044/jme.2023.12489.2266 (2023). 10.22044/jme.2023.12489.2266 [DOI] [Google Scholar]
- 3.Y. Fissha, H. Ikeda, H. Toriya, N. Owada, T. Adachi, & Y. Kawamura. Evaluation and prediction of blast-induced ground vibrations: A Gaussian Process Regression (GPR) Approach. 659–682 (2023).
- 4.Zhou, J., Li, C., Koopialipoor, M., Armaghani, D. J. & Pham, B. T. Development of a new methodology for estimating the amount of PPV in surface mines based on prediction and probabilistic models (GEP). Int. J. Mining Reclam. Environ.35(1), 48–68. 10.1080/17480930.2020.1734151 (2021). 10.1080/17480930.2020.1734151 [DOI] [Google Scholar]
- 5.H. Zhang, J. Zhou, D. J. Armaghani, M. M. Tahir, & B. T. Pham. Applied sciences A combination of feature selection and random forest techniques to solve a problem related to. Appl. Sci. (2020).
- 6.Choudhary, B. S. & Agrawal, A. Minimization of blast-induced hazards and efficient utilization of blast energy by implementing a novel stemming plug system for eco-friendly blasting in open pit mines. Nat. Resour. Res.31(6), 3393–3410. 10.1007/s11053-022-10126-8 (2022). 10.1007/s11053-022-10126-8 [DOI] [Google Scholar]
- 7.Olamide Taiwo, B. Improvement of small-scale dolomite blasting productivity: Comparison of existing empirical models with image analysis software and artificial neural network models. J. Min. Environ.13(3), 627–641. 10.22044/jme.2022.11771.2169 (2022). 10.22044/jme.2022.11771.2169 [DOI] [Google Scholar]
- 8.Fissha, Y., Ikeda, H., Toriya, H., Adachi, T. & Kawamura, Y. Application of Bayesian Neural Network (BNN) for the prediction of blast-induced ground vibration. Appl. Sci.10.3390/app13053128 (2023). 10.3390/app13053128 [DOI] [Google Scholar]
- 9.Zhou, J., Zhang, Y. & Qiu, Y. State-of-the-Art Review of Machine Learning and Optimization Algorithms Applications in Environmental Effects of Blasting (Springer Netherlands., 2024). 10.1007/s10462-023-10636-8. [Google Scholar]
- 10.Hosseini, S. et al. Assessment of the ground vibration during blasting in mining projects using different computational approaches Cosine amplitude method. Sci. Rep.10.1038/s41598-023-46064-5 (2023). 10.1038/s41598-023-46064-5 [DOI] [PMC free article] [PubMed] [Google Scholar]
- 11.Lawal, A. I., Kwon, S., Hammed, O. S. & Idris, M. A. Blast-induced ground vibration prediction in granite quarries: An application of gene expression programming, ANFIS, and sine cosine algorithm optimized International Journal of Mining Science and Technology Blast-induced ground vibration prediction in. Int. J. Min. Sci. Technol.10.1016/j.ijmst.2021.01.007 (2021). 10.1016/j.ijmst.2021.01.007 [DOI] [Google Scholar]
- 12.Chen, W., Hasanipanah, M., Nikafshan Rad, H., Jahed Armaghani, D. & Tahir, M. M. A new design of evolutionary hybrid optimization of SVR model in predicting the blast-induced ground vibration. Eng. Comput.37(2), 1455–1471. 10.1007/s00366-019-00895-x (2021). 10.1007/s00366-019-00895-x [DOI] [Google Scholar]
- 13.S. Alzabeebee, M. Jamei, M. Hasanipanah, & H. B. Amnieh. Development of a new explicit soft computing model to predict the blast-induced ground vibration. (2022), 10.12989/gae.2022.30.6.551.
- 14.Erten, O., Konak, G., Kizil, M. S., Onur, A. H. & Karakus, D. Analysis of quarry-blast-induced ground vibrations to mitigate their adverse effects on nearby structures. Int. J. Min. Miner. Eng.1(4), 313–326. 10.1504/IJMME.2009.029317 (2009). 10.1504/IJMME.2009.029317 [DOI] [Google Scholar]
- 15.Khandelwal, M. & Singh, T. N. Prediction of blast-induced ground vibration using artificial neural network. Int. J. Rock Mech. Min. Sci.46(7), 1214–1222. 10.1016/j.ijrmms.2009.03.004 (2009). 10.1016/j.ijrmms.2009.03.004 [DOI] [Google Scholar]
- 16.Zhang, Y., He, H., Khandelwal, M., Du, K. & Zhou, J. Knowledge mapping of research progress in blast-induced ground vibration from 1990 to 2022 using CiteSpace-based scientometric analysis. Environ. Sci. Pollut. Res.30(47), 103534–103555. 10.1007/s11356-023-29712-1 (2023). 10.1007/s11356-023-29712-1 [DOI] [PubMed] [Google Scholar]
- 17.Ragam, P. & Nimaje, D. S. Assessment of blast-induced ground vibration using different predictor approaches—A comparison. Chem. Eng. Trans.66, 487–492. 10.3303/CET1866082 (2018). 10.3303/CET1866082 [DOI] [Google Scholar]
- 18.Alipour, A., Mokhtarian, M. & Sharif, J. A. Artificial neural network or empirical criteria? A comparative approach in evaluating maximum charge per delay in surface mining—Sungun copper mine. J. Geol. Soc. India79(6), 652–658. 10.1007/s12594-012-0102-3 (2012). 10.1007/s12594-012-0102-3 [DOI] [Google Scholar]
- 19.Taheri, K., Hasanipanah, M., Golzar, S. B. & Majid, M. Z. A. A hybrid artificial bee colony algorithm-artificial neural network for forecasting the blast-produced ground vibration. Eng. Comput.33(3), 689–700. 10.1007/s00366-016-0497-3 (2017). 10.1007/s00366-016-0497-3 [DOI] [Google Scholar]
- 20.Nguyen, H., Bui, X.-N. & Topal, E. Reliability and availability artificial intelligence models for predicting blast-induced ground vibration intensity in open-pit mines to ensure the safety of the surroundings. Reliab. Eng. Syst. Saf.231, 109032 (2023). 10.1016/j.ress.2022.109032 [DOI] [Google Scholar]
- 21.Zhang, H. et al. A combination of feature selection and random forest techniques to solve a problem related to blast-induced ground vibration. Appl. Sci.10.3390/app10030869 (2020).34306737 10.3390/app10030869 [DOI] [Google Scholar]
- 22.Zhou, J., Asteris, P. G., Armaghani, D. J. & Pham, B. T. Prediction of ground vibration induced by blasting operations through the use of the Bayesian Network and random forest models. Soil Dyn. Earthq. Eng.10.1016/j.soildyn.2020.106390 (2020). 10.1016/j.soildyn.2020.106390 [DOI] [Google Scholar]
- 23.Huang, J., Koopialipoor, M. & Armaghani, D. J. A combination of fuzzy Delphi method and hybrid ANN-based systems to forecast ground vibration resulting from blasting. Sci. Rep.10(1), 1–21 (2020). 10.1038/s41598-020-76569-2 [DOI] [PMC free article] [PubMed] [Google Scholar]
- 24.J. Zhou, C. Li, M. Koopialipoor, D. J. Armaghani, B. T. Pham. (2020) Development of a new methodology for estimating the amount of PPV in surface mines based on prediction and probabilistic models (GEP-MC). Int. J. Mining, Reclam. Environ. 10.1080/17480930.2020.1734151.
- 25.Nguyen, H., Bui, X.-N., Tran, Q.-H. & Mai, N.-L. A new soft computing model for estimating and controlling blast-produced ground vibration based on hierarchical K-means clustering and cubist algorithms. Appl. Soft Comput.77, 376–386 (2019). 10.1016/j.asoc.2019.01.042 [DOI] [Google Scholar]
- 26.Nguyen, H., Choi, Y., Bui, X. N. & Nguyen-Thoi, T. Predicting blast-induced ground vibration in open-pit mines using vibration sensors and support vector regression-based optimization algorithms. Sensors (Switzerland).10.3390/s20010132 (2020). 10.3390/s20010132 [DOI] [PMC free article] [PubMed] [Google Scholar]
- 27.Armaghani, D. J., Hasanipanah, M., Amnieh, H. B. & Mohamad, E. T. Feasibility of ICA in approximating ground vibration resulting from mine blasting. Neural Comput. Appl.29(9), 457–465 (2018). 10.1007/s00521-016-2577-0 [DOI] [Google Scholar]
- 28.Hasanipanah, M., Faradonbeh, R. S., Amnieh, H. B., Armaghani, D. J. & Monjezi, M. Forecasting blast-induced ground vibration developing a CART model. Eng. Comput.10.1007/s00366-016-0475-9 (2017). 10.1007/s00366-016-0475-9 [DOI] [Google Scholar]
- 29.Ghoraba, S., Monjezi, M., Talebi, N., Armaghani, D. J. & Moghaddam, M. R. Estimation of ground vibration produced by blasting operations through intelligent and empirical models. Environ. Earth Sci.10.1007/s12665-016-5961-2 (2016). 10.1007/s12665-016-5961-2 [DOI] [Google Scholar]
- 30.Shirani Faradonbeh, R. et al. Prediction of ground vibration due to quarry blasting based on gene expression programming: A new model for peak particle velocity prediction. Int. J. Environ. Sci. Technol.10.1007/s13762-016-0979-2 (2016). 10.1007/s13762-016-0979-2 [DOI] [Google Scholar]
- 31.Hajihassani, M., Armaghani, D. J., Marto, A. & Mohamad, E. T. Ground vibration prediction in quarry blasting through an artificial neural network optimized by imperialist competitive algorithm. Bull. Eng. Geol. Environ.74(3), 873–886 (2015). 10.1007/s10064-014-0657-x [DOI] [Google Scholar]
- 32.M. Hajihassani, D. Jahed, & A. Masoud. Blast-induced air and ground vibration prediction: A particle swarm optimization-based artificial neural network approach. (2015). 10.1007/s12665-015-4274-1.
- 33.Hasanipanah, M., Monjezi, M., Shahnazar, A., Jahed Armaghani, D. & Farazmand, A. Feasibility of indirect determination of blast induced ground vibration based on support vector machine. Meas. J. Int. Meas. Confed.10.1016/j.measurement.2015.07.019 (2015). 10.1016/j.measurement.2015.07.019 [DOI] [Google Scholar]
- 34.Armaghani, D. J., Momeni, E., Abad, S. V. A. N. K. & Khandelwal, M. Feasibility of ANFIS model for prediction of ground vibrations resulting from quarry blasting. Environ. Earth Sci.10.1007/s12665-015-4305-y (2015). 10.1007/s12665-015-4305-y [DOI] [Google Scholar]
- 35.Armaghani, D. J., Hajihassani, M., Mohamad, E. T., Marto, A. & Noorani, S. A. Blasting-induced flyrock and ground vibration prediction through an expert artificial neural network based on particle swarm optimization. Arab. J. Geosci.7(12), 5383–5396 (2014). 10.1007/s12517-013-1174-0 [DOI] [Google Scholar]
- 36.Mohamadnejad, M., Gholami, R. & Ataei, M. Comparison of intelligence science techniques and empirical methods for prediction of blasting vibrations. Tunn. Undergr. Sp. Technol.28, 238–244 (2012). 10.1016/j.tust.2011.12.001 [DOI] [Google Scholar]
- 37.Monjezi, M., Hasanipanah, M. & Khandelwal, M. Evaluation and prediction of blast-induced ground vibration at Shur River Dam, Iran, by artificial neural network. Neural Comput. Appl.22(7–8), 1637–1643. 10.1007/s00521-012-0856-y (2013). 10.1007/s00521-012-0856-y [DOI] [Google Scholar]
- 38.Mohamed, M. T. Performance of fuzzy logic and artificial neural network in prediction of ground and air vibrations. JES. J. Eng. Sci.39(2), 425–440 (2011). [Google Scholar]
- 39.A. Fi & C. Kuzu. Prediction of environmental impacts of quarry blasting operation using fuzzy logic. 461–470 (2011). 10.1007/s10661-010-1470-z. [DOI] [PubMed]
- 40.Iphar, M., Yavuz, M. & Ak, H. Prediction of ground vibrations resulting from the blasting operations in an open-pit mine by adaptive neuro-fuzzy inference system. Environ. Geol.10.1007/s00254-007-1143-6 (2008). 10.1007/s00254-007-1143-6 [DOI] [Google Scholar]
- 41.Hammed, O. S. et al. Peak particle velocity data acquisition for monitoring blast induced earthquakes in quarry sites. Data Br.19, 398–408. 10.1016/j.dib.2018.04.103 (2022). 10.1016/j.dib.2018.04.103 [DOI] [PMC free article] [PubMed] [Google Scholar]
- 42.Bahmed, I. T., Khatti, J. & Grover, K. S. Hybrid soft computing models for predicting unconfined compressive strength of lime stabilized soil using strength property of virgin cohesive soil. Bull. Eng. Geol. Environ.10.1007/s10064-023-03537-1 (2024). 10.1007/s10064-023-03537-1 [DOI] [Google Scholar]
- 43.Khatti, J., Grover, K. S., Kim, H. J., Mawuntu, K. B. A. & Park, T. W. Prediction of ultimate bearing capacity of shallow foundations on cohesionless soil using hybrid LSTM and RVM approaches: An extended investigation of multicollinearity. Comput. Geotech.165, 105912. 10.1016/j.compgeo.2023.105912 (2024). 10.1016/j.compgeo.2023.105912 [DOI] [Google Scholar]
- 44.J. Qui. Learning with uncertainty—Gaussian processes and relevance vector machines. (2004).
- 45.Ghorbani, B., Arulrajah, A., Narsilio, G., Horpibulsuk, S. & Win, M. ScienceDirect Development of genetic-based models for predicting the resilient modulus of cohesive pavement subgrade soils. Soils Found.60(2), 398–412. 10.1016/j.sandf.2020.02.010 (2020). 10.1016/j.sandf.2020.02.010 [DOI] [Google Scholar]
- 46.J. Khatti, H. Samadi, & K. S. Grover. in Estimation of Settlement of Pile Group in Clay Using Soft Computing Techniques, no. 0123456789. (Springer International Publishing, 2023). 10.1007/s10706-023-02643-x.
- 47.Bardhan, A., Samui, P., Ghosh, K., Gandomi, A. H. & Bhattacharyya, S. ELM-based adaptive neuro swarm intelligence techniques for predicting the California bearing ratio of soils in soaked conditions. Appl. Soft Comput.110, 107595. 10.1016/j.asoc.2021.107595 (2021). 10.1016/j.asoc.2021.107595 [DOI] [Google Scholar]
- 48.Xi, B., Li, E., Fissha, Y., Zhou, J. & Segarra, P. LGBM-based modeling scenarios to compressive strength of recycled aggregate concrete with SHAP analysis. Mech. Adv. Mater. Struct.10.1080/15376494.2023.2224782 (2023). 10.1080/15376494.2023.2224782 [DOI] [Google Scholar]
Associated Data
This section collects any data citations, data availability statements, or supplementary materials included in this article.
Data Availability Statement
All data generated or analysed during this study are included in this article.


