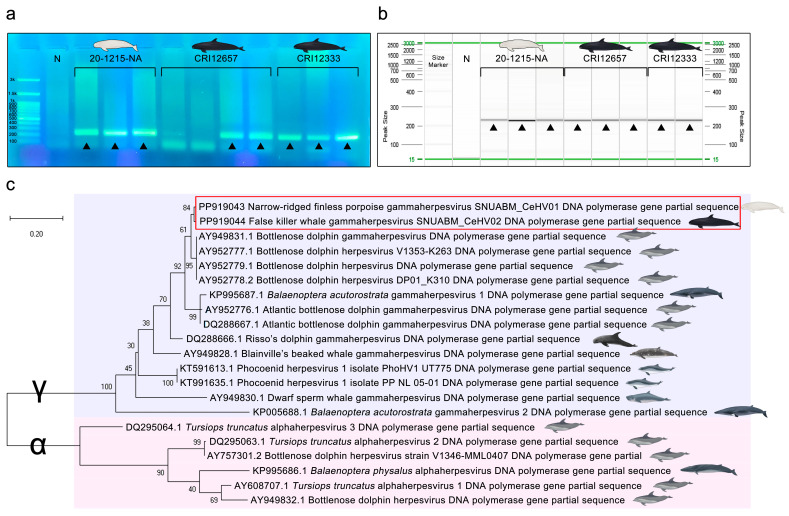
Figure 4.
Gel electrophoresis and phylogenetic tree indicating the genetic relationship of the cetacean herpesvirus DNA polymerase gene partial sequences. (a) Gel electrophoresis of each PCR product. “N” indicates the negative control. Positive bands of 220 bp were observed and are indicated by black triangles (▲). (b) Screen gel of each PCR product. “N” indicates the negative control. Positive bands of 220 bp were observed and are indicated by black triangles (▲). (c) The partial sequences of the previous cetacean herpesviruses and novel cetacean gammaherpesviruses SNUABM_CeHV01 (GenBank accession number PP919043) and SNUABM_CeHV02 (PP919044) were compared. The tree was constructed using the maximum-likelihood method after alignment with MUSCLE implemented in MEGA X with 1000 bootstraps. Cetacean gammaherpesviruses (indicated by γ) are indicated by the light-blue box, and cetacean alphaherpesviruses (indicated by α) are indicated by the light-pink box.

