

Abstract
Background
SARS-CoV-2 pneumonia can cause significant long-term radiological changes, even resembling pulmonary fibrosis. However, the risk factors for these long-term effects are unknown. This study aims to assess radiological abnormalities and their possible risk factors six months after hospital discharge due to COVID-19 pneumonia.
Material and methods
This cross-sectional study in a tertiary hospital included adults admitted for COVID-19 pneumonia from March 2020 to February 2021, who underwent high-resolution computed tomography (HRCT) scans of the chest six months after hospital discharge. The primary outcome was radiological abnormalities on HRCT, while the main explanatory variables were drawn from the patient’s medical history along with the disease course, analytical indicators, and the treatment received during admission.
Results
The 189 included patients had a mean age of 61.5 years; 70.9% were male, and hypertension was the main comorbidity (45%). About two-thirds (67.2%) presented acute respiratory distress syndrome (ARDS). Most (97.9%) received systemic corticosteroid therapy, and 81% presented pathological findings on HRCT, most commonly ground glass (63.5%), followed by bronchial dilatation (36%) and subpleural bands (25.4%). The multivariable analysis showed that age was the main risk factor, associated with most radiological changes. Other factors were the duration of corticosteroid therapy for ground glass (adjusted odds ratio [aOR] 1.020) as well as a longer stay in the intensive care unit (ICU) (aOR 1.290) and high levels of IL-6 for bronchial dilation (aOR 1.002).
Conclusion
Radiological involvement of the lungs six months after COVID-19 pneumonia is frequent, especially ground glass. Elderly patients with prolonged ICU admission and a significant inflammatory response measured by IL-6 are more likely to present worse radiological evolution and are candidates for radiological follow-up after COVID-19 pneumonia.
Supplementary Information
The online version contains supplementary material available at 10.1186/s12879-024-09767-2.
Keywords: COVID-19, Tomography, Pulmonary Fibrosis, SARS-CoV-2, Pneumonia
Background
Since the first case was reported in December 2019 until the time of writing, SARS-CoV-2 had caused nearly 800 million confirmed infections and almost 7 million confirmed deaths [1]. Most infections primarily affect the respiratory system, and the main cause of hospital admission is pneumonia, which sometimes even culminates in acute respiratory distress syndrome (ARDS). There is already evidence of long-term pulmonary sequelae in patients presenting with COVID-19 pneumonia, both in terms of respiratory function and radiological involvement [2–9]. In this line, one of the main concerns in the scientific community is the possibility of developing long-term pulmonary fibrosis [10], as reported in other similar infections like severe acute respiratory syndrome (SARS) and Middle East respiratory syndrome (MERS) [11, 12]. The appearance of fibrotic changes in the lung parenchyma after ARDS has also been described [13, 14]. Thus, this study aimed to assess the radiological evolution at six months in patients who required hospital admission due to SARS-CoV-2 pneumonia and to identify factors that could influence it.
Material and methods
Study design and participants
This cross-sectional study took place in a tertiary hospital serving 283,000 inhabitants in the city of Castellón (Spain). It included consecutively recruited adults (≥ 18 years) admitted from March 2020 to February 2021 in the Infectious Diseases Unit due to SARS-CoV-2 pneumonia, confirmed by real-time polymerase chain reaction (RT-PCR) or antigen test, and who underwent high-resolution computed tomography (HRCT) of the chest at six months’ follow-up (Fig. 1). Given the existing collapse of the health care system during the study period, chest HRCTs at six months after hospital admission were prioritized for patients who had required high-flow oxygen therapy during admission, had been treated with biological drugs such as tocilizumab, had significant radiological involvement at hospital discharge, or had been admitted to the intensive care unit (ICU).
Fig. 1.
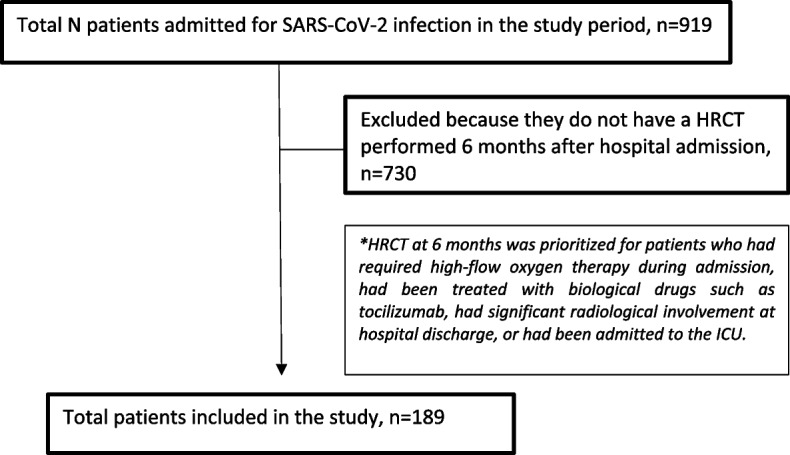
Patient flow chart
Variables
The primary outcome variable was radiological abnormalities on the six-month HRCT, including: ground glass, bronchial dilatation, atelectasis, fibrotic tracts, subpleural reticulation, septal thickening, parenchymal bands, and subpleural bands. These radiological findings were selected because they are the most frequently described in the literature as caused by COVID-19 pneumonia [4–9]. The HRCTs were performed by two specialists in thoracic radiology, who were unaware of the patients’ clinical evolution.
Explanatory variables were drawn from the patient's medical history (age, sex, toxic habits, cardiovascular risk factors, chronic diseases), along with variables related to the clinical evolution during admission (ARDS, type of respiratory support, minimum PaO2/FiO2 ratio, maximum FiO2 required, need for ICU admission, length of ICU and hospital stay), treatment received during hospital admission, and the maximum analytical values of C-reactive protein (CRP), ferritin, IL-6, and D-dimer during the acute episode.
The patients were followed up throughout the study, and data were extracted from the patient's electronic record using the Orion Clinic computer program (Conselleria de Sanitat Universal i Salut Publica, Comunidad Valenciana, Spain). Likewise, all the radiological reports of the HRCT performed six months after admission were reviewed to detect abnormalities.
Statistical analysis
The statistical analysis was undertaken using the SPSS computer program (version 23; IBM). For the descriptive analysis, quantitative variables were expressed as means (standard deviation, SD) or medians (interquartile range, IQR), depending on the normality of the distribution. Qualitative variables were described as absolute and relative frequencies. The association between outcome and explanatory variables was quantified using either the odds ratios (ORs) and 95% confidence intervals (CIs) (for qualitative variables) or the student's T or Mann–Whitney U test for the quantitative ones, as appropriate. P values of less than 0.05 were considered statistically significant. Subsequently, a multivariable logistic regression was fitted with the variables that had shown a significant association with the outcome in the univariable study and adjusted for sex and age.
Ethics statement
The study was approved by the ethics committee called “Medicine Research Ethics Committee of Castellón General University Hospital”, according to the guidelines of the Spanish Agency for Medicines and Health Products. Medicine Research Ethics Committee of Castellón General University Hospital accepted the waiver of informed consent as the study did not alter the routine management of the patients. Patients’ confidentiality and data were protected according to Regulation (EU) 2016/679 of the European Parliament and of the Council of April 27, 2016 on the protection of natural persons with regard to the processing of personal data and the free circulation of such data.
Results
Study sample
During the study period, a total of 919 patients were admitted for SARS-CoV-2 infection. The study included 189 patients who underwent HRCT at six months’ follow-up. They were mostly men (70.9%) and had a mean age of 61.5 years; hypertension was the main comorbidity (45%). A high proportion had presented ARDS (67.2%), frequently requiring ICU admission (47.6%) and non-invasive mechanical ventilation (NIMV), with CPAP-Helmet as the main respiratory support (45.5%). The main systemic treatment administered was corticosteroids (97.9%), and the median length of hospital stay was 14 days. The maximum analytical values reached during admission were as follows: CRP 116 mg/L (IQR 69–172); ferritin 924 mcg/L (IQR 560–1435); IL-6 57 ng/L (IQR 26–120); and D-dimer 1380 ng/mL (IQR 790–3525). The rest of the descriptive results are shown in Table 1.
Table 1.
Main radiological changes 6 months after admission for COVID-19 pneumonia and analysis of its risk factors
| Total (n=189) | Ground glass (n=120; 63.5%) | Bronchial dilatation (n=68; 36%) | Subpleural bands (n=48; 25.4%) | Subpleural reticulation (n=38; 20.1%) | |||||||||
|---|---|---|---|---|---|---|---|---|---|---|---|---|---|
| Qualitative variables, n (%) | |||||||||||||
| Medical history | No | Yes | No | Yes | No | Yes | No | Yes | |||||
| Male | 134 (70.9) | 47 (35.1) | 87 (64.9) | 86 (64.2) | 48 (35.8) | 101 (75.4) | 33 (24.6) | 105 (78.4) | 29 (21.6) | ||||
| Smoker/ex-smoker | 50 (26.5) | 17 (34) | 33 (66) | 32 (64) | 18 (36) | 37 (74) | 13 (26) | 38 (76) | 12 (24) | ||||
| Hypertension | 85 (45.0) | 25 (29.4) | 60 (70.6) | 49 (57.6) | 36 (42.4) | 62 (72.9) | 23 (27.1) | 68 (80) | 17 (20) | ||||
| Dyslipidemia | 62 (32.8) | 26 (41.9) | 36 (58.1) | 40 (64.5) | 22 (35.5) | 41 (66.1) | 21 (33.9) | 47 (75.8) | 15 (24.2) | ||||
| Obesity (BMI>30 km/m2) | 65 (34.4) | 23 (35.4) | 42 (64.6) | 43 (66.2) | 22 (33.8) | 46 (70.8) | 19 (29.2) | 49 (75.4) | 16 (24.6) | ||||
| Ischemic cardiopathy | 8 (4.2) | 2 (25) | 6 (75) | 4 (50) | 4 (50) | 3 (37.5) | 5 (62.5)a | 4 (50) | 4 (50)a | ||||
| Cardiac insufficiency | 3 (1.6) | 0 (0) | 3 (100) | 1 (33.3) | 2 (66.7) | 2 (66.7) | 1 (33.3) | 1 (33.3) | 2 (66.7) | ||||
| COPD | 1 (0.5) | 0 (0) | 1 (100) | 0 (0) | 1 (100) | 1 (100) | 0 (0) | 1 (100) | 0 (0) | ||||
| Chronic bronchitis | 2 (1.1) | 1 (50) | 1 (50) | 1 (50) | 1 (50) | 2 (100) | 0 (0) | 2 (100) | 0 (0) | ||||
| Asthma | 1 (0.5) | 1 (100) | 0 (0) | 0 (0) | 1 (100) | 1 (100) | 0 (0) | 1 (100) | 0 (0) | ||||
| Chronic kidney disease | 3 (1.6) | 0 | 3 (100) | 1 (33.3) | 2 (66.7) | 1 (33.3) | 2 (66.7) | 2 (66.7) | 1 (33.3) | ||||
| Diabetes | 30 (15.9) | 12 (40) | 18 (60) | 16 (53.3) | 14 (46.7) | 23 (76.7) | 7 (23.3) | 25 (83.3) | 5 (16.7) | ||||
| Disease course, n (%) | |||||||||||||
| ARDS | 127 (67.2) | 42 (33.1) | 85 (66.9) | 74 (58.3) | 53 (41.7)a | 91 (71.7) | 36 (28.3) | 99 (78) | 28 (22) | ||||
| ICU | 90 (47.6) | 26 (28.9) | 64 (71.1)a | 53 (58.9) | 37 (41.1) | 59 (65.6) | 31 (34.4)a | 70 (77.8) | 20 (22.2) | ||||
| CPAP-Helmet | 86 (45.5) | 26 (30.2) | 60 (69.8) | 52 (60.5) | 34 (39.5) | 57 (66.3) | 29 (33.7)a | 65 (75.6) | 21 (24.4) | ||||
| High flow oxygen | 15 (7.9) | 6 (40) | 9 (60) | 4 (26.7) | 11 (73.3)a | 8 (53.3) | 7 (46.7) | 13 (86.7) | 2 (13.3) | ||||
| Mechanical ventilation | 11 (5.8) | 4 (36.4) | 7 (63.6) | 3 (27.3) | 8 (72.7) | 7 (63.6) | 4 (36.4) | 10 (90.9) | 1 (9.1) | ||||
| Treatment, n (%) | |||||||||||||
| Lopinavir/ritonavir | 8 (4.2) | 3 (37.5) | 5 (62.5) | 2 (25) | 6 (75)a | 8 (100) | 0 (0)b | 7 (87.5) | 1 (12.5) | ||||
| Hydroxychloroquine | 8 (4.2) | 3 (37.5) | 5 (62.5) | 2 (25) | 6 (75)a | 8 (100) | 0 (0)b | 7 (87.5) | 1 (12.5) | ||||
| Tocilizumab | 28 (14.8) | 7 (25) | 21 (75) | 17 (60.7) | 11 (39.3) | 21 (75) | 7 (25) | 23 (82.1) | 5 (17.9) | ||||
| Corticosteroids | 185 (97.9) | 68 (36.8) | 117 (63.2) | 120 (64.9) | 65 (35.1) | 137 (74.1) | 48 (25.9)b | 147 (79.5) | 38 (20.5)b | ||||
| Quantitative variablesc | No | Yes | p | No | Yes | P | No | Yes | p | No | Yes | P | |
| Age (years), mean (SD)d (n=189) | 61 (11) | 58 (12) | 63 (10) | <0.001 | 60 (11) | 65 (10) | 0.002 | 60 (12) | 65 (9) | 0.010 | 61 (12) | 64 (9) | 0.130 |
| Analytical values | |||||||||||||
| Max CRP (mg/L) (n=189) | 116 (69-172) | 111 (69-153) | 128 (68-183) | 0.370 | 111 (70-151) | 149 (65-194) | 0.043 | 108 (69-163) | 152 (86-192) | 0.056 | 116 (70-166) | 116 (58-187) | 0.760 |
| Max ferritin (mcg/L) (n=188) | 923 (560-1435) | 850 (492-1262) | 993 (606-1671) | 0.110 | 953 (638-1570) | 863 (490-1320) | 0.340 | 887 (555-1443) | 1020 (559-1437) | 0.420 | 915 (556-1392) | 968 (588-1871) | 0.280 |
| Max IL-6 (ng/L) (n=168) | 57 (26-120) | 45 (24-78) | 62 (28-147) | 0.049 | 49 (24-81) | 79 (30-195) | 0.015 | 51 (26-102) | 61 (27-153) | 0.240 | 53 (25-123) | 61 (33-138) | 0.230 |
| Max D-dimers (ng/mL) (n=189) | 1380 (790-3525) | 1120 (665-2530) | 1570 (832-3925) | 0.089 | 1070 (729-2140) | 2570 (987-4997) | <0.001 | 1150 (740-2555) | 2615 (94-4467) | 0.005 | 1360 (770-3820) | 1475 (947-2635) | 0.790 |
| Minimum PaO2/FiO2 (%) (n=177) | 182 (111-324) | 213 (125-342) | 170 (108-313) | 0.043 | 200 (120-338) | 130 (102-256) | 0.013 | 199 (119-325) | 125 (103-310) | 0.089 | 190 (111-324) | 177 (114-292) | 0.560 |
| Maximum FiO2 (%) (n=189) | 60 (32-60) | 40 (32-60) | 60 (36-65) | 0.076 | 50 (32-60) | 60 (36-80) | 0.017 | 50 (32-60) | 60 (39-65) | 0.031 | 50 (32-60) | 60 (36-62) | 0.370 |
| Days of corticosteroids (n=189) | 50 (39-73) | 44 (38-57) | 54 (41-83) | 0.001 | 49 (38-62) | 85 (42-87) | 0.008 | 49 (39-69) | 58 (46-83) | 0.020 | 50 (39-73) | 54 (40-69) | 0.860 |
| Stay (days) | |||||||||||||
| ICU (n=90) | 6 (4-9) | 4 (3-9) | 6 (4-9) | 0.260 | 5 (4-7) | 7 (5-10) | 0.003 | 5 (4-8) | 7 (3-10) | 0.440 | 5 (4-9) | 7 (4-9) | 0.580 |
| Hospital stay (n=189) | 14 (9-19) | 11 (8-18) | 14 (10-20) | 0.023 | 12 (8-16) | 17 (11-23) | <0.001 | 13 (8-18) | 16 (11-24) | 0.011 | 14 (8-20) | 14 (11-19) | 0.380 |
BMI body mass index, COPD chronic obstructive pulmonary disease, ARDS acute respiratory distress syndrome, ICU intensive care unit, SD standard deviation, IQR interquartile range, CRP C reactive protein, IL-6 interleukin 6, PaO2 arterial partial pressure of oxygen, FiO2 inspiratory fraction of oxygen
aStatistically significant negative effect
bStatistically significant positive effect
cQuantitative variables expressed as median (IQR) and compared using the Mann-Whitney U test, unless otherwise noted
dStudent’s t-test for comparison of means
Univariable analysis of HRCT at six months
Pathological findings were present on chest HRCT in 81% of the patients. Ground glass was the most frequent (63.5%), followed by bronchial dilations (36%). Older age and duration of hospital stay were the main risk factors showing a significant association with poor radiological evolution and the presence of most pathological changes. Weaker associations included a history of ischemic heart disease, ARDS, ICU admission, prolonged ICU stay, minimum PaO2/FiO2 values, maximum FiO2 required, oxygen therapy with high-flow nasal cannula, invasive mechanical ventilation (IMV) (but not NIMV with CPAP-Helmet, except for subpleural bands), longer duration of corticosteroid therapy, and finally a greater inflammatory (high CRP, ferritin and IL-6) and prothrombotic (elevated D-dimer) response. Treatment with lopinavir/ritonavir or hydroxychloroquine was associated with a greater presence of bronchial dilatations and fibrotic tracts and a lower frequency of septal thickening, parenchymal bands, and subpleural bands. On the other hand, systemic corticosteroid therapy significantly reduced the presence of fibrotic tracts, subpleural reticulation, parenchymal bands, and subpleural bands. These and other results are shown in more detail in Tables 1 and 2 (the ORs and CIs for the qualitative variables are shown in the supplementary material).
Table 2.
Main radiological changes 6 months after admission for COVID-19 pneumonia and analysis of its risk factors (continued)
| Total (n=189) | Atelectasis (n=31; 16.4%) | Parenchymal bands (n=28; 14.8%) | Septal thickening (n=27; 14.3%) | Fibrotic tracts (n=21; 11.1%) | Normal (n=36; 19%) | |||||||||||
|---|---|---|---|---|---|---|---|---|---|---|---|---|---|---|---|---|
| Qualitative variables | n (%) | |||||||||||||||
| Medical history, n (%) | No | Yes | No | Yes | No | Yes | No | Yes | No | Yes | ||||||
| Male | 134 (70.9) | 112 (83.6) | 22 (16.4) | 116 (86.6) | 18 (13.4) | 113 (84.3) | 21 (15.7) | 118 (88.1) | 16 (11.9) | 106 (79.1) | 28 (20.9) | |||||
| Smoker/ex-smoker | 50 (26.5) | 44 (88) | 6 (12) | 45 (90) | 5 (10) | 45 (90) | 5 (10) | 45 (90) | 5 (10) | 39 (78) | 11 (22) | |||||
| Hypertension | 85 (45) | 71 (83.5) | 14 (16.5) | 73 (85.9) | 12 (14.1) | 74 (87.1) | 11 (12.9) | 75 (88.2) | 10 (11.8) | 73 (85.9) | 12 (14.1) | |||||
| Dyslipidemia | 62 (32.8) | 51 (82.3) | 11 (17.7) | 53 (85.5) | 9 (14.5) | 53 (85.5) | 9 (14.5) | 55 (88.7) | 7 (11.3) | 47 (75.8) | 15 (24.2) | |||||
| Obesity (BMI>30 km/m2) | 65 (34.4) | 53 (81.5) | 12 (18.5) | 57 (87.7) | 8 (12.3) | 56 (86.2) | 9 (13.8) | 59 (90.8) | 6 (9.2) | 55 (84.6) | 10 (15.4) | |||||
| Ischemic cardiopathy | 8 (4.2) | 6 (75) | 2 (25) | 6 (75) | 2 (25) | 7 (87.5) | 1 (12.5) | 8 (100) | 0 (0)b | 8 (100) | 0 (0)a | |||||
| Cardiac insufficiency | 3 (1.6) | 2 (66.7) | 1 (33.3) | 3 (100) | 0 (0) | 2 (66.7) | 1 (33.3) | 3 (100) | 0 (0) | 3 (100) | 0 (0) | |||||
| COPD | 1 (0.5) | 0 (0) | 1 (100) | 0 (0) | 1 (100) | 1 (100) | 0 (0) | 1 (100) | 0 (0) | 1 (100) | 0 (0) | |||||
| Chronic bronchitis | 2 (1.1) | 1 (50) | 1 (50) | 2 (100) | 0 (0) | 2 (100) | 0 (0) | 2 (100) | 0 (0) | 1 (50) | 1 (50) | |||||
| Asthma | 1 (0.5) | 1 (100) | 0 (0) | 1 (100) | 0 (0) | 0 (0) | 1 (100) | 1 (100) | 0 (0) | 1 (100) | 0 (0) | |||||
| Chronic kidney disease | 3 (1.6) | 2 (66.7) | 1 (33.3) | 3 (100) | 0 (0) | 3 (100) | 0 (0) | 3 (100) | 0 (0) | 3 (100) | 0 (0) | |||||
| Diabetes | 30 (15.9) | 26 (86.7) | 4 (13.3) | 27 (90) | 3 (10) | 26 (86.7) | 4 (13.3) | 26 (86.7) | 4 (13.3) | 23 (76.7) | 7 (23.3) | |||||
| Disease course, n (%) | ||||||||||||||||
| ARDS | 127 (67.2) | 105 (82.7) | 22 (17.3) | 107 (84.3) | 20 (15.7) | 108 (85) | 19 (15) | 113 (89) | 14 (11) | 106 (83.5) | 21 (16.5) | |||||
| Intensive care unit | 90 (47.6) | 76 (84.4) | 14 (15.6) | 77 (85.6) | 13 (14.4) | 74 (82.2) | 16 (17.8) | 79 (87.8) | 11 (12.2) | 77 (85.6) | 13 (14.4) | |||||
| CPAP-Helmet | 86 (45.5) | 74 (86) | 12 (14) | 74 (86) | 12 (14) | 70 (81.4) | 16 (18.6) | 77 (89.5) | 9 (10.5) | 73 (84.9) | 13 (15.1) | |||||
| High flow oxygen | 15 (7.9) | 11 (73.3) | 4 (26.7) | 10 (66.7) | 5 (33.3)a | 11 (73.3) | 4 (26.7) | 13 (86.7) | 2 (13.3) | 13 (86.7) | 2 (13.3) | |||||
| Mechanical ventilation | 11 (5.8) | 8 (72.7) | 3 (27.3) | 9 (81.8) | 2 (18.2) | 9 (81.8) | 2 (18.2) | 7 (63.6) | 4 (36.4)a | 11 (100) | 0 (0)a | |||||
| Treatment, n (%) | ||||||||||||||||
| Lopinavir/ritonavir | 8 (4.2) | 6 (75) | 2 (25) | 8 (100) | 0 (0)b | 8 (100) | 0 (0)b | 4 (50) | 4 (50)a | 7 (87.5) | 1 (12.5) | |||||
| Hydroxychloroquine | 8 (4.2) | 6 (75) | 2 (25) | 8 (100) | 0 (0)b | 8 (100) | 0 (0)b | 4 (50) | 4 (50)a | 7 (87.5) | 1 (12.5) | |||||
| Tocilizumab | 28 (14.8) | 21 (75) | 7 (25) | 24 (85.7) | 4 (14.3) | 22 (78.6) | 6 (21.4) | 23 (82.1) | 5 (17.9) | 25 (89.3) | 3 (10.7) | |||||
| Corticosteroids | 185 (97.9) | 156 (84.3) | 29 (15.7) | 157 (84.9) | 28 (15.1)b | 158 (85.4) | 27 (14.6) | 167 (90.3) | 18 (9.7)b | 149 (80.5) | 36 (19.5)a | |||||
| Quantitative variablesc | No | Yes | p | No | Yes | p | No | Yes | p | No | Yes | P | No | Yes | p | |
| Age (years), mean (SD)d(n=189) | 61 (11) | 61 (11) | 64 (11) | 0.140 | 60 (12) | 67 (9) | 0.004 | 60 (11) | 67 (9) | 0.003 | 61 (11) | 65 (9) | 0.182 | 63 (11) | 54 (11) | <0.001 |
| Analytical values | ||||||||||||||||
| Max CRP (mg/L) (n=189) | 116 (69-172) | 115 (69-169) | 123 (88-194) | 0.320 | 111 (69-163) | 158 (111-207) | 0.026 | 114 (70-167) | 146 (49-202) | 0.420 | 114 (68-167) | 138 (91-202) | 0.120 | 123 (69-184) | 109 (70-144) | 0.250 |
| Max ferritin (mcg/L) (n=188) | 923 (560-1435) | 884 (557-1321) | 1352 (654-1956) | 0.080 | 864 (515-1420) | 1100 (680-1482) | 0.130 | 923 (554-1471) | 951 (592-1371) | 0.910 | 865 (549-1412) | 1322 (850-2069) | 0.013 | 981 (564-1482) | 813 (552-1112) | 0.210 |
| Max IL-6 (ng/L) (n=168) | 57 (26-120) | 54 (25-114) | 64 (33-206) | 0.310 | 56 (26-109) | 66 (22-155) | 0.790 | 57 (27-116) | 57 (21-167) | 0.870 | 56 (26-116) | 70 (13-224) | 0.880 | 59 (28-138) | 45 (22-69) | 0.044 |
| Max D-dimer (ng/mL) (n=189) | 1380 (790-3525) | 1375 (787-2957) | 1380 (800-3960) | 0.600 | 1230 (740-2615) | 3525 (1315-4402) | 0.001 | 1355 (790-2867) | 2080 (800-4680) | 0.260 | 1355 (772-2827) | 1480 (890-5300) | 0.098 | 1570 (825-3985) | 920 (592-1892) | 0.008 |
| Minimum PaO2/FiO2 (%) (n=177) | 182 (111-324) | 194 (111-328) | 142 (112-265) | 0.220 | 182 (112-325) | 190 (108-276) | 0.720 | 182 (114-324) | 164 (101-316) | 0.460 | 191 (111-324) | 165 (113-226) | 0.390 | 168 (108-310) | 257 (179-354) | 0.003 |
| Maximum FiO2 (%) (n=189) | 60 (32-60) | 57 (32-60) | 60 (36-60) | 0.900 | 62 (32-60) | 55 (36-60) | 0.700 | 52 (32-60) | 60 (36-80) | 0.280 | 60 (32-60) | 60 (32-60) | 0.670 | 60 (32-62) | 40 (32-60) | 0.097 |
| Days of corticosteroids (n=189) | 50 (39-73) | 50 (39-73) | 54 (41-70) | 0.750 | 50 (39-70) | 55 (45-87) | 0.054 | 50 (39-70) | 62 (40-90) | 0.190 | 50 (39-72) | 54 (47-87) | 0.160 | 54 (41-77) | 42 (38-48) | <0.001 |
| Stay (days) | ||||||||||||||||
| ICU (n=90) | 6 (4-9) | 6 (4-9) | 4 (4-8) | 0.450 | 6 (4-9) | 5 (4-7) | 0.660 | 6 (4-9) | 7 (4-9) | 0.740 | 6 (4-9) | 8 (4-14) | 0.117 | 6 (4-9) | 4 (3-5) | 0.001 |
| Hospital stay (n=189) | 14 (9-19) | 14 (8-19) | 14 (12-20) | 0.280 | 13 (9-19) | 15 (10-20) | 0.430 | 3 (9-18) | 18 (10-22) | 0.047 | 13 (8-19) | 15 (14-21) | 0.019 | 14 (10-21) | 9 (7-13) | <0.001 |
BMI body mass index, COPD chronic obstructive pulmonary disease, ARDS acute respiratory distress syndrome, ICU intensive care unit, SD standard deviation, IQR interquartile range, CRP C reactive protein, IL-6 interleukin 6, PaO2 arterial partial pressure of oxygen, FiO2 inspiratory fraction of oxygen
aStatistically significant negative effect
bStatistically significant positive effect
cQuantitative variables expressed as median (IQR) and compared using the Mann-Whitney U test, unless otherwise noted
dStudent’s t-test for comparison of means
Multivariable analysis at six months
All variables showing a statistically significant association in the univariable study were included in the multivariable logistic regression and adjusted for sex and age. Age was the main risk factor for radiological abnormalities at six months, with significant associations observed for ground glass (adjusted OR [aOR] 1.080, p < 0.001), bronchial dilatation (aOR 1.100, p = 0.016), subpleural bands (aOR 1.050, p = 0.014), parenchymal bands (aOR 1.050, p = 0.016), and septal thickening (aOR 1.060, p = 0.012). In addition, a longer duration of corticosteroid therapy was associated with the presence of ground glass (aOR 1.020, p = 0.035), and a longer ICU stay and elevated IL-6 levels with bronchial dilatation (aOR 1.290, p = 0.038; aOR 1.002, p = 0.030). The full analysis is shown in Tables 3 and 4.
Table 3.
Multivariable analysis of risk factors associated with radiological abnormalities 6 months after admission for COVID-19 pneumonia
| Ground glass | Bronchial dilatation | Subpleural bands | Subpleural reticulation | |||||||||
|---|---|---|---|---|---|---|---|---|---|---|---|---|
| aOR | 95% CI | p | aOR | 95% CI | p | aOR | 95% CI | p | aOR | 95% CI | p | |
| Qualitative variables | ||||||||||||
| Medical history | ||||||||||||
| Male | 0.780 | 0.340-1.780 | 0.550 | 0.880 | 0.220-3.430 | 0.850 | 1.360 | 0.600-3.090 | 0.460 | 0.720 | 0.310-1.680 | 0.450 |
| Ischemic cardiopathy | — | — | — | — | — | — | 0.210 | 0.050-0.960 | 0.044 | 0.280 | 0.070-1.200 | 0.085 |
| Disease course | ||||||||||||
| ARDS | — | — | — | 1.320 | 0.200-8.570 | 0.920 | — | — | — | — | — | — |
| ICU | 0.350 | 0.100-1.220 | 0.099 | — | — | — | 0.000 | NA | 1.000 | — | — | — |
| CPAP-Helmet | — | — | — | — | — | — | 558099634 | NA | 1.000 | — | — | — |
| High flow oxygen | — | — | — | 0.590 | 0.090-4.100 | 0.600 | — | — | — | — | — | — |
| Mechanical ventilation | — | — | — | 4.420 | 0.230-85.460 | 0.330 | — | — | — | — | — | — |
| Treatment | ||||||||||||
| Lopinavir/ritonavir | — | — | — | 203.320 | 0.310-134759.690 | 0.110 | 1.57 × 10¹⁷ | NA | 1.000 | — | — | — |
| Hydroxychloroquine | — | — | — | 203.320 | 0.310-134759.690 | 0.110 | 1.57 × 10¹⁷ | NA | 1.000 | — | — | — |
| Corticosteroids | — | — | — | — | — | — | 0.440 | NA | 1.000 | 0.000 | NA | 0.999 |
| Quantitative variables | ||||||||||||
| Age | 1.080 | 1.040-1.120 | <0.001 | 1.100 | 1.020-1.190 | 0.016 | 1.054 | 1.011-1.100 | 0.014 | 1.024 | 0.990-1.058 | 0.170 |
| Analytical values | ||||||||||||
| Max CRP | — | — | — | 1.005 | 0.996-1.014 | 0.260 | — | — | — | — | — | — |
| Max IL-6 | 1.000 | 0.998-1.001 | 0.650 | 1.002 | 1.000-1.004 | 0.030 | — | — | — | — | — | — |
| Max D-dimer | — | — | — | 1.000 | 1.000-1.000 | 0.104 | 1.000 | 1.000-1.000 | 0.540 | — | — | — |
| Min PaO2/FiO2 | 1.001 | 0.996-1.006 | 0.700 | 1.010 | 0.980-1.040 | 0.520 | — | — | — | — | — | — |
| Max FiO2 | — | — | — | 1.041 | 0.981-1.104 | 0.180 | 0.997 | 0.970-1.020 | 0.790 | — | — | — |
| Days of corticosteroids | 1.017 | 1.001-1.032 | 0.035 | 1.010 | 0.997-1.023 | 0.140 | 1.000 | 0.990-1.010 | 0.790 | — | — | — |
| Length of stay | ||||||||||||
| ICU | — | — | — | 1.290 | 1.010-1.630 | 0.038 | — | — | — | — | — | — |
| Hospital | 0.970 | 0.920-1.030 | 0.340 | 0.970 | 0.850-1.100 | 0.583 | 1.030 | 0.960-1.090 | 0.470 | — | — | — |
Abbreviations: aOR adjusted odds ratio, ARDS acute respiratory distress syndrome, CI confidence interval, CRP reactive C protein, ICU intensive care unit, IL-6 interleukin 6, PaO2 arterial partial pressure of oxygen, FiO2 inspiratory fraction of oxygen, NA not available
Table 4.
Multivariable analysis of risk factors associated with radiological abnormalities 6 months after admission for COVID-19 pneumonia (continued)
| Atelectasis | Parenchymal bands | Septal thickening | Fibrotic tracts | Normal | |||||||||||
|---|---|---|---|---|---|---|---|---|---|---|---|---|---|---|---|
| Qualitative variables | aOR | 95% CI | p | aOR | 95% CI | p | aOR | 95% CI | p | aOR | 95% CI | p | aOR | 95% CI | p |
| Medical history | |||||||||||||||
| Male | 1.130 | 0.460-2.750 | 0.790 | 1.620 | 0.630-0.410 | 0.320 | 0.700 | 0.250-1.930 | 0.490 | 0.710 | 0.210-2.400 | 0.580 | 0.260 | 0.020-3.710 | 0.320 |
| Ischemic cardiopathy | — | — | — | — | — | — | — | — | — | 211053030 | NA | 1.000 | 273493447 | NA | 1.000 |
| Disease course | |||||||||||||||
| High flow oxygen | — | — | — | 0.379 | 0.100-1.410 | 0.150 | — | — | — | — | — | — | — | — | — |
| Mechanical ventilation | — | — | — | — | — | — | — | — | — | 0.500 | 0.080-3.270 | 0.470 | 22467504 | NA | 1.000 |
| Treatment | |||||||||||||||
| Lopinavir/ritonavir | — | — | — | 1.242×10⁹ | NA | 1.000 | 992643232 | NA | 1.000 | 1.010 | 0.050-21.510 | 1.000 | — | — | — |
| Hydroxychloroquine | — | — | — | 1.242×10⁹ | NA | 1.000 | 992643232 | NA | 1.000 | 1.010 | 0.050-21.510 | 1.000 | — | — | — |
| Corticosteroids | — | — | — | 2.600 | NA | 1.000 | — | — | — | 22.570 | 0.600-849.060 | 0.092 | 639.000 | NA | 1.000 |
| Quantitative variables | |||||||||||||||
| Age | 1.030 | 0.990-1.070 | 0.110 | 1.053 | 1.010-1.100 | 0.016 | 1.060 | 1.010-1.100 | 0.012 | 1.040 | 0.990-1.090 | 0.120 | 0.950 | 0.880-1.030 | 0.230 |
| Analytical values | |||||||||||||||
| Max CRP | — | 1.005 | 0.999-1.010 | 0.082 | — | — | — | — | — | — | — | — | — | ||
| Max ferritin | 1.000 | 1.000-1.010 | 0.087 | — | — | — | — | — | — | 1.000 | 1.000-1.000 | 0.200 | — | — | — |
| Max IL-6 | — | — | — | — | — | — | — | — | — | — | — | — | 1.000 | 0.998-1.002 | 0.750 |
| Max D-dimer | — | — | — | 1.000 | 1.000-1.000 | 0.880 | — | — | — | — | — | — | 1.000 | 0.999-1.000 | 0.520 |
| Min PaO2/FiO2 | — | — | — | — | — | — | — | — | — | — | — | — | 1.010 | 0.990-1.030 | 0.250 |
| Days of corticosteroids | — | — | — | — | — | — | — | — | — | — | — | — | 0.980 | 0.940-1.020 | 0.220 |
| Length of stay | |||||||||||||||
| ICU | — | — | — | — | — | — | — | — | — | — | — | — | 1.050 | 0.620-1.780 | 0.850 |
| Hospital | — | — | — | — | — | — | 1.050 | 1.000-1.120 | 0.069 | 1.020 | 0.950-1.090 | 0.630 | 0.790 | 0.600-1.040 | 0.097 |
Abbreviations: aOR adjusted odds ratio, ARDS acute respiratory distress syndrome, CI confidence interval, CRP reactive C protein, ICU intensive care unit, IL-6 interleukin 6, PaO2 arterial partial pressure of oxygen, FiO2 inspiratory fraction of oxygen, NA not available
Discussion
This cross-sectional study studied the radiological changes present 6 months after COVID-19 pneumonia and analyzed what factors might influence them. First, and in line with what has been described by other authors, we observed that during the first year after COVID-19 pneumonia, important radiological changes persist [4–9, 11, 12]. Most are potentially reversible, including ground glass and fibrotic-like abnormalities (e.g. bronchial dilatations, parenchymal bands, subpleural bands). Solomon et al. noted that over a third of patients with a history of severe SARS-CoV-2 pneumonia had fibrotic changes at six months [15]. Han et al. obtained very similar results, observing that 35% of the patients studied presented fibrotic changes at six months, but on this occasion patients who had not presented ARDS were also included [5]. They also observed, as did we, that the most frequent radiological manifestation at six months was ground glass (62%). Although it is a finding also observed by other authors and even described in up to 21% of patients 12 months after pneumonia, it is surprising that the most frequent radiological change 6 months after pneumonia is ground glass, a characteristic manifestation of the initial phase of the infection [16]. According to our results, systemic corticosteroid therapy and specifically its prolonged duration were associated with an increased presence of ground glass at 6 months. Therefore, we hypothesize that corticosteroid therapy, since it has been shown to decrease viral clearance, could contribute to the persistence of early phase changes such as ground glass [17, 18]. However, more data are needed in this regard.
There is much current debate about the natural history of these lung changes, reminiscent of pulmonary fibrosis, as this aspect is key when planning patient follow-up. In fact, some studies have shown a substantial improvement over time [8,9,19]. This could be due to the fact that included cases presented immature fibrosis that was amenable to remodeling over time [20, 21].
Although many studies describe the radiological evolution of patients with COVID-19 pneumonia, little is known about what factors influence it. In our sample, advanced age was clearly decisive in determining a worse radiological evolution, together with other factors such as a prolonged ICU stay, lengthy treatment with systemic corticosteroids, and a greater inflammatory response, as indicated by high maximum levels of IL-6. Both age and the severity of the respiratory infection were predictors of long-term fibrotic abnormalities in other studies [5, 15]. Furthermore, although no statistically significant association was observed in our multivariable analysis, elevated D-dimer levels have been proposed as a possible sign and prognostic indicator of fibrotic-type changes [3, 5]. Corsi et al. highlight the potential of D-dimer levels during admission to predict future deterioration in lung function [9]. On the other hand, as is well known, both the excessive inflammatory response and coagulopathy have been associated with greater severity and lung damage in patients with severe SARS-CoV-2 infections [22, 23]. This would explain the association we observed in the univariable analysis—but could not confirm in the logistic regression—between the different inflammatory parameters (CRP, ferritin, and IL-6) and the main radiological changes described.
We also assessed the effect of corticosteroid therapy in the acute phase on subsequent radiological evolution, observing no clear benefit. The protective effect shown in the univariable analysis for the presence of subpleural or parenchymal bands, subpleural reticulation, and fibrous tracts at six months was not confirmed in the multivariable regression. In this line, several authors have suggested that the recovery of the lung parenchyma could be accelerated by decreasing the cytokine storm [24–27]. However, this measure could also decrease viral clearance, which would influence the evolution [18]. In fact, the logistic regression did indeed show a directly proportional relationship between the presence of ground glass on HRCT at six months and the duration of systemic corticosteroid therapy. It is therefore urgent to know the real effect of corticosteroids, considering it is currently the main treatment for COVID-19 pneumonia, as well as the effects of other treatments used at the beginning of the pandemic that have not been shown to reduce mortality in the acute phase but could potentially improve radiological evolution, such as lopinavir/ritonavir and hydroxychloroquine.
This study, in addition to providing evidence on the radiological evolution after COVID-19 pneumonia, investigates the factors that influence it. We know little about this second aspect, which is why we consider it an interesting contribution of the present work. However, it has several limitations inherent to its retrospective nature and the fact that the HRCTs were performed by different radiologists, which may entail differences between observers. In addition, sample size was not calculated, and the small sample size could explain why the multivariable regression did not confirm the trends observed in the univariable analysis, such as the protective effect of corticosteroids or the association between radiological abnormalities at six months and elevated CRP, ferritin blood levels, and D-dimers as well as the different types of mechanical ventilation used. The spirometry data or the pulmonary function data was not available at the end of six month. Furthermore, we do not have HRCT scans during admission with which to compare the radiological evolution at six months or prior to admission, so it cannot be ruled out that some radiological change already existed prior to hospital admission and was not due to COVID-19 pneumonia. Finally, long-term radiological involvement is probably overestimated, since in our hospital follow-up was carried out only in selected patients based on medical criteria and the severity of the pneumonia.
Conclusions
According to our results, pulmonary radiological involvement six months after SARS-CoV-2 pneumonia is frequent, and ground glass is the most common finding followed by bronchial dilations. Advanced age is the main risk factor for a poor radiological outcome, associated with the appearance of ground glass, bronchial dilatations, subpleural bands, parenchymal bands and septal thickening. Other significant factors were prolonged systemic corticosteroid therapy (ground glass), longer ICU stay and elevated IL-6 levels (bronchial dilatation both). However, more data are needed on the longer-term evolution of the radiological abnormalities described, as well as the role of corticosteroids (the main treatment for COVID-19 pneumonia at present), the different types of mechanical ventilation used, or other analytical markers such as PCR, ferritin, and D-dimer.
Supplementary Information
Supplementary Material 1. Supplementary material- Association, expressed as odds ratioand 95% confidence interval, between radiological changes 6 months after hospital admission and its possible risk factors.
Acknowledgements
We are grateful to the professionals in the Internal Medicine Service, Radiology and the Infectious Diseases Unit at the University General Hospital of Castellon for their invaluable cooperation during the performance of the study, without which it would not have been possible. We also express our thanks to Meggan Harris for her assistance in editing.
Abbreviations
- HRCT
High-resolution computed tomography
- ARDS
Acute respiratory distress syndrome
- aOR
Adjusted odds ratio; intensive care unit (ICU)
- SARS
Severe acute respiratory syndrome
- MERS
Middle East respiratory syndrome
- RT-PCR
Real-time polymerase chain reaction
- CRP
C-reactive protein
- SD
Standard deviation
- IQR
Interquartile range
- ORs
Odds ratios
- Cis
Confidence intervals
- NIMV
Non-invasive mechanical ventilation
- IMV
Invasive mechanical ventilation
- BMI
Body mass index
- COPD
Chronic obstructive pulmonary disease
- IL-6
Interleukin 6
- PaO2
Arterial partial pressure of oxygen
- FiO2
Inspiratory fraction of oxygen
Authors’ contributions
(I) Conception and design: CRM, IPC, JMRR, JUB, MLMC. (II) Administrative support: CRM, IPC, JMRR, JUB, MLMC. (III) Provision of study materials or patients: CRM, IPC, MVV, SFE, ANB, MPFG, ASF, GHR, EDB, SFJ, MJEG, JUB. (IV) Collection and assembly of data: CRM, IPC, MVV, SFE, ANB, MPFG, ASF, GHR, EDB, SFJ, MJEG. (V) Data analysis and interpretation: CRM, IPC, JMRR, JUB, MLMC. (VI) Manuscript writing: All authors (VII) Final approval of manuscript: All authors
Funding
No funding.
Availability of data and materials
All data generated or analysed during this study are included in this published article (and its supplementary information files).
Declarations
Ethics approval and consent to participate
The study was approved by the ethics committee called “Medicine Research Ethics Committee of Castellón General University Hospital”, according to the guidelines of the Spanish Agency for Medicines and Health Products. Medicine Research Ethics Committee of Castellón General University Hospital accepted the waiver of informed consent as the study did not alter the routine management of the patients. Patients’ confidentiality and data were protected according to Regulation (EU) 2016/679 of the European Parliament and of the Council of April 27, 2016 on the protection of natural persons with regard to the processing of personal data and the free circulation of such data.
Consent for publication
Consent for publication.
Competing interests
The authors declare no competing interests.
Footnotes
Publisher’s Note
Springer Nature remains neutral with regard to jurisdictional claims in published maps and institutional affiliations.
Celia Roig-Martí and Ignacio Pérez-Catalán contributed equally as first authors.
Jorge Usó-Blasco and José-Manuel Ramos-Rincón contributed equally as last authors.
Contributor Information
Celia Roig-Martí, Email: celia.roig.marti@gmail.com.
Ignacio Pérez-Catalán, Email: nachocs13@gmail.com.
References
- 1.WHO COVID-19 Dashboard. Geneva: World Health Organization. 2020. Available online: https://covid19.who.int/. Accessed on 13 Mar 2023.
- 2.Yan X, Huang H, Wang C, Jin Z, Zhang Z, He J, et al. Follow-up study of pulmonary function among COVID-19 survivors 1 year after recovery. J Infect. 2021;83(3):381–412. 10.1016/j.jinf.2021.05.034. 10.1016/j.jinf.2021.05.034 [DOI] [PMC free article] [PubMed] [Google Scholar]
- 3.Wu X, Liu X, Zhou Y, Yu H, Li R, Zhan Q, et al. 3-month, 6-month, 9-month, and 12-month respiratory outcomes in patients following COVID-19-related hospitalisation: a prospective study. Lancet Respir Med. 2021;9(7):747–54. 10.1016/S2213-2600(21)00174-0. 10.1016/S2213-2600(21)00174-0 [DOI] [PMC free article] [PubMed] [Google Scholar]
- 4.Liu M, Lv F, Huang Y, Xiao K. Follow-Up Study of the Chest CT Characteristics of COVID-19 Survivors Seven Months After Recovery. Front Med (Lausanne). 2021;1(8): 636298. 10.3389/fmed.2021.636298. 10.3389/fmed.2021.636298 [DOI] [PMC free article] [PubMed] [Google Scholar]
- 5.Han X, Fan Y, Alwalid O, Li N, Jia X, Yuan M, et al. Six-month Follow-up Chest CT Findings after Severe COVID-19 Pneumonia. Radiology. 2021;299(1):E177–86. 10.1148/radiol.2021203153. 10.1148/radiol.2021203153 [DOI] [PMC free article] [PubMed] [Google Scholar]
- 6.Parry AH, Wani AH, Shah NN, Jehangir M. Medium-term chest computed tomography (CT) follow-up of COVID-19 pneumonia patients after recovery to assess the rate of resolution and determine the potential predictors of persistent lung changes. Egypt J Radiol Nucl Med. 2021;52(1):55. 10.1186/s43055-021-00434-z. 10.1186/s43055-021-00434-z [DOI] [Google Scholar]
- 7.Balbi M, Conti C, Imeri G, Caroli A, Surace A, Corsi A, et al. Post-discharge chest CT findings and pulmonary function tests in severe COVID-19 patients. Eur J Radiol. 2021;138: 109676. 10.1016/j.ejrad.2021. 10.1016/j.ejrad.2021 [DOI] [PMC free article] [PubMed] [Google Scholar]
- 8.Besutti G, Monelli F, Schirò S, Milone F, Ottone M, Spaggiari L, et al. Follow-Up CT Patterns of Residual Lung Abnormalities in Severe COVID-19 Pneumonia Survivors: A Multicenter Retrospective Study. Tomography. 2022;8(3):1184–95. 10.3390/tomography8030097. 10.3390/tomography8030097 [DOI] [PMC free article] [PubMed] [Google Scholar]
- 9.Corsi A, Caroli A, Bonaffini PA, Conti C, Arrigoni A, Mercanzin E, et al. Structural and Functional Pulmonary Assessment in Severe COVID-19 Survivors at 12 Months after Discharge. Tomography. 2022;8(5):2588–603. 10.3390/tomography8050216. 10.3390/tomography8050216 [DOI] [PMC free article] [PubMed] [Google Scholar]
- 10.Spagnolo P, Balestro E, Aliberti S, Cocconcelli E, Biondini D, Cassa GD, et al. Pulmonary fibrosis secondary to COVID-19: a call to arms? Lancet Respir Med. 2020;8(8):750–2. 10.1016/S2213-2600(20)30222-8. 10.1016/S2213-2600(20)30222-8 [DOI] [PMC free article] [PubMed] [Google Scholar]
- 11.Hwang DM, Chamberlain DW, Poutanen SM, Low DE, Asa SL, Butany J. Pulmonary pathology of severe acute respiratory syndrome in Toronto. Mod Pathol. 200518(1):1–10. 10.1038/modpathol. 10.1038/modpathol [DOI] [PMC free article] [PubMed] [Google Scholar]
- 12.Das KM, Lee EY, Singh R, Enani MA, Dossari KA, Gorkom KV, et al. Follow-up chest radiographic findings in patients with MERS-CoV after recovery. Indian J Radiol Imaging. 2017;27(3):342–9. 10.4103/ijri.IJRI_469_16. 10.4103/ijri.IJRI_469_16 [DOI] [PMC free article] [PubMed] [Google Scholar]
- 13.Meduri GU, Headley S, Kohler G, Stentz F, Tolley E, Umberger R, et al. Persistent elevation of inflammatory cytokines predicts a poor outcome in ARDS. Plasma IL-1 beta and IL-6 levels are consistent and efficient predictors of outcome over time. Chest. 1995;107(4):1062–73. 10.1378/chest.107.4.1062. 10.1378/chest.107.4.1062 [DOI] [PubMed] [Google Scholar]
- 14.Desai SR, Wells AU, Rubens MB, Evans TW, Hansell DM. Acute respiratory distress syndrome: CT abnormalities at long-term follow-up. Radiology. 1999;210(1):29–35. 10.1148/radiology.210.1.r99ja2629. 10.1148/radiology.210.1.r99ja2629 [DOI] [PubMed] [Google Scholar]
- 15.Solomon JJ, Heyman B, Ko JP, Condos R, Lynch DA. CT of Post-Acute Lung Complications of COVID-19. Radiology. 2021;301(2):E383–95. 10.1148/radiol.2021211396. 10.1148/radiol.2021211396 [DOI] [PMC free article] [PubMed] [Google Scholar]
- 16.Watanabe A, So M, Iwagami M, Fukunaga K, Takagi H, Kabata H, et al. One-year follow-up CT findings in COVID-19 patients: A systematic review and meta-analysis. Respirology. 2022;27(8):605–16. 10.1111/resp.14311. Epub 2022 Jun 12. 10.1111/resp.14311 [DOI] [PMC free article] [PubMed] [Google Scholar]
- 17.Tang X, Feng YM, Ni JX, Zhang JY, Liu LM, Hu K, et al. Early Use of Corticosteroid May Prolong SARS-CoV-2 Shedding in Non-Intensive Care Unit Patients with COVID-19 Pneumonia: A Multicenter, Single-Blind. Randomized Control Trial Respiration. 2021;100(2):116–26. 10.1159/000512063. Epub 2021 Jan 22. 10.1159/000512063 [DOI] [PMC free article] [PubMed] [Google Scholar]
- 18.Huang R, Zhu C, Jian W, Xue L, Li C, Yan X, et al. Corticosteroid therapy is associated with the delay of SARS-CoV-2 clearance in COVID-19 patients. Eur J Pharmacol. 2020;15(889):173556. 10.1016/j.ejphar.2020.173556. 10.1016/j.ejphar.2020.173556 [DOI] [PMC free article] [PubMed] [Google Scholar]
- 19.Manolescu D, Timar B, Bratosin F, Rosca O, Citu C, Oancea C. Predictors for COVID-19 Complete Remission with HRCT Pattern Evolution: A Monocentric, Prospective Study. Diagnostics (Basel). 2022;12(6):1397. 10.3390/diagnostics12061397. 10.3390/diagnostics12061397 [DOI] [PMC free article] [PubMed] [Google Scholar]
- 20.Vaz de Paula CB, Nagashima S, Liberalesso V, Collete M, Gomes da Silva FP, Gomes Oricil AG, et al. COVID-19: Immunohistochemical Analysis of TGF-β Signaling Pathways in Pulmonary Fibrosis. Int J Mol Sci. 2021;23(1):168. 10.3390/ijms23010168. 10.3390/ijms23010168 [DOI] [PMC free article] [PubMed] [Google Scholar]
- 21.Rai DK, Sharma P, Kumar R. Post covid 19 pulmonary fibrosis. Is it real threat? Indian J Tuberc. 2021;68(3):330–3. 10.1016/j.ijtb.2020.11.003. 10.1016/j.ijtb.2020.11.003 [DOI] [PMC free article] [PubMed] [Google Scholar]
- 22.George PM, Wells AU, Jenkins RG. Pulmonary fibrosis and COVID-19: the potential role for antifibrotic therapy. Lancet Respir Med. 2020;8(8):807–15. 10.1016/S2213-2600(20)30225-3. 10.1016/S2213-2600(20)30225-3 [DOI] [PMC free article] [PubMed] [Google Scholar]
- 23.Helms J, Tacquard C, Severac F, Leonard-Lorant I, Ohana M, Delabranche X, et al. CRICS TRIGGERSEP Group (Clinical Research in Intensive Care and Sepsis Trial Group for Global Evaluation and Research in Sepsis). High risk of thrombosis in patients with severe SARS-CoV-2 infection: a multicenter prospective cohort study. Intensive Care Med. 2020;46(6):1089–98. 10.1007/s00134-020-06062-x. 10.1007/s00134-020-06062-x [DOI] [PMC free article] [PubMed] [Google Scholar]
- 24.He JW, Su Y, Qiu ZS, Wu JJ, Chen J, Luo Z, et al. Steroids Therapy in Patients With Severe COVID-19: Association With Decreasing of Pneumonia Fibrotic Tissue Volume. Front Med (Lausanne). 2022;14(9): 907727. 10.3389/fmed.2022.907727. 10.3389/fmed.2022.907727 [DOI] [PMC free article] [PubMed] [Google Scholar]
- 25.Lee KH, Yoon S, Jeong GH, Kim JY, Han YJ, Hong SH, et al. Efficacy of Corticosteroids in Patients with SARS, MERS and COVID-19: A Systematic Review and Meta-Analysis. J Clin Med. 2020;9(8):2392. 10.3390/jcm9082392. 10.3390/jcm9082392 [DOI] [PMC free article] [PubMed] [Google Scholar]
- 26.van Paassen J, Vos JS, Hoekstra EM, Neumann KMI, Boot PC, Arbous SM. Corticosteroid use in COVID-19 patients: a systematic review and meta-analysis on clinical outcomes. Crit Care. 2020;24(1):696. 10.1186/s13054-020-03400-9. 10.1186/s13054-020-03400-9 [DOI] [PMC free article] [PubMed] [Google Scholar]
- 27.Vadász I, Husain-Syed F, Dorfmüller P, Roller FC, Tello K, Hecker M, et al. Severe organising pneumonia following COVID-19. Thorax. 2021;76(2):201–4. 10.1136/thoraxjnl-2020-216088. 10.1136/thoraxjnl-2020-216088 [DOI] [PubMed] [Google Scholar]
Associated Data
This section collects any data citations, data availability statements, or supplementary materials included in this article.
Supplementary Materials
Supplementary Material 1. Supplementary material- Association, expressed as odds ratioand 95% confidence interval, between radiological changes 6 months after hospital admission and its possible risk factors.
Data Availability Statement
All data generated or analysed during this study are included in this published article (and its supplementary information files).