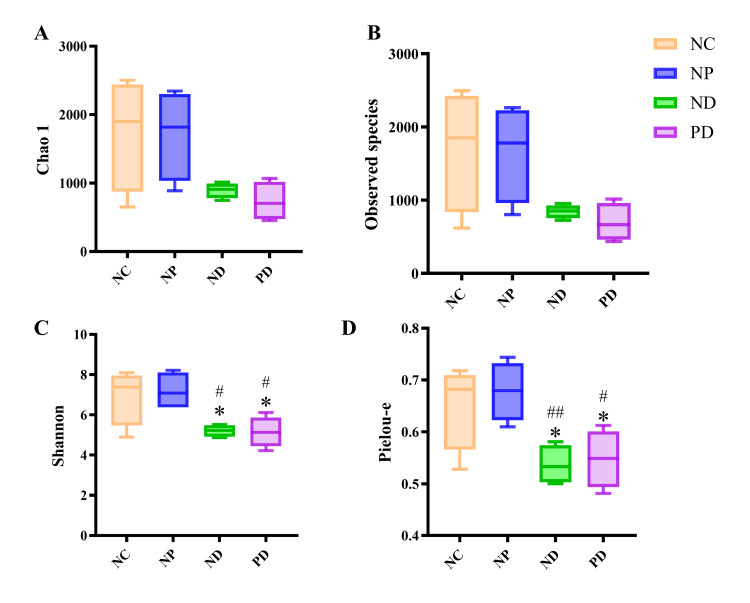
Figure 6. Analysis of gut microbiota α-diversity in mice with T2DM and experimental periodontitis.
A.The Chao1 index represents species richness, where a higher index indicates a greater number of species within the community. B. The Observed species index represents species richness, with a higher index reflecting a greater number of species within the community. C. The Shannon index represents species diversity, where a higher index indicates greater diversity. D. The Pielou-e index represents species evenness, with a higher value indicating greater evenness.* p<0.05 (compared to the NC group). # p<0.05, ## p<0.01 (compared to the NP group).

