

Abstract
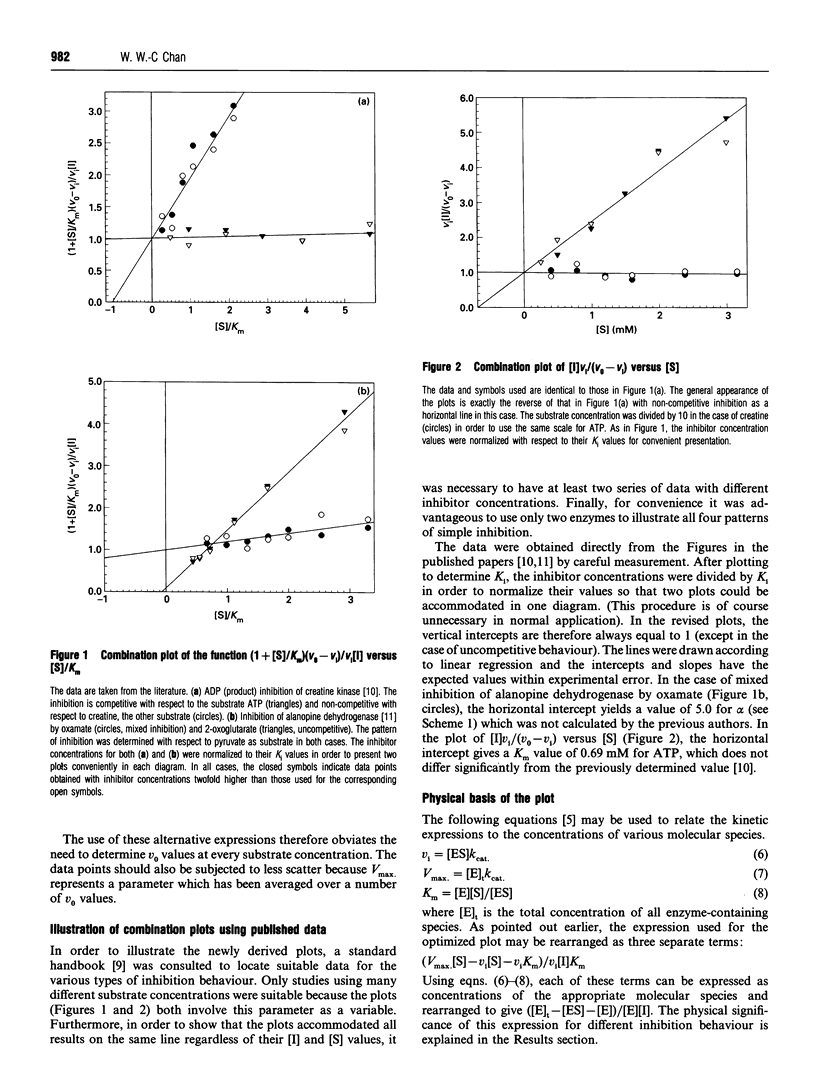
Although statistical regression has become the method of choice in the analysis of enzyme kinetics, graphical methods continue to be useful on account of their illustrative capabilities. It is pointed out in this paper that enzyme inhibition data may be presented more efficiently as a single linear plot than the traditional way as a family of lines. This approach has been taken previously by Hunter and Downs [Hunter and Downs (1945) J. Biol. Chem. 157, 427-446] but has remained neglected. A new version of this type of plot (combination plot) has been devised which is linear for competitive, non-competitive, uncompetitive and linear mixed inhibition and has a characteristic appearance for each type of inhibition behaviour. The slopes and intercepts not only indicate directly the dissociation constant but also provide quantitative criteria for the nature of inhibition. This plot should serve as a useful graphical tool in enzyme research as well as in biochemical education.
Full text
PDF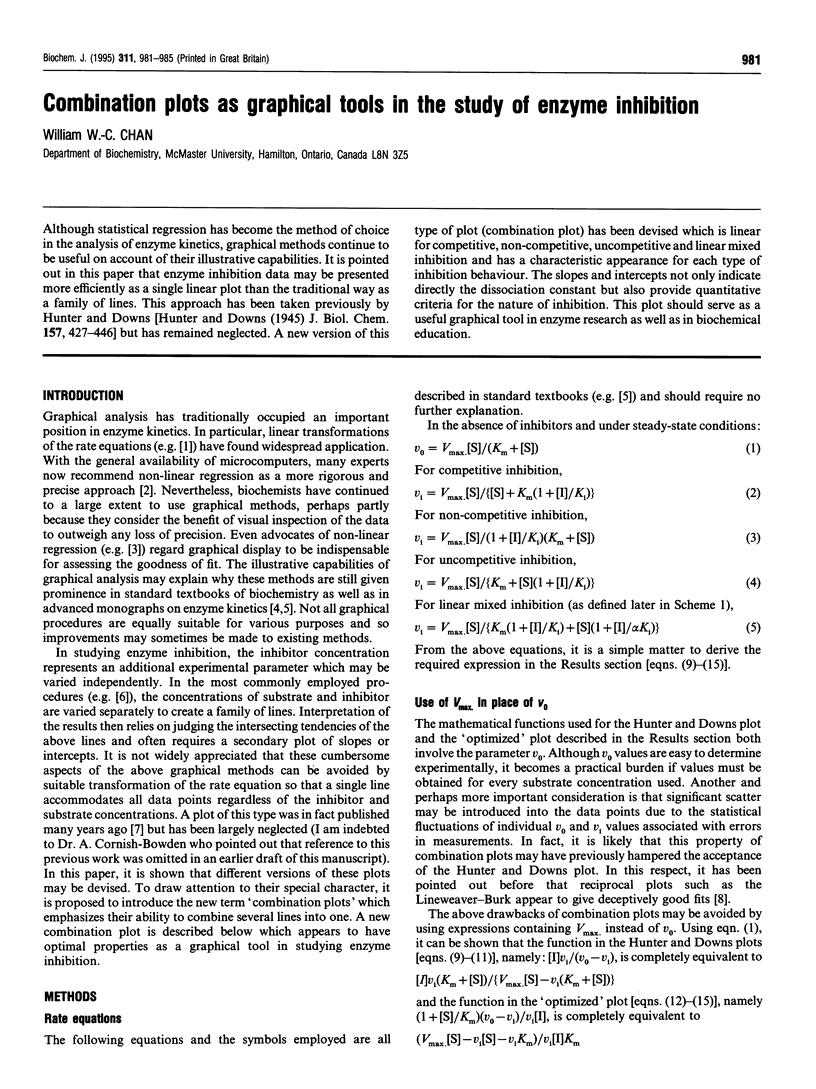
Selected References
These references are in PubMed. This may not be the complete list of references from this article.
- Cleland W. W. Statistical analysis of enzyme kinetic data. Methods Enzymol. 1979;63:103–138. doi: 10.1016/0076-6879(79)63008-2. [DOI] [PubMed] [Google Scholar]
- Cornish-Bowden A. A simple graphical method for determining the inhibition constants of mixed, uncompetitive and non-competitive inhibitors. Biochem J. 1974 Jan;137(1):143–144. doi: 10.1042/bj1370143. [DOI] [PMC free article] [PubMed] [Google Scholar]
- DIXON M. The determination of enzyme inhibitor constants. Biochem J. 1953 Aug;55(1):170–171. doi: 10.1042/bj0550170. [DOI] [PMC free article] [PubMed] [Google Scholar]
- DOWD J. E., RIGGS D. S. A COMPARISON OF ESTIMATES OF MICHAELIS-MENTEN KINETIC CONSTANTS FROM VARIOUS LINEAR TRANSFORMATIONS. J Biol Chem. 1965 Feb;240:863–869. [PubMed] [Google Scholar]
- Fields J. H., Hochachka P. W. Purification and properties of alanopine dehydrogenase from the adductor muscle of the oyster, Crassostrea gigas (Mollusca, Bivalvia). Eur J Biochem. 1981 Mar;114(3):615–621. doi: 10.1111/j.1432-1033.1981.tb05188.x. [DOI] [PubMed] [Google Scholar]
- Hanes C. S. Studies on plant amylases: The effect of starch concentration upon the velocity of hydrolysis by the amylase of germinated barley. Biochem J. 1932;26(5):1406–1421. doi: 10.1042/bj0261406. [DOI] [PMC free article] [PubMed] [Google Scholar]
- KUBY S. A., NODA L., LARDY H. A. Adenosinetriphosphate-creatine transphosphorylase. III. Kinetic studies. J Biol Chem. 1954 Sep;210(1):65–82. [PubMed] [Google Scholar]
- Motulsky H. J., Ransnas L. A. Fitting curves to data using nonlinear regression: a practical and nonmathematical review. FASEB J. 1987 Nov;1(5):365–374. [PubMed] [Google Scholar]