

Abstract
Rare genetic diseases are typically studied in referral populations, resulting in underdiagnosis and biased assessment of penetrance and phenotype. To address this, we develop a generalizable method of genotype inference based on distant relatedness and deploy this to identify undiagnosed Type 5 Long QT Syndrome (LQT5) rare variant carriers in a non-referral population. We identify 9 LQT5 families referred to a single specialty clinic, each carrying p.Asp76Asn, the most common LQT5 variant. We uncover recent common ancestry and a single shared haplotype among probands. Application to a non-referral population of 69,819 BioVU biobank subjects identifies 22 additional subjects sharing this haplotype, which we confirm to carry p.Asp76Asn. Referral and non-referral carriers have prolonged QT interval corrected for heart rate (QTc) compared to controls, and, among carriers, the QTc polygenic score is independently associated with QTc prolongation. Thus, our innovative analysis of shared chromosomal segments identifies undiagnosed cases of genetic disease and refines the understanding of LQT5 penetrance and phenotype.
Subject terms: Medical genetics, Cardiovascular genetics, Genome informatics, Arrhythmias, Personalized medicine
Analysis of shared chromosomal segments is applied to identify distantly related, previously undiagnosed carriers of a rare KCNE1 variant. The carriers are shown to have the Long QT Syndrome phenotype with incomplete penetrance.
Introduction
Most data on the impact of rare variants in Mendelian disease genes have been gathered in referral or registry populations. This approach overestimates true population impact, which is better assessed in large non-referral population cohorts, such as biobanks1,2. Since most biobanks recruit participants regionally, there is often significant undocumented (or cryptic) relatedness among participants. This oversampling of related individuals provides an abundance of genomic segments that are shared without recombination due to common ancestry. These identical-by-descent (IBD) segments provide an opportunity to study ungenotyped or poorly genotyped rare variants harbored within them. Because rare variants within IBD segments are shared if present in the common ancestor, IBD segments can identify likely carriers of rare variants3, inform relationships and reconstruct pedigrees4–7, and map causal variants, including in biobanks where relatedness is often cryptic8,9.
Here, we innovatively leverage IBD segments in a large biobank to investigate a rare variant in KCNE1 that is causal for Long QT syndrome (LQTS), a well-recognized, rare cause of syncope and sudden cardiac death (SCD) with an estimated prevalence of 1:200010. KCNE1 mutations cause Type 5 Long QT Syndrome (LQT5)11, a subtype accounting for 1–2% of autosomal dominant congenital LQTS cases. KCNE1 encodes a function-modifying subunit for the voltage-gated slow delayed rectifier potassium current IKs12, and possibly other potassium currents13–15. Functional studies of the missense mutation, c.226 G > A (rs74315445), resulting in p.Asp76Asn, have shown a dominant negative effect to reduce IKs11. However, recent registry and referral center-based studies argue that KCNE1 variants have low penetrance (10–30%) and are not truly disease-causing, but rather function-modifying, and predispose to drug-induced forms of LQTS16–18.
An international consortium of 26 centers identified 89 probands with possible LQT5, 140 additional carrier relatives, and 19 cases of Jervell-Lange-Nielsen Syndrome attributed to homozygous or compound heterozygous KCNE1 loss of function variants19. The commonest mutation was p.Asp76Asn, with 35 probands and 63 carrier relatives. Of the 35 p.Asp76Asn probands identified from the 26 centers, nine probands (26%), as well as 3 carrier relatives, were identified at Vanderbilt University Medical Center (VUMC), representing a marked enrichment relative to other sites. We hypothesize that these local probands are distantly related, and that this interrelatedness provides an opportunity to identify additional carriers in a regional biobank and to establish the impact of p.Asp76Asn.
To identify likely carriers in BioVU, we develop an approach, DRIVE (Distant Relatedness for Identification and Variant Evaluation) that leverages IBD to generate unbiased estimates of the role of p.Asp76Asn. First, we estimate the genome-wide relatedness among the 12 clinical p.Asp76Asn carriers and reconstructed pedigrees. We then identify the shared haplotypes spanning KCNE1. We use DRIVE to identify BioVU subjects who share IBD segments containing KCNE1 with clinic carriers and confirm p.Asp76Asn carrier status via sequencing. Finally, we assess electrocardiograms (ECGs) and medical records for features of LQTS. This enlarged carrier group in a hospital-based population improves power to revisit the debate about the role of KCNE1 in LQTS, as well as to identify the interaction between p.Asp76Asn carriage and a QTc polygenic risk score (PRS) in modifying p.Asp76Asn penetrance. Our findings highlight the utility of IBD analysis in large biobanks to identify undetected carriers of rare pathogenic variants. This enables analyses of interacting effects, expansion of clinical phenotypes, and estimation of variant penetrance in a non-referral clinical population.
Results
Overview of distant relatedness for identification and variant evaluation (DRIVE)
DRIVE was developed to link individuals into connected graphs based on pairwise IBD sharing spanning the target variant or region (Fig. 1). DRIVE is implemented in python3.6, and publicly available on https://github.com/belowlab/drive. To find the people who share identical IBD segments, DRIVE first identifies all pairwise IBD segments greater than a user-specified length (e.g., 3 cM) spanning the target position (Fig. 1A), and then conducts a network clustering approach using segment length as the probability weight to identify IBD clusters (Fig. 1B). By default, DRIVE uses a random walk for clustering. Random walk is an efficient approach for determining highly connected clusters within large and sparse networks, such as those derived from IBD sharing among biobank participants20. Networks of close relatives would be expected to be highly connected, while spurious networks or networks connecting very short segments (due to more distant relatedness) may be more sparsely connected. Therefore, for large and sparse clusters, an additional trimming step is conducted to split clusters into smaller but more highly connected sub-clusters, with up to five iterations of this process under the default settings (Fig. 1C).
Fig. 1. The DRIVE tool for local IBD clustering.

This tool identifies groups of people who share an IBD segment spanning a specific genomic region (in this study, the gene KCNE1). A DRIVE first selects the pairwise IBD segments spanning the target gene/variant among clinic samples and biobank subjects. B DRIVE uses a random walk approach to cluster subjects who share the same haplotype. C DRIVE repeats the clustering steps for large and sparse clusters. D The inverse of the IBD segment lengths is used to represent genetic distance in a phylogenetic dendrogram. Sequence data can be integrated with the dendrogram to infer where in the family history of the genomic region the mutation event occurred (red star).
Distant relatedness in a local cluster of p.Asp76Asn probands
Nine p.Asp76Asn probands were referred to the Genetic Arrhythmia Clinic for LQTS evaluation and treatment. Cascade screening identified three additional p.Asp76Asn carriers among the probands’ first-degree relatives, resulting in 12 clinic subjects confirmed to carry p.Asp76Asn (Table 1). None of the probands were known to be related. All probands had experienced syncope, 5 had a QTc >480 ms absent QT-prolonging drugs or electrolyte abnormalities, 5 had an implanted cardioverter-defibrillator (ICD), and 3 had documented Torsades de Pointes (TdP), the polymorphic ventricular tachycardia seen in LQTS. Among the 3 carrier family members, 1 had a QTc >480 ms, 1 had a primary prevention ICD, none had a history of syncope, and none had experienced TdP.
Table 1.
Demographic and clinical features of p.Asp76Asn carriers
| All carriers (n = 34) | Clinic (n = 12) | BioVU (n = 22) | P-value | |
|---|---|---|---|---|
| Demographics | ||||
| Age at first ECG (year) | 44.2 ± 19.7 | 42.5 ± 20.1 | 45.7 ± 19.9 | 0.69 |
| Female, n (%) | 21 (62%) | 11 (91.7%) | 10 (45.5%) | 0.011 |
| Phenotype | ||||
| QTc on first ECG (msec) | 447 ± 32.9† | 463 ± 36.1 | 432 ± 21.7† | 0.019 |
| Max QTc (msec) | 463 ± 36.7† | 475 ± 33.6 | 453 ± 37.4† | 0.13 |
| QTc >480 msec, n (%) | 10 (40%)† | 6 (50%) | 4 (31%)† | 0.43 |
| Syncope, n (%) | 15 (44%) | 9 (75%) | 6 (27.2%) | 0.012 |
| Torsade or CA, n (%) | 4 (12%) | 3 (25%) | 1 (4.55%) | 0.12 |
| 1° relative with SCD or Torsade arrest | 5 (15%) | 5 (41.7%) | 0 (0%) | 0.0028 |
| Treatment | ||||
| Beta blockade, n (%) | 12 (35.3%) | 9 (75%) | 3 (13.6%) | 1.7 × 10⁻⁴ |
| ICD, n (%) | 6 (17.6%) | 6 (50%) | 0 (0%) | 6.9 × 10⁻⁴ |
Data are presented as mean ± standard deviation or n (%). P-values compare clinic carriers to BioVU carriers, using the two-sided Fisher’s exact test for categorical variables and the two-sided Mann Whitney U test for continuous variables. For age at first ECG, if no ECG was available, the current age was used. CA Cardiac arrest, SCD Sudden cardiac death, ICD Implantable cardioverter-defibrillator. †Excluding the 9 BioVU carriers without an ECG.
We estimated pairwise relatedness by the global proportion of IBD sharing and the distribution of shared IBD segments, using PRIMUS and ERSA software as described, enabling genetic reconstruction of the three clinically ascertained pedigree structures. Using PADRE, we identified previously unknown eighth to ninth degree relatedness among these pedigrees and three of the probands without close relatives (Fig. 2). For reference, fourth cousins are ninth degree relatives. This relatedness supports the hypothesis that a local progenitor event underlies the comparatively high p.Asp76Asn frequency in Tennessee.
Fig. 2. p.Asp76Asn probands are distantly related.
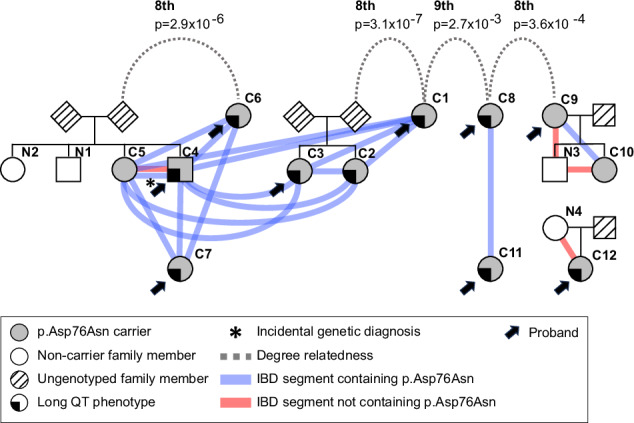
Analysis of genome-wide IBD sharing in the clinic p.Asp76Asn carriers was used to reconstruct all known pedigrees of first-degree relatives as well as to identify previously unknown relatedness among these pedigrees and three of the probands without close relatives. It is possible that more distant relatedness exists between the families that is beyond the limit of detection of existing tools (~9th degree) that utilize only pair-wise genetic data to estimate relatedness43. The colored lines indicate shared IBD segments (≥3 cM) spanning KCNE1, both those harboring p.Asp76Asn (blue) and not (red). The long QT phenotype was defined simply as having QTc >480 msec in the absence of QT-prolonging drugs or electrolyte derangements or a documented history of Torsades de Pointes. IBD Identical by descent.
Applying DRIVE to KCNE1 in BioVU
To find potential KCNE1 p.Asp76Asn BioVU carriers, we analyzed the 12 clinic carriers in conjunction with the BioVU European Ancestries-like (EA) genotyped population (Fig. 3). In this merged dataset, we used DRIVE to identify all pairwise IBD segments greater than 3 cM in length spanning KCNE1, and detected 582,671 long IBD segments ( > 3 cM) spanning KCNE1. Then, using DRIVE with a three-step random walk approach and an iterated trimming step for large (n > 30) and sparse (proportion of connected edges <0.5) clusters, we identified 12,356 IBD clusters at the KCNE1 locus with at least three members, including two clusters containing at least two confirmed carriers from the clinic samples. The first cluster (cluster A) included 7 clinic carriers and 14 BioVU subjects, and the second cluster (cluster B) included another 2 clinic carriers and 9 BioVU subjects. In cluster A, 82.9% of pairs shared IBD segments >3 cM (Fig. 4A) spanning KCNE1, with an average segment length of 12.3 cM. In cluster B, 88.9% of pairs shared IBD segments spanning KCNE1, with an average length of 6.0 cM (Fig. 4B). To explore more distant relatedness, we analyzed short IBD segments (>1 cM) shared across the clusters. In total, we identified 165 short IBD segments between members of cluster A and B (Fig. 4C), with an average length 1.41 cM. We then generated phylogenetic dendrograms using the inverse of shared IBD length to represent the local familial distance for each pair, which suggested the two clusters are distantly related, and motivated the joint analysis of variant age (Fig. 4D). Whole exome-sequencing confirmed p.Asp76Asn heterozygosity in 22 of the 23 BioVU subjects in the clusters. Our expanded dataset included 34 mutation carriers, 12 from clinic and 22 from BioVU. No other BioVU subjects were found to share the IBD segment ( > 3 cM) harboring the p.Asp76Asn variant. We applied a recombination clock approach, GEVA21, to estimate the age of p.Asp76Asn. Using two BioVU carriers from each cluster and unrelated Europeans from 1000 Genomes22, GEVA estimated that the mutation occurred 46 generations ago (upper 95% confidence bound assuming exponential haplotype decay, 140 generations)23.
Fig. 3. Study design.
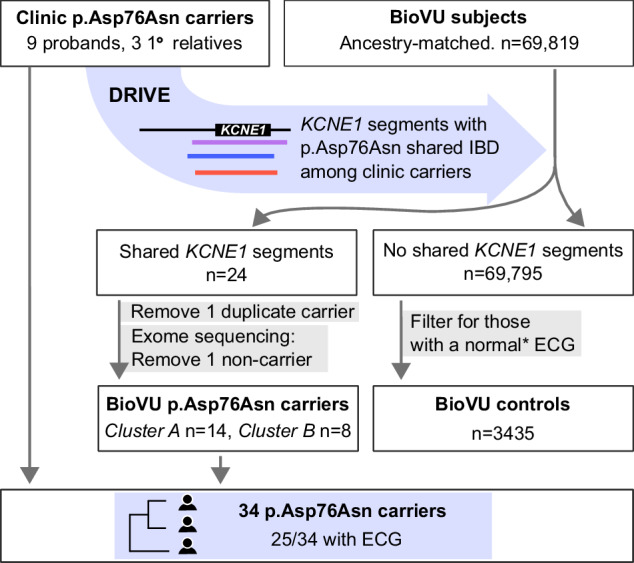
Clinic p.Asp76Asn carriers comprise nine probands seen at the VUMC Genetic Arrhythmia Clinic and three related carriers identified through cascade screening. IBD-based genotype inference using the DRIVE tool was deployed in VUMC BioVU, which links the deidentified electronic health record to genomic data, to identify individuals who shared chromosomal segments at KCNE1 with the clinic carriers. Exome sequencing confirmed p.Asp76Asn carrier status in 22/23 biobank individuals identified via IBD, resulting in total of 34 p.Asp76Asn carriers at a single center. BioVU subjects without shared KCNE1 segments who also had at least one ECG that met inclusion criteria detailed in Methods (*) were used as the control group. IBD Identical by descent, DRIVE Distant relatedness for Identification and Variant Evaluation, ECG Electrocardiogram.
Fig. 4. IBD clustering revealed distantly related subjects in the biobank.

Local IBD sharing at KCNE1 was analyzed between the 12 clinic carriers and the 69,819 subjects in BioVU of European Ancestries-like. This identified two clusters containing known carriers, with an additional 23 subjects sharing the same chromosomal segment at KCNE1. Of the 23 BioVU subjects, exome sequencing confirmed p.Asp76Asn in 22. In the connection plots for cluster A (A) and cluster B (B), individuals are represented by the segments along the periphery. Shared chromosomal segments at KCNE1 between individuals are indicated by the red and gray connectors. C Illustration of the length and position of the shared segments spanning KCNE1 among members of cluster A (red), members of cluster B (purple), and in members of both cluster A and B (blue). D The dendrograms for cluster A and cluster B represent generational distance between subjects based on the inverse of the length of the IBD segments underlying KCNE1 (labeled). All clinic subjects (C prefix) had p.Asp76Asn carriership determined by clinical-grade commercial testing. BioVU subjects (BV prefix) had p.Asp76Asn carriership confirmed by whole exome sequencing (WES), and the BioVU subject in gray was found not to carry p.Asp76Asn on WES. The red star indicates the possible mutation event on the shared haplotype. The annotated branch length in the dendrograms for cluster A and cluster B represents the local familial distance between subjects, estimated as the inverse of the length of the IBD segments underlying KCNE1 (numeric label on each node). IBD = identical by descent.
Cardiac events in p.Asp76Asn carriers
We summarized the clinical characteristics of the 34 carriers in Table 1. EHR review identified four with documented TdP arrhythmia, the precursor to cardiac arrest in LQTS patients. Three were subsequently seen in the Genetic Arrhythmia clinic and are members of the clinic cohort. Of these three, one suffered an unprovoked cardiac arrest and was successfully resuscitated. The second suffered an in-hospital TdP arrest following albuterol administration. The third had self-limited TdP observed on telemetry, without cardiac arrest. TdP was documented in one BioVU carrier, attributed to use of sotalol, a QT-prolonging drug. Five clinic carriers had a documented first-degree relative with SCD or Torsades arrest. In 15/34 carriers, EHR review identified syncope, which is non-specific but indicates high risk in patients with LQTS24,25. Compared to the clinic carriers, a smaller proportion of BioVU carriers were female, and fewer BioVU carriers had a history of syncope, had a first-degree relative with SCD or Torsades arrest, were on beta blockade, or had an ICD. BioVU carriers had a shorter presenting QTc compared to clinic carriers (432 msec vs. 463 msec, respectively, p-value = 0.019). No BioVU carriers had a prior diagnosis of LQTS.
The QTc is prolonged in p.Asp76Asn carriers
Among the 25 p.Asp76Asn carriers with an ECG, representing both clinic and BioVU subjects, 40% of female carriers (8/20) had a QTc >480 msec, compared to 1.5% of female controls. In male carriers, 40% (2/5) had a QTc >480 msec, compared to 0.7% of male controls. The QTc, adjusted for sex, was longer in carriers (465 ± 36 msec) compared to population controls (429 ± 23 msec, p-value = 3.3 × 10⁻⁵) (Fig. 5). To assess the effect of p.Asp76 Asn in a non-referral population, we then restricted the analysis to the subset of carriers from BioVU. In this BioVU-only group, the QTc remained longer than that of population controls (456 ± 38 msec vs. 429 ± 23 msec, p-value = 0.023). In the BioVU-only group, 31% of carriers with an ECG (4/13) had a QTc >480 ms.
Fig. 5. The QTc in p.Asp76Asn carriers compared to population controls.
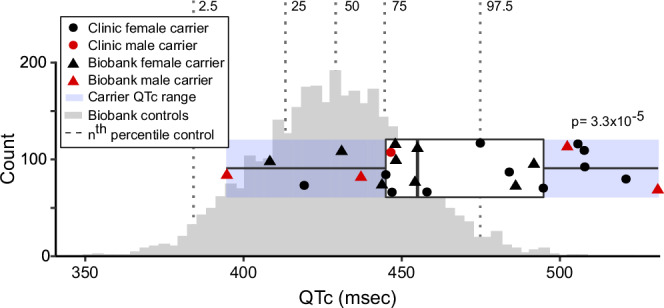
ECGs meeting criteria detailed in Methods were available for all clinic carriers, and for 13 of 22 biobank (BioVU) carriers. The ancestry-matched BioVU controls with genotype and ECG data (n = 3435) were selected as detailed in Methods. For both carriers and controls, if multiple ECGs were available for a subject, the maximum QTc meeting inclusion criteria was used. Male QTcs were adjusted to female sex by adding 11.3 msec (derived from the difference between males and females in the control group when adjusted for age and PRS). The QTc was prolonged in carriers (465 ± 6.2 msec, n = 25) compared to controls (429 ± 23.3 msec, n = 3435; p-value = 3.3 × 10⁻⁵). The horizontal boxplot shows the three quartiles (25%, 50%, and 75%) of the carriers. P-values indicate the result of the two-sided Welch unequal variances t-test between carriers and controls, with p-value < 0.05 considered significant. Source data are provided as a Source Data file.
Polygenic risk in p.Asp76Asn carriers
We assessed whether the QTc interval PRS contributed to QTc variability in p.Asp76Asn carriers and in controls (Fig. 6A). A multivariable linear regression analysis for the QTc as a function of p.Asp76Asn carrier status, PRS, age, and sex was performed (Table S3). These variables were all statistically significant in this model, which showed p.Asp76Asn carriers have an average 35.3 msec longer QTc compared to controls (p-value = 3.4949 × 10⁻¹⁴). This supports the conclusion that p.Asp76Asn carriers have longer QTc intervals than controls, even when polygenic risk for QT prolongation is considered. We additionally tested the interaction between PRS and p.Asp76Asn on QTc (Table S3), and did not observe a significant effect beyond additivity (p-value = 0.194).
Fig. 6. Polygenic risk for QT prolongation and p.Asp76Asn carrier status contribute independently to QT prolongation.

A The PRS for the QTc was calculated for each carrier (clinic n = 12, BioVU n = 13) and for the BioVU controls (n = 3435). A multivariable linear regression analysis for the QTc as a function of p.Asp76Asn carrier status, PRS, age, and sex (Table S3) predicted that p.Asp76Asn carriers have an average 35.3 msec longer QTc compared to controls (p-value = 3.49 × 10⁻¹⁴ by ANOVA, adjusted for multiple comparisons). The predicted QTc as a function of PRS is shown for carriers (blue line) and non-carriers (gray line). B Carriers with a prolonged QTc (n = 10) have a higher PRS than carriers with a normal QTc (n = 15). The maximum QTc meeting inclusion criteria was used, and was adjusted for age and sex. The boxplots show the three quartiles (25%, 50%, 75%). The upper whisker extends to the largest value no greater than 1.5 * interquartile range from the upper boundary, and the lower whisker extends to the smallest value no less than 1.5 * interquartile range from the lower boundary. The p-values indicates the result of the two-sided Mann Whitney U test comparing carriers with maximum QTc < 480, and ≥ 480 msec. P-value < 0.05 was considered significant. ECG Electrocardiogram, PRS Polygenic risk score. Source data are provided as a Source Data file.
We then assessed the relationship between the QTc PRS and QTc among p.Asp76Asn carriers. QTc intervals were adjusted for age and sex in this analysis; QTc is adjusted to female sex and age 47 (mean age of the clinic subjects), based on the regression model derived from the control population (Table S3). The QTc PRS was different between p.Asp76Asn carriers with a prolonged ( ≥ 480 msec) QTc versus those without (QTc<480 msec), with a median PRS of 0.45 (interquartile range (IQR) 0.37–0.55) compared to 0.30 (IQR 0.099–0.37), respectively (p-value = 0.036, Fig. 6B). We found a trend towards higher PRS in individuals with a history of Torsades (p-value = 0.073), and in clinic carriers compared to BioVU carriers (p-value = 0.053) (Supplementary Fig. 2A, B). The diagnosis of syncope was not associated with PRS (Supplementary Fig. 2C).
Discussion
Here we leverage patterns of sharing within the genome to make three key findings. First, we characterize both known and unknown relatedness within clinic patients identified as p.Asp76Asn carriers after a cardiac event (in them or a close relative) prompted referral to the Genetic Arrhythmia Clinic. The observed relatedness among carriers indicates that many carriers are descended from a common ancestor, suggesting a local progenitor event explains the excess of carriers of the rare p.Asp76Asn variant. Second, we present an approach in a large biobank that enabled discovery of additional p.Asp76Asn carriers who may be at risk of developing or have a missed diagnosis of LQT5. Third, we leverage these additional carriers from a non-referral population to evaluate the penetrance of LQT5 in p.Asp76Asn carriers and assess the role of QTc genetic risk factors in combination with p.Asp76Asn.
Both common and rare variants contribute to genetic risk in cardiovascular disease. Although the monogenic or Mendelian diseases are individually rare, in aggregate they impact 7–8% of the United States population26. Since these diseases may cause high morbidity and mortality rates, early diagnosis, especially when impactful interventions are available, is especially important. Genomic sharing due to relatedness provides a powerful but underutilized approach to detect ungenotyped or poorly genotyped variation and estimate its effect. For example, Belbin et al.9 used IBD to identify multiple shared chromosomal segments associated with short stature in Puerto Ricans in an ethnically-diverse biobank, and follow-up analyses demonstrated that homozygous carriage of a rare variant in the collagen gene COL27A1 was responsible. Although patterns of genomic sharing have been used in disease gene discovery before, the approach is not often implemented and is limited by the lack of effective tools for biobank-scale analysis.
Recently, many IBD detection tools have been published that efficiently detect pairwise IBD sharing in large-scale biobanks, such as hap-IBD27, iLASH28, and RaPiD29. To our knowledge, the only existing IBD clustering tool with available software is DASH30, but this tool has different functionality than DRIVE. Specifically, DASH analyzes chromosome-wide data and does not have a function for specifying a target region, is not designed for biobank scale data, and is no longer maintained30. To address the challenge of locus-based clustering at biobank scale, we developed an approach, DRIVE, to identify potential carriers of shared rare variants. Here we deploy DRIVE to identify additional carriers of a previously described pathogenic variant in a large biobank; however, DRIVE can also be used to identify individuals likely to carry ungenotyped disease-associated variation. Specifically, an alternate application of DRIVE is to cluster individuals with shared IBD segments in a target region (e.g. a candidate gene) and assess the enrichment of disease within clusters via a binomial test. This approach can pinpoint a set of individuals likely to carry a pathogenic variant in the region for further study and can identify previously unknown causal variants.
Assessments of variant pathogenicity commonly use allele frequency in large public datasets as a criterion; however, the lack of associated phenotypic data limits the informativeness of these analyses31. In the Genome Aggregation Database v4.032, the frequency of KCNE1 p.Asp76Asn is very rare with a minor allele frequency of 0.0001562 in Europeans, and 0.0001220 overall. Thus, as with other rare variants, determination of pathogenicity and penetrance of p.Asp76Asn requires additional evaluation such as functional data and association with disease-related human phenotypes. In functional studies, p.Asp76Asn exerts profound dominant negative effects on IKs11. Here, to assess the impact of the variant on human disease phenotypes, we utilize patterns of sharing due to distant relatedness in DRIVE to rapidly pinpoint 22 p.Asp76Asn carriers in an EHR-linked biobank of nearly 70,000 individuals. Prior estimates of the effects of p.Asp76Asn on risk of LQTS utilized patients and their relatives ascertained exclusively in cardiac clinic settings16,17. Our identification of carriers in the non-referral, BioVU population allowed us to estimate the effects of p.Asp76Asn on the QT interval in a less selected manner. Study of the non-referral population enabled the assessment of p.Asp76Asn in male subjects, who comprised 55% of the non-referral group but only 8% of the clinic group, and increased the sample size of carriers in this study by a factor of nearly 3 (Table 1). Comparison of the non-referral carriers to the clinic carriers demonstrated a shorter QTc on presenting ECG, lower rates of documented syncope, and no documented family history of SCD (Table 1). Consistent with this observation of a milder phenotype in non-referral carriers, all non-referral carriers lacked a prior diagnosis of LQTS. However, the maximum QTc observed in non-referral subjects was not significantly less than that of clinic subjects, and one non-referral subject suffered a Torsades arrhythmia episode (Table 1). Our human phenotypic data add further strength to the conclusion of the International Consortium that KCNE1 variants can be monogenic causes of long QT syndrome, but penetrance is incomplete19. Furthermore, our results indicate that phenotype severity and expected penetrance vary between referral and non-referral populations.
Furthermore, we explored factors that modify penetrance of p.Asp76Asn. Polygenic variation has been shown to modulate penetrance in tier 1 monogenetic conditions33 as well as a rare, monogenic SCN5A arrhythmia syndrome34. Similarly, we find an independent (log-additive) relationship between p.Asp76Asn and QT variation across the genome, as measured by a QT PRS, that suggests risk of QT prolongation is not epistatically affected by p.Asp76Asn and the rest of the genome.
Although the Illumina MEGAex array contains this pathogenic variant (KCNE1 p.Asp76Asn), the standard QC process excludes the variant due to the well-known genotyping technology limitations for low allele frequency variants. For example, Weedon et al. reported 40%–70% positive predictive value (PPV) for MAF computed from the array calls (cMAF) ranging between 0.001% and 0.01%. This PPV dropped to 16% for cMAF below 0.001%. The gnomAD v4.0 reported allele frequency of p.Asp76Asn in Europeans is 1.562 × 10⁻⁴ 35 Array-based genotyping of p.Asp76Asn identifies 30 p.Asp76Asn carriers among BioVU Europeans, of which DRIVE successfully identifies 23 (76.7%). This performance was similar to TOPMed imputation which imputed dosage between 0.9 ~ 1.1 for 23 individuals and resulted in 5 false negatives (imputed dosage > 1.9).
DRIVE can be applied to pinpoint potential carriers of any identified variant shared among related biobank participants regardless of rarity, imputation quality, and/or presence on the genotyping platform or imputation panel. DRIVE rapidly detects potential carriers of candidate variants using only extant genotyping data and without the need for biospecimen access or experimental cost. This study serves as a proof-of-principle, illustrating the feasibility of the DRIVE approach to identify variants that may be poorly genotyped, poorly imputed, or absent from the array or imputation reference (a common situation in under-represented populations). This work introduces a paradigm for studying the effects of ungenotyped or poorly genotyped variation among cryptic relatives and demonstrates the power of rare variant detection and evaluation in non-referral populations to improve estimates of variant effects.
In summary, our method enables identification of rare variant carriers in non-referral populations. Panel or whole genome sequencing in affected probands enables comprehensive identification of carriers of pathogenic or likely pathogenic variants in Mendelian disease genes; however, failure to detect undiagnosed carriers of rare, pathogenic variants results in missed opportunities for preventative care, and undertreatment of disease. Furthermore, failure to detect carriers in general populations with dense associated phenotypic information limits the study of rare, inherited diseases due to low sample sizes and ascertainment bias, which prevents accurate estimates of pathogenicity, penetrance, and relevant modifying effects. Most publicly available biobank data is array-based or exome-sequenced, rendering much of the functional variation unassessed. Thus, discovering subjects with shared chromosomal segments at a Mendelian disease locus known to harbor a disease-causing mutation in at least one individual holds the promise of identifying other carriers, even when their sequencing data is not available.
Limitations
Although this study represents the largest analysis to date of the role of p.Asp76Asn in general populations, there are limitations to using the EHR to evaluate its effects. While none of the BioVU p.Asp76Asn carriers have a LQT5 diagnosis in their record, a diagnosis may have been made outside Vanderbilt. Similarly, no BioVU carriers had documentation of a first-degree family member with SCD; this could be due to insufficient family history documentation in the EHR, in contrast to the clinic carriers seen in a Genetic Arrhythmia clinic, where obtaining family history is a priority. Further, our estimation of the effects of QTc polygenic risk in carriers was limited to those with an ECG, which reduced our power and may introduce ascertainment bias. Finally, confounding by population haplotypes, genotyping error, and genotype data density limits the ability to accurately estimate the degree of relatedness using very short segments, and as a result our ability to estimate segments smaller than 3 cM, or relationships more distant than 8th or 9th degree.
In conclusion, we introduce an approach to leveraging distant relatedness to identify rare variant carriers and use this approach to identify p.Asp76Asn carriers who are undiagnosed for or at risk of developing LQT5. We use the set of non-referral carriers to improve estimation of p.Asp76Asn penetrance, detect polygenic effects modifying pathogenesis, and estimate mutation age. This demonstrates that analysis of shared chromosomal segments in large numbers of subjects with dense phenotypic data enables the discovery of mutation carriers and evaluation of disease loci.
Methods
All subjects provided written informed consent, and participating studies obtained ethical approval from the Vanderbilt University Medical Center Institutional Review Board under protocols 9047 and 182258. Subjects did not receive compensation. Subject sex was determined by self-report and genotype. Subject sex was included as a variable in all multivariable analyses.
Clinic subjects
Nine probands and three family members from the Genetic Arrhythmia Clinic at VUMC were clinically genotyped and found to be heterozygous carriers of the KCNE1 p.Asp76Asn variant. One proband was identified incidentally in the eMERGE III (Electronic Medical Records and Genomics Phase III) sequencing study36, and was subsequently referred to the Genetic Arrhythmia Clinic. All clinic carriers were of European descent.
Biobank subjects
BioVU is the VUMC biorepository linking deidentified electronic health records (EHRs) to over 300,000 DNA samples derived from specimens about to be discarded after clinical testing37. The EHR at VUMC contributes specimen-linked de-identified demographic data, clinical notes, electronic orders, laboratory measurements (including ECG data), Current Procedures Terminology (CPT) codes, and International Classification of Diseases (ICD-9 and ICD-10) codes. Currently in BioVU, 95,124 individuals have been genotyped on the Illumina Expanded Multi-Ethnic Genomic Array (MEGAEX), and 54,347 of these have had at least one ECG recorded.
MEGAEX genotyping and quality control
Variants with > 2% missingness and individuals with >3% missingness were excluded from further analysis. All BioVU subjects were projected against principal components from all populations in 1000 Genomes22 to determine genetic ancestries using PLINK v.1.90b6.338,39. Within population groups, additional quality control was conducted using the following thresholds for inclusion: minor allele frequency (MAF) > 0.01, variant missingness < 0.05, sample missingness < 0.1, heterozygosity F < 0.2, Hardy-Weinberg equilibrium p-value < 1 × 10⁻¹⁰, removal of duplicate samples, and a requirement for genetic sex to match clinical records. After the quality assessments, 5925 subjects were filtered out, and 69,819 subjects were kept in the European superpopulation (EA), 15,603 in the African superpopulation (AFR), 897 in the East Asian superpopulation (EAS), 414 in the South Asian superpopulation (SAS), and 2466 in the Admixed Americans superpopulation, as previously described40. Therefore, 69,819 EA individuals with 718,367 variants were kept in further analysis. Although KCNE1 p.Asp76Asn was genotyped by the MEGAEX array, it was excluded from downstream analysis as it did not pass MAF threshold (rs74315445 MAF = 0.000156 in Europeans32) in quality control (QC).
The 12 clinic subjects were genotyped on the MEGAEX array to generate haplotype data using the same array and following the same protocols as those in BioVU. Because all 12 were of European ancestry and bias can be introduced in small and highly related samples, we carried forward the set of QC-passed genetic variants in the BioVU EA dataset rather than conducting variant-based QC separately in the clinical subjects. For individual-level QC, all clinic samples’ genetic sex matched the recorded sex, heterozygosity levels were below 0.2, and all had a call rate >0.989. All 12 clinical subjects passed individual-level QC and were used for further analysis.
Phasing and IBD detection
Phasing, the process of determining haplotypes (the sequence of alleles on a single chromosome) from genetic data, is a critical step for accurately identifying IBD segments. SHAPEIT441 was used to establish phase in genotype data from both BioVU EA subjects and clinic samples, separately. The BioVU EA dataset is sufficiently large to conduct phasing without an external reference panel. For the 12 clinic samples, the phased BioVU EA genetic data were used as the reference panel during phasing. The BioVU EA subjects and clinic samples were merged after phasing using BCFtools v1.942. We leveraged hap-IBD v1.027, a seed-and-extension approach, to detect IBD segments efficiently on biobank-scale data. We required a minimum shared segment length of 100 contiguous genetic markers and a minimum length of 2 centimorgan (cM) as initial seeds in hap-IBD and carried IBD segments longer than 3 cM forward in analysis to minimize analysis of erroneous segments. In addition, we extended our analyses with shorter IBD segments to find more distant relatedness, and we used hap-IBD for detecting IBD segments with a length longer than 1 cM.
Pedigree reconstruction and distant relatedness estimation
Genome-wide IBD proportions were calculated using the method-of-moments estimation function in PLINK38 after removing ancestry-informative SNPs in PRIMUS v1.9.06. Non-directional networks of first- and second-degree related individuals were reconstructed into pedigrees using PRIMUS. In addition the length and distribution of IBD segments genome-wide were used to identify more distant relatives (up to ninth degree) by ERSA 2.143, and then passed into PADRE 1.04 to generate pedigree-aware estimates of distant relatedness. Relatedness estimation and pedigree reconstruction were conducted in BioVU EA and clinic subjects separately.
Local IBD clustering
The purpose of local IBD clustering is to identify sets of people who share an identical IBD segment spanning a specific genomic region (gene) or position (genetic variant). Since current IBD detection tools only report pairwise IBD sharing, we developed the tool DRIVE. DRIVE is implemented in python 3.6 (https://github.com/belowlab/drive). DRIVE identifies all pairwise IBD segments spanning the target variant/gene and then conducts a three-step random walk approach, using segment length as the probability weight. Networks of close relatives would be expected to be highly connected, however spurious networks or networks connecting very short segments (due to distant relatedness) may be more sparsely connected. Therefore, for large (n > 30) and sparse (proportion of connected edges < 0.5) clusters, an additional random walk is conducted to split the clusters into smaller but more highly connected sub-clusters, with a maximum of five iterations of this process. Finally, using FastME 2.044, the inverse of shared IBD segment length is used to generate phylogenetic dendrograms for the clusters of interest.
Whole exome-sequencing validation
The presence of KCNE1 p.Asp76Asn in each BioVU subject identified as sharing a p.Asp76Asn haplotype was assessed by exome sequencing on an Illumina NextSeq 500 with 150 bp paired-end reads following a standard Illumina protocol by the sequencing core at VANTAGE (Vanderbilt Technologies for Advanced Genomics). Sequencing quality control was conducted by fastp 0.20.1 to filter out short and low-quality reads, following established approaches45. Reads that passed QC were aligned to the hg38 human genome reference by BWA-MEM2 2.2.146, and the exome-wide variants were called by GATK 4.2.6.1 following standard best practices47.
Mutation age estimation
Including the BioVU p.Asp76Asn carriers identified by DRIVE, the clusters showed evidence of sharing a small haplotype at KCNE1. Because this suggests co-inheritance from a common ancestor, we randomly selected two from each cluster and estimated the age of the mutation event using the recombination clock model within the Genealogical Estimation of Variant Age (GEVA) tool, v1 beta21. The length of shared segments spanning the target variant were used to estimate the time to the most recent common ancestor with the European ancestry 1000 Genomes data as reference22. GEVA then estimates the age of the mutation event by comparing the estimated time to the most recent common ancestor among the pair of subjects that carry the target variant relative to pairs in which only one subject carries the target variant and the other one does not.
Genome imputation and polygenic risk score calculation
Genome-wide genotype imputation was performed on p.Asp76Asn carriers, along with 3000 BioVU subjects for the process of QC, phasing, and imputation on the Michigan Imputation Server48. The imputation controls were randomly selected from the subset of BioVU EA subjects with MEGA genotypes that passed QC, as described above. The subset of SNPs passing quality control that overlapped between p.Asp76Asn carriers and the imputation controls were used in imputation on the Michigan Imputation Server using the European ancestry Haplotype Reference Consortium version r1.1 2016 reference haplotypes49. SNPs with low imputation quality (R2 < 0.3) were filtered before further analysis.
We then used the PRS for QTc developed by Nauffal et al.50 This PRS comprises 1,110,494 SNPs, and there were 1,110,297 overlapping SNPs between the PRS and our imputed genomes. Using the score function in PLINK 2.039, we calculated the PRS from the imputed genetic data of each carrier and control subject.
Electronic health records review
ECGs obtained during routine clinical care were available for all clinic carriers, and for 13/22 biobank carriers. The QT interval corrected for heart rate (QTc) was calculated using the Bazett formula. For clinic and BioVU p.Asp76Asn carriers, QTc measurements were only used if the ECG was sinus rhythm or atrially paced, had a QRS duration <110 msec and a heart rate 50–100 bpm, and was not obtained while the subject was hospitalized or prescribed QT-prolonging drugs (Supplementary Table 1).
Arrhythmia diagnoses in each carrier’s deidentified EHR were determined using ICD-9 and ICD-10 codes (Supplementary Table 2). Additionally, a text-search of each carrier’s EHR was performed for the terms cardiac arrest, long QT, LQT, PMVT, polymorphic ventricular tachycardia, SCD, seizure, sudden cardiac death, syncope, Torsade(s), TdP, ventricular fibrillation, V fib, and VF; any matches were reviewed by a physician to confirm the diagnosis.
ECG controls were defined as the BioVU subjects who (1) clustered with 1000 Genomes subjects from the European superpopulation (European Ancestries-like, EA) in genetic principal components analysis and passed genomic QC (described above) (n = 69,819) and (2) had an ECG that met the following criteria: read as normal, in sinus rhythm, with QRS duration 65–110 msec and heart rate 50–100 bpm, obtained in an outpatient setting with no inpatient visits immediately before or after, with no QT-prolonging drugs prescribed at the time of the ECG (see Supplementary Table 1 for list of drugs51), from a subject with no prior heart disease ICD-9 or ICD-10 codes and potassium within the VUMC lab normal limits. Controls were restricted to the EA subset because all clinic carriers self-described as White and clustered with 1000 Genomes subjects from the European super-population, as above. One BioVU p.Asp76Asn carrier overlapped with this set and was removed from the control group. This resulted in an ECG control group of 3435 genotyped individuals (2218 females,1217 males) with an ECG meeting our criteria.
Statistical analysis
Statistical tests were performed using R version 4.2.152 Regression modeling used the rms package in R, v6.8-153. For continuous variables, parametric testing was used if each group had > 10 members and satisfied the Shapiro-Wilk test; otherwise, non-parametric testing was used. All parametric tests were two-tailed. P-value < 0.05 was considered statistically significant. For categorical variables, the Fisher’s exact test was used due to small sample sizes.
Reporting summary
Further information on research design is available in the Nature Portfolio Reporting Summary linked to this article.
Supplementary information
Source data
Acknowledgements
Vanderbilt University Medical Center’s BioVU (BIOVU) projects are supported by numerous sources: institutional funding, private agencies, and federal grants. These include NIH funded Shared Instrumentation Grant S10OD017985, S10RR025141, and S10OD025092; CTSA grants UL1TR002243, UL1TR000445, and UL1RR024975. Genomic data are also supported by investigator-led projects that include U01HG004798, R01NS032830, RC2GM092618, P50GM115305, U01HG006378, U19HL065962, and R01HD074711. Electrocardiographic data at Vanderbilt University Medical Center were obtained using Vanderbilt’s Synthetic Derivative. The Synthetic Derivative resource is supported by Clinical and Translational Science Awards award No. UL1TR000445 from the National Center for Advancing Translational Sciences. The contents of this publication are solely the responsibility of the authors and do not necessarily represent official views of the National Center for Advancing Translational Sciences or the National Institutes of Health. This project was supported by National Institutes of Health R01GM133169 (Dr. Below, Dr. Chen, Dr. Huff, Mr. Baker), R01HL159557 (Dr. Below), P50GM115305 (Dr. Roden), U01HG011181 (Dr. Roden), T32HG008962 (Dr. Lancaster), T32GM007569 (Dr. Lancaster), and T32GM145734 (Mr. Baker). This project was supported by the American Heart Association 18PRE34060101 (Dr. Chen) and 23CDA1042141 (Dr. Fleming).
Author contributions
H.-H.C., J.T.B., G.E., D.C.S., C.D.H., and J.E.B. developed methods. H.G.P. participated in genetic data quality control and imputation. M.C.L., H.-H.C., T.L.S., M.R.F., M.B.S, and D.M.R. participated in dataset acquisition. M.C.L., H.-H.C., D.M.R., and J.E.B. analyzed the data. M.C.L., H.-H.C., D.M.R., and J.E.B. wrote the manuscript. All authors reviewed and approved the final manuscript.
Peer review
Peer review information
Nature Communications thanks the anonymous reviewers for their contribution to the peer review of this work. A peer review file is available.
Data availability
Select phenotypic and genotypic source data are provided with this paper. The summary phenotypic and genotypic data generated in this study have been deposited in the National Institutes of Health dbGaP database [https://www.ncbi.nlm.nih.gov/gap/] under accession number phs003685.v1. These data are available under controlled access given the risk of subject re-identification in this small cohort from a specific geographic region with a rare, potentially stigmatizing genetic variant. Access can be obtained following submission of an online Data Access Request via the dbGaP Authorized Access page [https://dbgap.ncbi.nlm.nih.gov/aa/wga.cgi?page=login] and approval of the request by dbGaP. The array genotypes and EHR-derived clinical data on the BioVU subjects were generated independently of this study for the BioVU biobank at VUMC. De-identified, raw genotypic and EHR-derived clinical data from BioVU are only available upon submission of a study proposal and approval through the BioVU Review Committee. Access to BioVU vetting includes institutional IRB non-human subjects research determination, data use agreements between the BioVU program and the researcher(s), and both administrative and scientific reviews for approval. Proposals are reviewed by several committees and timelines vary based on the acuity of the request and deliverables involved. A VUMC or Vanderbilt Principal Investigator is required for academic collaborations. Industry and commercial requests are managed by Nashville Biosciences, a wholly owned subsidiary of VUMC. Contact biovu@vumc.org for access requests or questions. Additional details for researchers are available on the BioVU publicly facing website [https://victr.vumc.org/biovu-description/]. The de-identified, raw genetic data from the clinic cohort are protected, and requests for this data will be reviewed by Vanderbilt University Medical Center to determine whether the request is subject to any intellectual property or confidentiality obligations. Any such data and materials that can be shared will be released via a material transfer agreement. Source data are provided with this paper.
Code availability
DRIVE is available at https://github.com/belowlab/drive.
Competing interests
The authors declare no competing interests.
Footnotes
Publisher’s note Springer Nature remains neutral with regard to jurisdictional claims in published maps and institutional affiliations.
These authors contributed equally: Megan C. Lancaster, Hung-Hsin Chen.
These authors jointly supervised this work: Dan M. Roden, Jennifer E. Below.
Supplementary information
The online version contains supplementary material available at 10.1038/s41467-024-51977-4.
References
- 1.Gail, M. H., Pee, D., Benichou, J. & Carroll, R. Designing studies to estimate the penetrance of an identified autosomal dominant mutation: cohort, case-control, and genotyped-proband designs. Genet. Epidemiol.16, 15–39 (1999). [DOI] [PubMed] [Google Scholar]
- 2.Kingdom, R. & Wright, C. F. Incomplete Penetrance and Variable Expressivity: From Clinical Studies to Population Cohorts. Front. Genet .13, 920390 (2022). 10.3389/fgene.2022.920390 [DOI] [PMC free article] [PubMed] [Google Scholar]
- 3.Nait Saada, J. et al. Identity-by-descent detection across 487,409 British samples reveals fine scale population structure and ultra-rare variant associations. Nat. Commun.11, 6130 (2020). 10.1038/s41467-020-19588-x [DOI] [PMC free article] [PubMed] [Google Scholar]
- 4.Staples, J. et al. PADRE: Pedigree-Aware Distant-Relationship Estimation. Am. J. Hum. Genet.99, 154–162 (2016). 10.1016/j.ajhg.2016.05.020 [DOI] [PMC free article] [PubMed] [Google Scholar]
- 5.Staples, J. et al. PRIMUS: improving pedigree reconstruction using mitochondrial and Y haplotypes. Bioinformatics32, 596–598 (2016). 10.1093/bioinformatics/btv618 [DOI] [PMC free article] [PubMed] [Google Scholar]
- 6.Staples, J. et al. PRIMUS: rapid reconstruction of pedigrees from genome-wide estimates of identity by descent. Am. J. Hum. Genet.95, 553–564 (2014). 10.1016/j.ajhg.2014.10.005 [DOI] [PMC free article] [PubMed] [Google Scholar]
- 7.Staples, J., Nickerson, D. A. & Below, J. E. Utilizing graph theory to select the largest set of unrelated individuals for genetic analysis. Genet. Epidemiol.37, 136–141 (2013). 10.1002/gepi.21684 [DOI] [PMC free article] [PubMed] [Google Scholar]
- 8.Browning, S. R. & Thompson, E. A. Detecting rare variant associations by identity-by-descent mapping in case-control studies. Genetics190, 1521–1531 (2012). 10.1534/genetics.111.136937 [DOI] [PMC free article] [PubMed] [Google Scholar]
- 9.Belbin, G. M. et al. Genetic identification of a common collagen disease in puerto ricans via identity-by-descent mapping in a health system. Elife6, e25060 (2017). 10.7554/eLife.25060 [DOI] [PMC free article] [PubMed] [Google Scholar]
- 10.Krahn, A. D. et al. Congenital Long QT Syndrome. JACC Clin. Electrophysiol.8, 687–706 (2022). 10.1016/j.jacep.2022.02.017 [DOI] [PubMed] [Google Scholar]
- 11.Splawski, I., Tristani-Firouzi, M., Lehmann, M. H., Sanguinetti, M. C. & Keating, M. T. Mutations in the hminK gene cause long QT syndrome and suppress IKs function. Nat. Genet17, 338–340 (1997). 10.1038/ng1197-338 [DOI] [PubMed] [Google Scholar]
- 12.Sanguinetti, M. C. et al. Coassembly of K(V)LQT1 and minK (IsK) proteins to form cardiac I(Ks) potassium channel. Nature384, 80–83 (1996). 10.1038/384080a0 [DOI] [PubMed] [Google Scholar]
- 13.Yang, T., Kupershmidt, S. & Roden, D. M. Anti-minK antisense decreases the amplitude of the rapidly activating cardiac delayed rectifier K+ current. Circ. Res77, 1246–1253 (1995). 10.1161/01.RES.77.6.1246 [DOI] [PubMed] [Google Scholar]
- 14.McDonald, T. V. et al. A minK-HERG complex regulates the cardiac potassium current I(Kr). Nature388, 289–292 (1997). 10.1038/40882 [DOI] [PubMed] [Google Scholar]
- 15.Lewis, A., McCrossan, Z. A., Abbott, G. W. & MinK MiRP1, and MiRP2 diversify Kv3.1 and Kv3.2 potassium channel gating. J. Biol. Chem.279, 7884–7892 (2004). 10.1074/jbc.M310501200 [DOI] [PubMed] [Google Scholar]
- 16.Adler, A. et al. An International, Multicentered, Evidence-Based Reappraisal of Genes Reported to Cause Congenital Long QT Syndrome. Circulation141, 418–428 (2020). 10.1161/CIRCULATIONAHA.119.043132 [DOI] [PMC free article] [PubMed] [Google Scholar]
- 17.Giudicessi, J. R., Rohatgi, R. K., Tester, D. J. & Ackerman, M. J. Variant Frequency and Clinical Phenotype Call Into Question the Nature of Minor, Nonsyndromic Long-QT Syndrome-Susceptibility Gene-Disease Associations. Circulation141, 495–497 (2020). 10.1161/CIRCULATIONAHA.119.043131 [DOI] [PubMed] [Google Scholar]
- 18.Garmany, R. et al. Clinical and functional reappraisal of alleged type 5 long QT syndrome: Causative genetic variants in the KCNE1-encoded minK beta-subunit. Heart Rhythm17, 937–944 (2020). 10.1016/j.hrthm.2020.02.003 [DOI] [PubMed] [Google Scholar]
- 19.Roberts, J. D. et al. An International Multicenter Evaluation of Type 5 Long QT Syndrome: A Low Penetrant Primary Arrhythmic Condition. Circulation141, 429–439 (2020). 10.1161/CIRCULATIONAHA.119.043114 [DOI] [PMC free article] [PubMed] [Google Scholar]
- 20.Xia, F. et al. Random Walks: A Review of Algorithms and Applications. IEEE Trans. Emerg. Top. Comput. Intell.4, 95–107 (2020). 10.1109/TETCI.2019.2952908 [DOI] [Google Scholar]
- 21.Albers, P. K. & McVean, G. Dating genomic variants and shared ancestry in population-scale sequencing data. PLoS Biol.18, e3000586 (2020). 10.1371/journal.pbio.3000586 [DOI] [PMC free article] [PubMed] [Google Scholar]
- 22.Genomes Project, C. et al. A global reference for human genetic variation. Nature526, 68–74 (2015). 10.1038/nature15393 [DOI] [PMC free article] [PubMed] [Google Scholar]
- 23.Reich, D. & Goldstein, D. Estimating the ages of mutations using variation at linked markers. in Microsatellites: Evolution & Applications 129–138 (Oxford University Press, 1999).
- 24.Mazzanti, A. et al. Interplay Between Genetic Substrate, QTc Duration, and Arrhythmia Risk in Patients With Long QT Syndrome. J. Am. Coll. Cardiol.71, 1663–1671 (2018). 10.1016/j.jacc.2018.01.078 [DOI] [PubMed] [Google Scholar]
- 25.Kutyifa, V. et al. Clinical aspects of the three major genetic forms of long QT syndrome (LQT1, LQT2, LQT3). Ann. Noninvasive Electrocardiol.23, e12537 (2018). 10.1111/anec.12537 [DOI] [PMC free article] [PubMed] [Google Scholar]
- 26.Chong, J. X. et al. The Genetic Basis of Mendelian Phenotypes: Discoveries, Challenges, and Opportunities. Am. J. Hum. Genet.97, 199–215 (2015). 10.1016/j.ajhg.2015.06.009 [DOI] [PMC free article] [PubMed] [Google Scholar]
- 27.Zhou, Y., Browning, S. R. & Browning, B. L. A Fast and Simple Method for Detecting Identity-by-Descent Segments in Large-Scale Data. Am. J. Hum. Genet.106, 426–437 (2020). 10.1016/j.ajhg.2020.02.010 [DOI] [PMC free article] [PubMed] [Google Scholar]
- 28.Shemirani, R. et al. Rapid detection of identity-by-descent tracts for mega-scale datasets. Nat. Commun.12, 3546 (2021). 10.1038/s41467-021-22910-w [DOI] [PMC free article] [PubMed] [Google Scholar]
- 29.Naseri, A., Liu, X., Tang, K., Zhang, S. & Zhi, D. RaPID: ultra-fast, powerful, and accurate detection of segments identical by descent (IBD) in biobank-scale cohorts. Genome Biol.20, 143 (2019). 10.1186/s13059-019-1754-8 [DOI] [PMC free article] [PubMed] [Google Scholar]
- 30.Gusev, A. et al. DASH: a method for identical-by-descent haplotype mapping uncovers association with recent variation. Am. J. Hum. Genet.88, 706–717 (2011). 10.1016/j.ajhg.2011.04.023 [DOI] [PMC free article] [PubMed] [Google Scholar]
- 31.Richards, S. et al. Standards and guidelines for the interpretation of sequence variants: a joint consensus recommendation of the American College of Medical Genetics and Genomics and the Association for Molecular Pathology. Genet. Med.17, 405–424 (2015). 10.1038/gim.2015.30 [DOI] [PMC free article] [PubMed] [Google Scholar]
- 32.Karczewski, K. J. et al. The mutational constraint spectrum quantified from variation in 141,456 humans. Nature581, 434–443 (2020). 10.1038/s41586-020-2308-7 [DOI] [PMC free article] [PubMed] [Google Scholar]
- 33.Fahed, A. C. et al. Polygenic background modifies penetrance of monogenic variants for tier 1 genomic conditions. Nat. Commun.11, 3635 (2020). 10.1038/s41467-020-17374-3 [DOI] [PMC free article] [PubMed] [Google Scholar]
- 34.Isaacs, A. et al. Standing genetic variation affects phenotypic heterogeneity in a SCN5A-mutation founder population with excess sudden cardiac death. Heart Rhythm20, 720–727 (2023). 10.1016/j.hrthm.2023.02.004 [DOI] [PubMed] [Google Scholar]
- 35.Weedon, M. et al. Use of SNP chips to detect rare pathogenic variants: retrospective, population based diagnostic evaluation. BMJ.372, n214 (2021). [DOI] [PMC free article] [PubMed] [Google Scholar]
- 36.Gordon, A. S. et al. Frequency of genomic secondary findings among 21,915 eMERGE network participants. Genet. Med.22, 1470–1477 (2020). 10.1038/s41436-020-0810-9 [DOI] [PMC free article] [PubMed] [Google Scholar]
- 37.Roden, D. M. et al. Development of a large-scale de-identified DNA biobank to enable personalized medicine. Clin. Pharm. Ther.84, 362–369 (2008). 10.1038/clpt.2008.89 [DOI] [PMC free article] [PubMed] [Google Scholar]
- 38.Purcell, S. et al. PLINK: a tool set for whole-genome association and population-based linkage analyses. Am. J. Hum. Genet81, 559–575 (2007). 10.1086/519795 [DOI] [PMC free article] [PubMed] [Google Scholar]
- 39.Chang, C. C. et al. Second-generation PLINK: rising to the challenge of larger and richer datasets. Gigascience4, 7 (2015). 10.1186/s13742-015-0047-8 [DOI] [PMC free article] [PubMed] [Google Scholar]
- 40.Chen, H. H. et al. Host genetic effects in pneumonia. Am. J. Hum. Genet108, 194–201 (2021). 10.1016/j.ajhg.2020.12.010 [DOI] [PMC free article] [PubMed] [Google Scholar]
- 41.Delaneau, O., Zagury, J. F., Robinson, M. R., Marchini, J. L. & Dermitzakis, E. T. Accurate, scalable and integrative haplotype estimation. Nat. Commun.10, 5436 (2019). 10.1038/s41467-019-13225-y [DOI] [PMC free article] [PubMed] [Google Scholar]
- 42.Danecek, P. & McCarthy, S. A. BCFtools/csq: haplotype-aware variant consequences. Bioinformatics33, 2037–2039 (2017). 10.1093/bioinformatics/btx100 [DOI] [PMC free article] [PubMed] [Google Scholar]
- 43.Huff, C. D. et al. Maximum-likelihood estimation of recent shared ancestry (ERSA). Genome Res.21, 768–774 (2011). 10.1101/gr.115972.110 [DOI] [PMC free article] [PubMed] [Google Scholar]
- 44.Lefort, V., Desper, R. & Gascuel, O. FastME 2.0: A Comprehensive, Accurate, and Fast Distance-Based Phylogeny Inference Program. Mol. Biol. Evol.32, 2798–2800 (2015). 10.1093/molbev/msv150 [DOI] [PMC free article] [PubMed] [Google Scholar]
- 45.Chen, S., Zhou, Y., Chen, Y. & Gu, J. fastp: an ultra-fast all-in-one FASTQ preprocessor. Bioinformatics34, i884–i890 (2018). 10.1093/bioinformatics/bty560 [DOI] [PMC free article] [PubMed] [Google Scholar]
- 46.Vasimuddin, M., Misra, S., Li, H. & Aluru, S. Efficient Architecture-Aware Acceleration of BWA-MEM for Multicore Systems. 2019 Ieee 33rd International Parallel and Distributed Processing Symposium (Ipdps 2019), 314–324 (2019).
- 47.McKenna, A. et al. The Genome Analysis Toolkit: a MapReduce framework for analyzing next-generation DNA sequencing data. Genome Res.20, 1297–1303 (2010). 10.1101/gr.107524.110 [DOI] [PMC free article] [PubMed] [Google Scholar]
- 48.Das, S. et al. Next-generation genotype imputation service and methods. Nat. Genet.48, 1284–1287 (2016). 10.1038/ng.3656 [DOI] [PMC free article] [PubMed] [Google Scholar]
- 49.McCarthy, S. et al. A reference panel of 64,976 haplotypes for genotype imputation. Nat. Genet.48, 1279–1283 (2016). 10.1038/ng.3643 [DOI] [PMC free article] [PubMed] [Google Scholar]
- 50.Nauffal, V. et al. Monogenic and Polygenic Contributions to QTc Prolongation in the Population. Circulation145, 1524–1533 (2022). 10.1161/CIRCULATIONAHA.121.057261 [DOI] [PMC free article] [PubMed] [Google Scholar]
- 51.Woosley, R. et al. QTdrugs list. 2020. URL: www.credibleMeds.org (2020).
- 52.Team, R. C. R. A language and environment for statistical computing. R Foundation for Statistical Computing, Vienna, Austria. http://www.R-project.org/ (2013).
- 53.Harrell, F. rms: Regression Modeling Strategies. R package version 6.3-0. (2022).
Associated Data
This section collects any data citations, data availability statements, or supplementary materials included in this article.
Supplementary Materials
Data Availability Statement
Select phenotypic and genotypic source data are provided with this paper. The summary phenotypic and genotypic data generated in this study have been deposited in the National Institutes of Health dbGaP database [https://www.ncbi.nlm.nih.gov/gap/] under accession number phs003685.v1. These data are available under controlled access given the risk of subject re-identification in this small cohort from a specific geographic region with a rare, potentially stigmatizing genetic variant. Access can be obtained following submission of an online Data Access Request via the dbGaP Authorized Access page [https://dbgap.ncbi.nlm.nih.gov/aa/wga.cgi?page=login] and approval of the request by dbGaP. The array genotypes and EHR-derived clinical data on the BioVU subjects were generated independently of this study for the BioVU biobank at VUMC. De-identified, raw genotypic and EHR-derived clinical data from BioVU are only available upon submission of a study proposal and approval through the BioVU Review Committee. Access to BioVU vetting includes institutional IRB non-human subjects research determination, data use agreements between the BioVU program and the researcher(s), and both administrative and scientific reviews for approval. Proposals are reviewed by several committees and timelines vary based on the acuity of the request and deliverables involved. A VUMC or Vanderbilt Principal Investigator is required for academic collaborations. Industry and commercial requests are managed by Nashville Biosciences, a wholly owned subsidiary of VUMC. Contact biovu@vumc.org for access requests or questions. Additional details for researchers are available on the BioVU publicly facing website [https://victr.vumc.org/biovu-description/]. The de-identified, raw genetic data from the clinic cohort are protected, and requests for this data will be reviewed by Vanderbilt University Medical Center to determine whether the request is subject to any intellectual property or confidentiality obligations. Any such data and materials that can be shared will be released via a material transfer agreement. Source data are provided with this paper.
DRIVE is available at https://github.com/belowlab/drive.