

Abstract
Background:
Discharge destination after traumatic brain injury (TBI) may be influenced by non-patient factors such as regional or institutional practice patterns. We hypothesized that non-patient factors would be associated with discharge destination in severe TBI patients.
Methods:
All patients in the ACS Trauma Quality Improvement Program 2016 data set with severe TBI, defined as head Abbreviated Injury Scale ≥3, were categorized by discharge destination. Logistic regression was used to assess factors associated with each destination; odds ratios and 95% confidence level are reported. Regressions were adjusted for age, gender, race, insurance, GCS, ISS, polytrauma, mechanism, neurosurgical procedure, geographic region, teaching status, trauma center level, hospital size, and neurosurgeon group size.
Results:
75,690 patients met inclusion criteria. 51% were discharged to home, 16% to rehab, 14% to SNF, and 11% deceased. Mortality was similar across geographic region, teaching status, and hospital size. Southern patients were more likely to be discharged to home while Northeastern patients were more likely to be discharged to rehab. Treatment by groups of 3 or more neurosurgeons was associated with SNF discharge as was treatment at community or non-teaching hospitals. Patients treated at larger hospitals were less likely to be discharged to rehab and more likely to go to SNF.
Conclusions:
Geographic region, neurosurgeon group size, teaching status, and hospital size are significantly associated with variation in discharge destination following severe TBI. Regional and institutional variation in practice patterns may play important roles in recovery for some patients with severe TBI.
Keywords: discharge destination, practice variation, TBI, trauma center
Introduction:
Traumatic brain injury (TBI) affects millions annually in the US and represents a significant burden on the healthcare system.1 Management of TBI consists of both immediate surgical and medical lifesaving interventions but also includes acute rehabilitation.2,3 Rehabilitation strategies include both physical as well as cognitive and mental rehabilitation in order to address sequalae of injury and maximize post-injury function.4–7 While acute rehab has been accepted as the optimal destination for discharged TBI patients, patients often prefer to be discharged home.8 In addition, there are no clear guidelines on how to determine the optimal discharge disposition for patients after TBI.9 A number of patient-associated factors, like race and insurance status, have been associated with differences in discharge to acute rehabilitation.10,11
Prior reports have demonstrated that spending on post-acute care accounts for a large portion of the regional variation in Medicare reimbursements.12 It has been previously established that there is regional variation regarding the discharge disposition of patients, such as those with heart failure. 13–15 Additionally, we previously established that surgical interventions in severe TBI have regional and hospital-based variation not explained by patient factors.16 State-level variation in mortality and rehabilitation in adult TBI patients has also been identified.17
We hypothesized that hospital and regional factors would be associated with differences in discharge disposition after severe TBI. We predicted that geographic region, hospital size, trauma center level, and neurosurgeon practice size would be independently associated with differences in in-hospital mortality and discharge to acute rehabilitation.
Methods:
We utilized the American College of Surgeons (ACS) Trauma Quality Improvement Program (TQIP) 2016 National Trauma Data Bank (NTDB) to examine all TBI patients admitted to participating trauma centers. In order to consider surgical intervention as a potential variable associated with discharge disposition, we cross-referenced ICD-9 and ICD-10 codes for craniotomies/craniectomies and intracranial pressure monitor (ICPm) placement (Supplemental Material) with procedure codes recorded in TQIP. Through this, we were able to flag patients with these neurosurgical procedures and amend them to the TQIP 2016 NTDB by unique incident identifier, thereby matching procedure specific information to individual patients in our dataset. We then isolated all patients in the amended TQIP 2016 NTDB with severe TBI as determined by a head Abbreviated Injury Scale (AIS) of 3 or greater (Figure 1).
Figure 1:
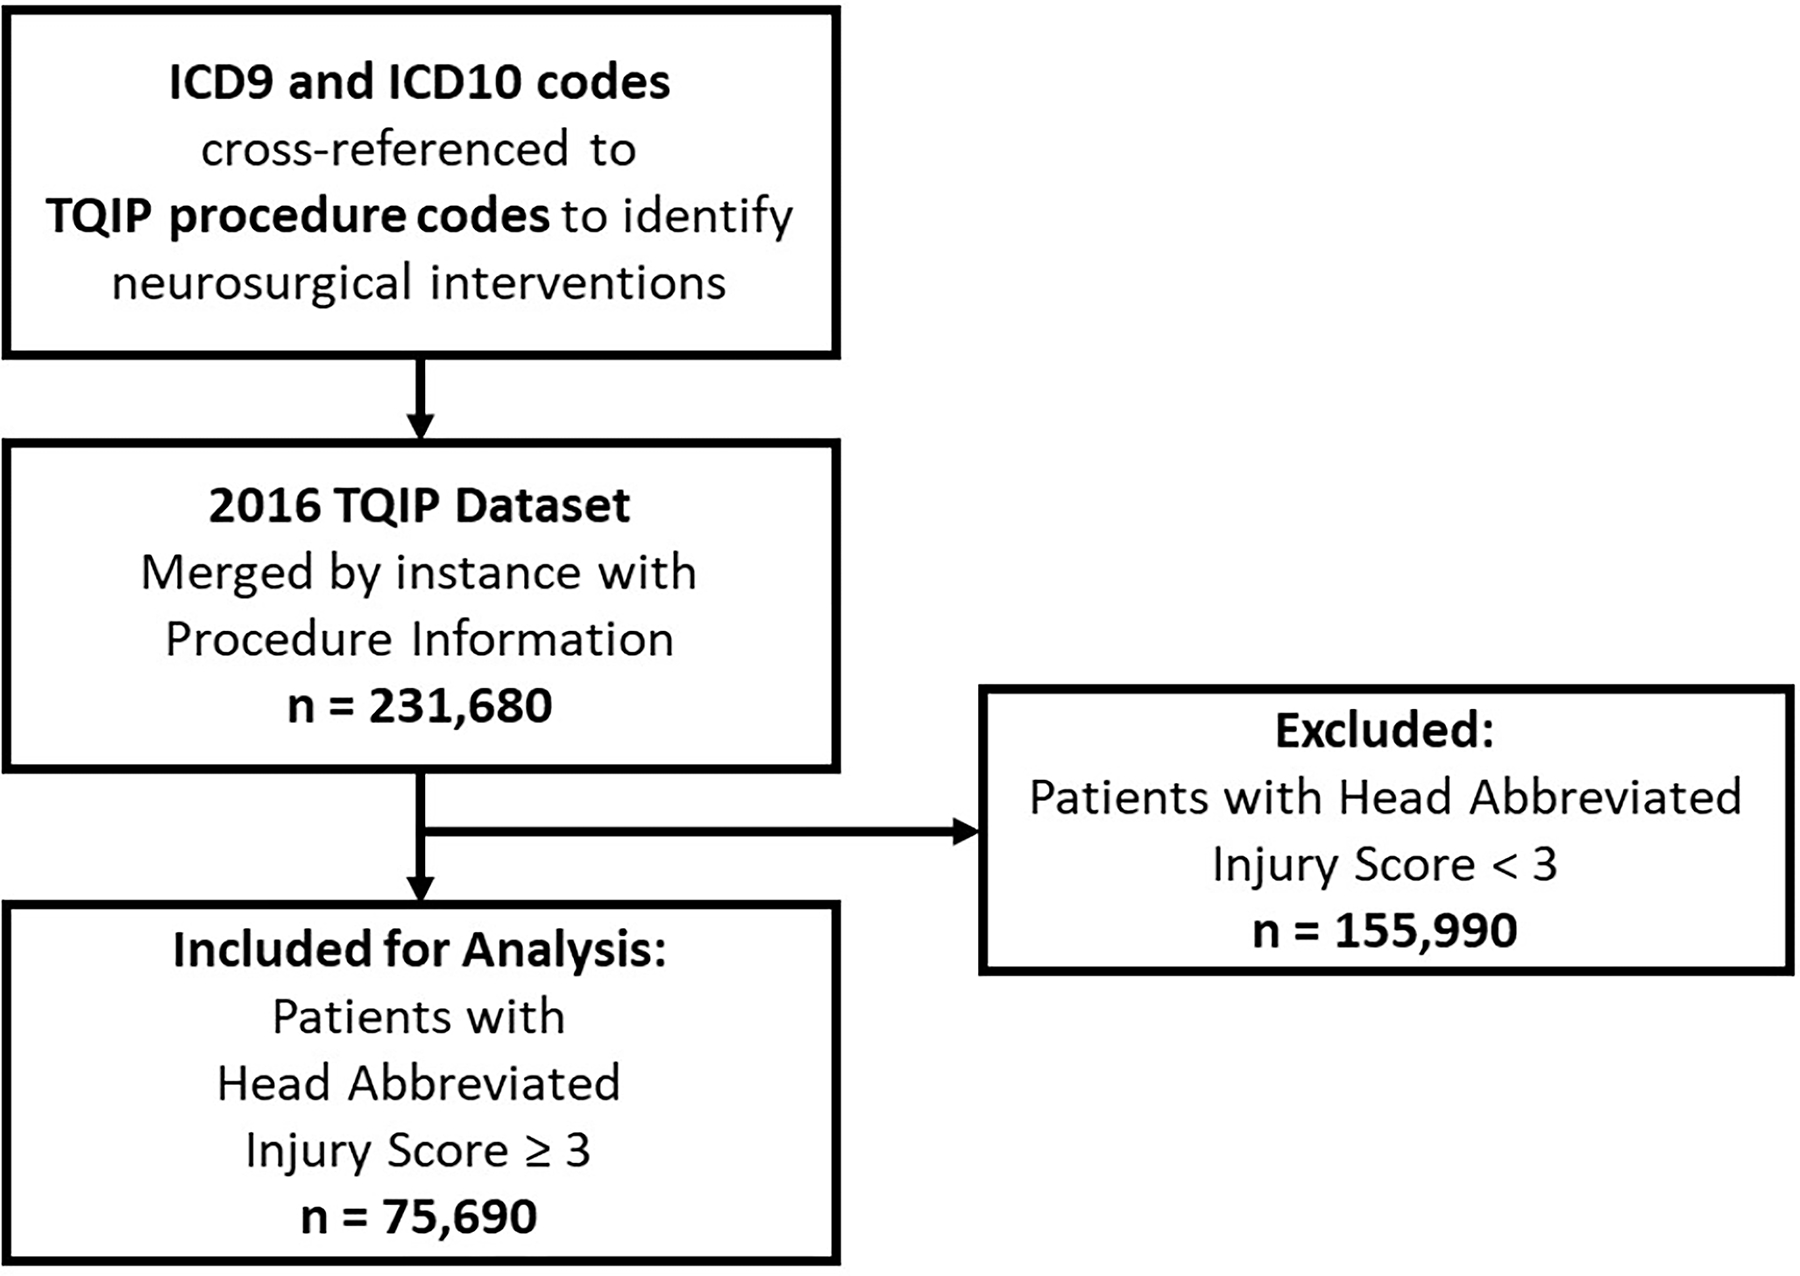
Inclusion and Exclusion Criteria.
Our outcomes of interest were factors independently associated with discharge destination. To evaluate this, we examined both patient specific factors (age, gender, race, insurance status, Injury Severity Score (ISS), Glasgow Coma Scale (GCS), polytrauma, penetrating or blunt mechanism, and procedure) and non-patient specific factors (geographic region, hospital size, trauma center level, teaching status, and hospital neurosurgeon group size).
For purposes of patient privacy, the TQIP 2016 NTDB groups all patients aged 90 years or older (n = 4,827) in one age bracket. In order to maintain consistency with this methodology, we subsequently categorized patient age by decile. Patients with unknown gender identity (n = 8) were categorized as male for regressions as this gender label perfectly predicted discharge destination. As several of the possible primary racial identifications listed in the TQIP 2016 NTDB had group size too small to support meaningful analysis, racial identity was recategorized into White, Black or African American, and Other categories, the last of which includes patients who identified as Asian, Native Hawaiian or Other Pacific Islander, Other Race, Not Applicable, or Not Known/Not Recorded. The nine possible insurance statuses available in the TQIP 2016 NTDB were simplified to Government, Private, and Other/Unknown Insurance categories. Government insurance was composed of patients labeled as “Medicare,” “Medicaid,” or “Other Government Insurance.” Private insurance was composed of patients labeled as “Private/Commercial Insurance” or “Self Pay,” and Other/Unknown Insurance was composed of patients labeled as “Other,” “Not Known/Not Recorded,” “Not Applicable,” or “Not Billed.” Trauma center level was categorized into Level I, II, or III centers primarily based on ACS-verified levels and secondarily on state-designated levels. Thus a center labeled Level II by ACS and Level I by a state was considered as a Level II center for our analysis.
As the TQIP 2016 NTDB includes fifteen possible discharge destinations, some consolidation of possible sites was necessary to facilitate meaningful comparisons. For this analysis Discharge to Home consisted of patients categorized as “Discharged to home or self-care (routine discharge),” “Discharge/Transferred to home under care of organized home health serv,” or “Left against medical advice or discontinued care.” Discharge to Rehabilitation consisted of patients categorized as “Discharged/Transferred to inpatient rehab or designated unit.” Discharge to Skilled Nursing Facility (SNF) consisted of patients categorized as “Discharged/Transferred to an Intermediate Care Facility (ICF),” “Discharged/Transferred to Skilled Nursing Facility,” or “Discharged/Transferred to Long Term Care Hospital.” Deceased status consisted of patients categorized as “Deceased/Expired.” Discharge to Other/Unknown consisted of patients categorized as “Discharged/Transferred to court/law enforcement,” “Discharged/Transferred to another type of institution not defined else,” “‘Not Applicable BIU 1,” “Discharged/Transferred to hospice care”, “Discharged/transferred to a psychiatric hospital or psychiatric distin,”, “Discharged/Transferred to a short-term general hospital for inpatient”, or with a blank discharge destination field. Due to the scope and ambiguity of the Discharge to Other/Unknown category, these patients are excluded from discussion (full regression results presented in supplemental material).
Logistic regression was utilized to assess for both patient and non-patient factors associated with discharge destination. Regressions were adjusted for age by decile, gender, race, insurance status, ISS, GCS, polytrauma, trauma type, and neurosurgical procedure (craniotomy/craniectomy and/or ICPm) as well as region, hospital size as determined by total bed number, teaching status, trauma level, and hospital neurosurgeon group size Regression strength is reported as concordance statistic (C-stat) and regression results are reported as odds ratios and 95% confidence intervals.
This study was approved by the Institutional Review Board at MetroHealth Medical Center. Statistics were performed using R, version 4.0.1 (R Foundation for Statistical Computing, Vienna, Austria).
Results:
We identified 75,690 patients (66.4% male, median age 59 [36–77]) with a median ISS of 17 [11–25]. Of these patients, the majority were white (73%), had Medicare as primary insurance (35%), and were treated at a Level I trauma center (42%). Isolated TBI made up 77% of the population (Table 1). Overall, 51.3% (n = 38,855) were discharged home, 15.6% (n = 11,791) were discharged to rehab, 14.4% (n = 10,901) were discharged to SNF, 7.4% were discharged to Other/Unknown (n = 5,614), and 11.3% (n = 8,529) died prior to discharge (Table 2).
Table 1:
Patient Demographics
| Demographic Category | n=75,690 ( median [IQR] or % (n=) ) |
|---|---|
| Age | 59, [36 – 77] |
| Male Gender | 66.41% (n = 50,263) |
| Primary Race Identification | |
| White | 72.74% (n = 55,058) |
| Black or African American | 10.79% (n = 8,164) |
| Other | 16.47% (n = 12,468) |
| Hispanic Ethnicity | 10.95% (n = 8,288) |
| Insurance status | |
| Government | 51.97% (n = 39,340) |
| Private or Self-Pay | 41.01% (n = 31,038) |
| Other or Unknown | 7.02%% (n = 5,312) |
| Injury Severity Score | 17, [11 – 25] |
| ED GCS ≤ 8 | 21.85% (n = 16,541) |
| Head AIS | |
| 3 | 49.11% (n = 37,170) |
| 4 | 28.28% (n = 21,405) |
| 5 | 21.34% (n = 16,149) |
| 6 | 0.38% (n = 287) |
| Isolated TBI (all other body AIS <3) | 77.26% (n = 58,480) |
| Penetrating Mechanism | 3.83% (n = 2,896) |
| Procedure | |
| Craniotomy/Craniectomy | 4.40% (n = 3,327) |
| Intracranial Pressure Monitor (ICPm) | 4.78% (n = 3,618) |
| Both Craniotomy/Craniectomy and ICPm | 1.71% (n = 1,297) |
| Neither Craniotomy/Craniectomy or ICPm | 89.11% (n = 67,448) |
| Region | |
| Northeast | 18.24% (n = 13,805) |
| Midwest | 20.73% (n = 15,693) |
| West | 22.18% (n = 16,790) |
| South | 36.72% (n = 27,793) |
| Neurosurgeon Group Size | |
| 1–2 | 7.99% (n = 6,051) |
| 3–5 | 46.85% (n = 35,461) |
| ≥6 | 45.16% (n = 34,178) |
| Teaching Status | |
| University | 51.88% (n = 39,269) |
| Community | 36.75% (n = 27,819) |
| Non-Teaching | 11.36% (n = 8,602) |
| Bed-Size | |
| ≤ 200 Beds | 3.81% (n = 2,885) |
| 201 to 400 Beds | 23.41% (n = 17,718) |
| 401 to 600 Beds | 29.12% (n = 22,044) |
| ≥ 600 Beds | 43.66% (n = 33,043) |
Table 2:
Discharge Destination Patient Counts and Rates by Non-Patient Factors
| Home (n = 38,855) | Rehab (n = 11,791) | SNF/ICF/LTC (n = 10,901) | Other/Unknown (n = 5,614) | Deceased (n = 8,529) | |||||||
|---|---|---|---|---|---|---|---|---|---|---|---|
|
| |||||||||||
| Region: | Midwest | 7,813 | 49.8% | 2,537 | 16.2% | 2,701 | 17.2% | 915 | 5.8% | 1,727 | 11.0% |
| Northeast | 6,703 | 48.6% | 2,916 | 21.1% | 1,778 | 12.9% | 1,029 | 7.5% | 1,379 | 10.0% | |
| South | 14,890 | 53.6% | 4,023 | 14.5% | 3,783 | 13.6% | 1,802 | 6.5% | 3,295 | 11.9% | |
| West | 8,647 | 51.5% | 2,024 | 12.1% | 2,594 | 15.4% | 1,619 | 9.6% | 1,906 | 11.4% | |
|
| |||||||||||
| Neurosurgeon Group Size: | 1–2 | 3,168 | 52.4% | 908 | 15.0% | 727 | 12.0% | 548 | 9.1% | 700 | 11.6% |
| 3–5 | 18,405 | 51.9% | 5,182 | 14.6% | 5,260 | 14.8% | 2,826 | 8.0% | 3,788 | 10.7% | |
| ≥ 6 | 17,282 | 50.6% | 5,701 | 16.7% | 4,914 | 14.4% | 2,240 | 6.6% | 4,041 | 11.8% | |
|
| |||||||||||
| Teaching Status: | University | 20,189 | 51.4% | 6,295 | 16.0% | 5,227 | 13.3% | 2,845 | 7.2% | 4,713 | 12.0% |
| Community | 14,296 | 51.4% | 4,237 | 15.2% | 4,276 | 15.4% | 2,077 | 7.5% | 2,933 | 10.5% | |
| Non-Teaching | 4,370 | 50.8% | 1,259 | 14.6% | 1,398 | 16.3% | 692 | 8.0% | 883 | 10.3% | |
|
| |||||||||||
| Hospital Size: | ≤ 200 Beds | 1,485 | 51.5% | 485 | 16.8% | 325 | 11.3% | 264 | 9.2% | 326 | 11.3% |
| 201 to 400 Beds | 9,137 | 51.6% | 2,561 | 14.5% | 2,706 | 15.3% | 1,398 | 7.9% | 1,916 | 10.8% | |
| 401 to 600 Beds | 11,273 | 51.1% | 3,413 | 15.5% | 3,230 | 14.7% | 1,653 | 7.5% | 2,475 | 11.2% | |
| ≥ 600 Beds | 16,960 | 51.3% | 5,332 | 16.1% | 4,640 | 14.0% | 2,299 | 7.0% | 3,812 | 11.5% | |
|
| |||||||||||
| Trauma Level: | Level I | 23,692 | 51.8% | 7,179 | 15.7% | 6,328 | 13.8% | 3,165 | 6.9% | 5,400 | 11.8% |
| Level II | 14,288 | 50.9% | 4,313 | 15.4% | 4,287 | 15.3% | 2,284 | 8.1% | 2,909 | 10.4% | |
| Level III | 213 | 53.7% | 58 | 14.6% | 64 | 16.1% | 17 | 4.3% | 45 | 11.3% | |
In an adjusted regression analysis, region of the country was significantly associated with discharge disposition: hospitals in the Northeast were less likely to discharge home (OR 0.85 [0.80–0.90]) or to a SNF (OR 0.64 [0.59–0.69]), but more likely to discharge to a rehabilitation facility (OR 1.53 [1.44–1.64]), as compared with the Midwest. Hospitals in the South were less likely to discharge to a rehabilitation facility (OR 0.82 [0.78–0.88]) or SNF (OR 0.82 [0.77–0.88]), but more likely to discharge home (OR 1.25 [1.18–1.31]) as compared to the Midwest. Hospitals in the West were less likely to discharge to a rehabilitation facility (OR 0.71 [0.66–0.76]) but otherwise were not associated with any significant differences relative to Midwestern hospitals. Region did not significantly affect the rate at which patients died prior to discharge.
Neurosurgeon group size also yielded significant results. Neurosurgeon groups with 3–5 physicians were more likely to discharge to a SNF (OR 1.28 [1.17–1.42]) and had lower odds of in-hospital mortality (OR 0.85 [0.76–0.95]), as compared with a neurosurgeon group size of 1–2. No significant difference was found in odds of discharge home (OR 1.01 [0.94–1.09]) or to a rehabilitation facility (OR 1.01 [0.92–1.09]). In groups of ≥ 6 neurosurgeons, discharge to rehabilitation centers (OR 1.24 [1.13–1.35]) and SNF (OR 1.27 [1.15–1.41]) were more likely, with no difference in discharge home (OR 0.97 [0.89–1.04]). These patients were also less likely to die prior to discharge (OR 0.86 [0.77–0.97]).
When compared with university hospitals, significant differences in discharge were found in both community and non-teaching hospitals. Community hospitals were less likely to discharge home (OR 0.92 [0.88–0.97]) and more likely to discharge to SNF (OR 1.07 [1.01–1.14]), with no difference in rates of discharge to a rehabilitation facility (OR 1.05 [0.99–1.12]) and no difference in death prior to discharge (OR 1.03 [0.95–1.11]). A similar pattern emerged with non-teaching hospitals, which were less likely to discharge home (OR 0.82 [0.76–0.89]) and more likely to discharge to a SNF (OR 1.14 [1.04–1.25]), with no difference in rates of discharge to a rehabilitation facility (OR 1.03 [0.94–1.13]) and no difference in death prior to discharge (OR 1.03 [0.91–1.16]).
When compared with smaller hospital sizes (≤200 beds), hospitals with 201–400 beds were less likely to discharge to rehabilitation centers (OR 0.81 [0.72–0.91]) and more likely to discharge to SNF (OR 1.25 [1.09–1.43]). Hospitals of 401–600 beds were also less likely to discharge to rehabilitation facilities (OR 0.85 [0.75–0.96]) and more likely to discharge to SNF (OR 1.24 [1.08–1.43]). Finally, bed size of >600 was less likely to discharge to a rehabilitation facility (OR 0.85 [0.75–0.96]) and more likely to discharge to a SNF (OR 1.21 [1.05–1.40]). Hospital size did not significantly affect odds of discharge home or death prior to discharge.
Compared to Level 1 trauma centers, Level II trauma centers were less likely to discharge home (OR 0.90 [0.85–0.95]) and more likely to discharge to a rehabilitation center (OR 1.11 [1.04–1.19]). No significant difference was found in discharge to SNF (OR 0.98 [0.92–1.05]) or death prior to discharge (OR 0.94 [0.86–1.02]). Level III trauma centers did not significantly differ from Level I trauma centers in any category (Table 3).
Table 3:
Discharge Destination Odds by Non-Patient Factors
| Home (C-Stat: 0.830) | Rehab (C-Stat: 0.668) | SNF (C-Stat: 0.744) | Deceased (C-Stat: 0.887) | ||
|---|---|---|---|---|---|
|
| |||||
| Region: | Midwest | Reference | Reference | Reference | Reference |
| Northeast | 0.85* (0.80 – 0.90) | 1.53* (1.44 – 1.64) | 0.64* (0.59 – 0.69) | 1.01 (0.91 – 1.11) | |
| South | 1.25* (1.18 – 1.31) | 0.82* (0.78 – 0.88) | 0.82* (0.77 – 0.88) | 1.06 (0.98 – 1.14) | |
| West | 1.01 (0.95 – 1.07) | 0.71* (0.66 – 0.76) | 1.02 (0.95 – 1.10) | 1.00 (0.91 – 1.10) | |
|
| |||||
| Neurosurgeon Group Size: | 1–2 | Reference | Reference | Reference | Reference |
| 3–5 | 1.01 (0.94 – 1.09) | 1.01 (0.92 – 1.09) | 1.28* (1.17 – 1.42) | 0.85* (0.76 – 0.95) | |
| ≥ 6 | 0.97 (0.89 – 1.04) | 1.24* (1.13 – 1.35) | 1.27* (1.15 – 1.41) | 0.86* (0.77 – 0.97) | |
|
| |||||
| Teaching Status: | University | Reference | Reference | Reference | Reference |
| Community | 0.92* (0.88 – 0.97) | 1.05 (0.99 – 1.12) | 1.07* (1.01 – 1.14) | 1.03 (0.95 – 1.11) | |
| Non-Teaching | 0.82* (0.76 – 0.89) | 1.03 (0.94 – 1.13) | 1.14* (1.04 – 1.25) | 1.03 (0.91 – 1.16) | |
|
| |||||
| Hospital Size: | ≤200 Beds | Reference | Reference | Reference | Reference |
| 201–400 Beds | 1.05 (0.95 – 1.16) | 0.81* (0.72 – 0.91) | 1.25* (1.09 – 1.43) | 1.03 (0.88 – 1.21) | |
| 401–600 Beds | 1.02 (0.92 – 1.13) | 0.85* (0.75 – 0.96) | 1.24* (1.08 – 1.43) | 0.95 (0.81 – 1.12) | |
| >600 Beds | 1.01 (0.91 – 1.13) | 0.85* (0.75 – 0.96) | 1.21* (1.05 – 1.40) | 0.98 (0.83 – 1.15) | |
|
| |||||
| Trauma Level: | Level I | Reference | Reference | Reference | Reference |
| Level II | 0.90* (0.85 – 0.95) | 1.11* (1.04 – 1.19) | 0.98 (0.92 – 1.05) | 0.94 (0.86 – 1.02) | |
| Level III | 0.88 (0.67 – 1.16) | 1.28 (0.91 – 1.77) | 1.05 (0.75 – 1.44) | 1.35 (0.90 – 1.99) | |
Results shown as Odds Ratio (95% CI),
indicates p < 0.05. Regression strength shown as concordance statistic (C-Stat).
Discussion:
This study served to identify the non-patient specific factors associated with discharge to home, discharge to rehab, discharge to SNF, or expiration in hospital. Geographic region, hospital neurosurgeon group size, teaching status, hospital size, and trauma level were all significantly associated with variation in discharge destination while only relatively large neurosurgeon group sizes were associated with decreased likelihood of hospital mortality. These findings suggest that decisions regarding discharge destination are associated with non-patient factors beyond a patient’s injury specific characteristics across the United States.
The decision to discharge a patient to a given location is complex and multi-factorial, involving consideration for injury-specific characteristics, insurance status, and treatment preferences as well as a health system’s relationships with and proximity to local post-acute care facilities.18 Moreover, hospital culture and discharge norms likely affect the decision to discharge a patient as utilization of inpatient rehabilitation facilities or SNFs varies significantly across hospitals, even when adjusting for patient, clinical, and geographic variables.19 Our study suggests that significant regional and hospital-specific variation exists in discharge to home, inpatient rehabilitation facilities, and SNFs even when controlling for patients’ injury-specific characteristics and insurance status.
One explanation for this variation is regional differences in the number of SNF and inpatient rehabilitation facilities. While our study does not assess SNF or inpatient rehabilitation facility density directly, clear regional differences are apparent when using the comparably populated states of Ohio, Georgia, and New Jersey as proxies for the Midwestern, Southern, and Northeastern regions. Per US Census data and Medicaid & Medicare SNF reimbursement data, Ohio has more than twice as many certified SNF beds per capita than Georgia and nearly a third more than New Jersey.20,21 SNF availability may impact hospital decisions regarding discharge destination, as 30-day readmission has been found to vary significantly between high-performing and low-performing SNFs.22 This may be related to SNF preferences regarding length of stay as readmission after SNF discharge was attenuated with longer SNF length of stay.23
While we considered neurosurgeon group size as a potential factor associated with discharge disparities, it is important to consider unmeasured characteristics that might also affect patient outcomes. Neurosurgeon experience, workload, and availability of hospital resources like social work and physical therapy may potentially influence the rates of discharge to inpatient rehab compared to SNF or home. This might lead to significant heterogeneity in not just regional practice patterns, but hospital-level differences in practice patterns. Additionally, we have previously demonstrated that regional variation exists in neurosurgical intervention for TBI patients, further suggesting that local practices influence the aggressiveness of care in these patients16.
Complicating the decision to discharge are local legal and economic dynamics between hospitals and post-acute care facilities. Changes in legislation have been shown to influence decisions regarding discharge. One study showed a decrease in discharge to inpatient rehabilitation facilities with a concomitant increase in home discharge following the implementation of new documentation requirements related to inpatient rehabilitation admission.24 Additionally SNF reimbursement varies significantly between states, as Ohio facilities are reimbursed 20% more than Georgia facilities and 30% more than those in New Jersey per patient day.21 State and regional reimbursement practices directly affect patient access to care and have been found to vary significantly for Medicaid patients utilizing radiological, general surgery, orthopedic surgery, plastic surgery, burn, and spinal surgery services across states.25–30 It is reasonable to assume that state and regional reimbursement practices also affect patient access to post-acute care facilities. Differences in regional legal and economic environments may thereby partially explain the variation in home, rehab, and SNF discharge observed in this study. A recent study demonstrated that increases in Medicare copayments for patients admitted to SNFs were associated with shorter lengths of stay and worse patient outcomes, increasing both hospital and SNF readmission rates.31 Additionally, one study of Medicare beneficiaries eligible for post-acute care in a SNF or at home found that discharge to home with home health care was associated with higher rates of readmission.32
While variation in availability, reimbursement, and legal environment may partially explain the regional discrepancies observed in this study, it is worth considering that hospital reports of post-acute care services may contain inaccuracies. One review of Medicare fee-for-service beneficiaries from 2006 – 2011 found that 27.9% of hospital reports detailing discharge to Medicare-covered post-acute care services were not substantiated by Medicare claims.33 Of these services, discharge to home health agencies had the highest discrepancy rate followed by inpatient rehabilitation facilities and SNFs. The etiology of these discrepancies is not well understood but may well be affected by hospital culture regarding discharge reporting as well as discharge destination selection.
This study makes use of a retrospective dataset, limiting our findings to identifying associations as opposed to establishing causation. Having said this, the large number of trauma centers who contributed to the TQIP 2016 NTDB make our findings broadly generalizable and we are confident that the dataset accurately depicts post-severe TBI discharge patterns at a national level. This study uses ICD-9 and ICD-10 procedure codes as a means of identifying and flagging neurosurgical procedures. Patients whose ICD-9 or ICD-10 codes were documented improperly may thereby be inappropriately identified as having had or not having had a neurosurgical procedure under this framework. As this is entirely dependent on the systems in place at various healthcare institutions to properly document ICD procedural codes, there is the possibility that systematic differences in billing practices have influenced our results if enough systems with similar characteristics have eschewed conventional ICD coding practices.
This study also cannot examine those factors influencing patients who were discharged to psychiatric hospitals, short-term general hospitals, hospice facilities, law enforcement custody, undefined institutions, or who were missing information regarding discharge destination due to the poor generalizability of patients with these labels. These patients made up 7.4% of our eligible patient population and represent a relatively small but poorly understood portion of all trauma patients. Additionally, this study was only able to investigate those factors included in the TQIP 2016 NTDB and did not take unavailable yet potentially relevant factors such as discharge destination availability or practice-specific cultural expectations into account. As the availability of and reimbursement for acute rehab and SNF beds varies widely across regions, it is likely that the decision to discharge to a given destination is influenced by both the logistics and economics at a given site.12,13 Accordingly, individual practices and hospital systems have likely developed their own culture related to discharge based on the historic availability of certain discharge sites. This study did not make use of length of stay data as 3.14% of our patient population was missing length of stay information in its entirety. While this information would be useful in capturing the complexity of managing a given patient’s injuries, we are confident that the use of ISS, GCS, trauma type, polytrauma status, and neurosurgical procedure type accurately capture the complexity of patient care. Finally, the TQIP 2016 NTDB does not provide data on additional factors such as trauma center volume and individual neurosurgeon years of experience.
Conclusion:
Our study suggests the influence of non-patient specific factors on discharge destination following severe TBI. Ideally, discharge destination should be based on a patient’s injury specific characteristics and optimized accordingly. Our findings suggest that factors beyond injury characteristics are strongly associated with discharge destination, including geographic region, hospital size, trauma level, and teaching status. Further research into state-specific factors, such as local Medicaid reimbursement standards, will help to better elucidate mechanisms that underlie these variations.
Supplementary Material
Highlights:
Discharge destination following severe TBI is variable by region
Hospital size, trauma level, and teaching status influence discharge destination
Severe TBI patients in the South are more likely to be discharged to home
Severe TBI patients in the Northeast are more likely to be discharged to rehab
Non-patient specific factors influence discharge destination following severe TBI
Acknowledgements:
This publication was made possible by the Clinical and Translational Science Collaborative of Cleveland, KL2TR002547 from the National Center for Advancing Translational Sciences (NCATS) component of the National Institutes of Health and NIH roadmap for Medical Research. Its contents are solely the responsibility of the authors and do not necessarily represent the official views of the NIH. The authors wish to thank Wyatt P. Bensken BS, Case Western Reserve University Department of Population and Quantitative Health Sciences, for his assistance with data collection.
Conflicts of Interest and Source of Funding:
This research did not receive any specific grant from funding agencies in the public, commercial, or not-for-profit sectors.
VPH is supported by the Clinical and Translational Science Collaborative of Cleveland (KL2TR002547) from the National Center for Advancing Translational Sciences (NCATS) component of the National Institutes of Health and NIH roadmap for Medical Research.
VPH spouse is a consultant for Zimmer Biomet, Medtronic, Sig Medical, and Atricure.
References:
- 1.Centers for Disease Control and Prevention. Report to Congress: Traumatic Brain Injury in the United States: Epidemiology and Rehabilitation; 2015. doi: 10.3171/2011.3.jns102010 [DOI] [PubMed] [Google Scholar]
- 2.Cope DN. The effectiveness of traumatic brain injury rehabilitation: A review. Brain Inj. 1995;9(7):649–670. doi: 10.3109/02699059509008224 [DOI] [PubMed] [Google Scholar]
- 3.Semlyen JK, Summers SJ, Barnes MP. Traumatic brain injury: Efficacy of multidisciplinary rehabilitation. Arch Phys Med Rehabil. 1998;79(6):678–683. doi: 10.1016/S0003-9993(98)90044-2 [DOI] [PubMed] [Google Scholar]
- 4.Cicerone KD, Goldin Y, Ganci K, et al. Evidence-Based Cognitive Rehabilitation: Systematic Review of the Literature From 2009 Through 2014. Arch Phys Med Rehabil. 2019;100(8):1515–1533. doi: 10.1016/j.apmr.2019.02.011 [DOI] [PubMed] [Google Scholar]
- 5.Lee SY, Amatya B, Judson R, et al. Clinical practice guidelines for rehabilitation in traumatic brain injury: a critical appraisal. Brain Inj. 2019;33(10):1263–1271. doi: 10.1080/02699052.2019.1641747 [DOI] [PubMed] [Google Scholar]
- 6.Rosenbaum AM, Gordon WA, Joannou A, Berman BA. Functional outcomes following post-acute rehabilitation for moderate-to-severe traumatic brain injury. Brain Inj. 2018;32(7):907–914. doi: 10.1080/02699052.2018.1469040 [DOI] [PubMed] [Google Scholar]
- 7.Agrawal M, Joshi M. Impact of rehabilitation on functional outcome during the first year of moderate and severe traumatic brain injury. Brain Inj. 2014;28(3):292–297. doi: 10.3109/02699052.2013.865266 [DOI] [PubMed] [Google Scholar]
- 8.Zarshenas S, Colantonio A, Alavinia SM, Jaglal S, Tam L, Cullen N. Predictors of Discharge Destination from Acute Care in Patients with Traumatic Brain Injury: A Systematic Review. J Head Trauma Rehabil. 2019;34(1):52–64. doi: 10.1097/HTR.0000000000000403 [DOI] [PubMed] [Google Scholar]
- 9.Oyesanya TO. Selection of discharge destination for patients with moderate-to-severe traumatic brain injury. Brain Inj. 2020;34(9):1222–1228. doi: 10.1080/02699052.2020.1797172 [DOI] [PubMed] [Google Scholar]
- 10.Asemota AO, George BP, Cumpsty-Fowler CJ, Haider AH, Schneider EB. Race and insurance disparities in discharge to rehabilitation for patients with traumatic brain injury. J Neurotrauma. 2013;30(24):2057–2065. doi: 10.1089/neu.2013.3091 [DOI] [PMC free article] [PubMed] [Google Scholar]
- 11.Rogers S, Richards KC, Davidson M, Weinstein AA, Trickey AW. Description of the moderate brain injured patient and predictors of discharge to rehabilitation. Arch Phys Med Rehabil. 2015;96(2):276–282. doi: 10.1016/j.apmr.2014.09.018 [DOI] [PubMed] [Google Scholar]
- 12.Newhouse JP, Garber AM. Geographic variation in health care spending in the United States: Insights from an Institute of Medicine report. JAMA - J Am Med Assoc. 2013;310(12):1227–1228. doi: 10.1001/jama.2013.278139 [DOI] [PubMed] [Google Scholar]
- 13.Hussey PS, Huckfeldt P, Hirshman S, Mehrotra A. Hospital and regional variation in medicare payment for inpatient episodes of care. JAMA Intern Med. 2015;175(6):1056–1057. doi: 10.1001/jamainternmed.2015.0674 [DOI] [PubMed] [Google Scholar]
- 14.Briasoulis A, Inampudi C, Akintoye E, et al. Regional Variation in Mortality, Major Complications, and Cost After Left Ventricular Assist Device Implantation in the United States (2009 to 2014). Am J Cardiol. 2018;121(12):1575–1580. doi: 10.1016/j.amjcard.2018.02.047 [DOI] [PubMed] [Google Scholar]
- 15.Akintoye E, Briasoulis A, Egbe A, et al. Regional Variation in Mortality, Length of Stay, Cost, and Discharge Disposition Among Patients Admitted for Heart Failure in the United States. Am J Cardiol. 2017;120(5):817–824. doi: 10.1016/j.amjcard.2017.05.058 [DOI] [PubMed] [Google Scholar]
- 16.Truong EI, Stanley SP, DeMario B, et al. Variation in Neurosurgical Intervention for Severe TBI: The Challenge of Measuring Quality in Trauma Center Verification. J Trauma Acute Care Surg Published online 2021. [DOI] [PMC free article] [PubMed] [Google Scholar]
- 17.Greene NH, Kernic MA, Vavilala MS, Rivara FP. Variation in Adult Traumatic Brain Injury Outcomes in the United States. J Head Trauma Rehabil. 2018;33(1):E1–E8. doi: 10.1097/HTR.0000000000000306.Variation [DOI] [PMC free article] [PubMed] [Google Scholar]
- 18.Buntin MB, Garten AD, Paddock S, Saliba D, Totten M, Escarce JJ. How Much Is Postacute Care Use Affected by Its Availability? Health Serv Res. 2005;40(2). doi: 10.1111/j.1475-6773.2005.0i366.x [DOI] [PMC free article] [PubMed] [Google Scholar]
- 19.Xian Y, Thomas L, Liang L, et al. Unexplained Variation for Hospitals’ Use of Inpatient Rehabilitation and Skilled Nursing Facilities After an Acute Ischemic Stroke. Stroke. 2017;48(10). doi: 10.1161/STROKEAHA.117.016904 [DOI] [PubMed] [Google Scholar]
- 20.Census.gov. Population, Population Change, and Estimated Components of Population Change: April 1, 2010 to July 1, 2020 (NST-EST2020-alldata). United States Census Bureau. Published December. Accessed February 13, 2021. https://www.census.gov/programs-surveys/popest/technical-documentation/research/evaluation-estimates.html [Google Scholar]
- 21.SNFDATA. SNF Statistics By State. Published November 18, 2020. Accessed February 13, 2021. https://www.snfdata.com/state_statistics.html [Google Scholar]
- 22.Rahman M, McHugh J, Gozalo PL, Ackerly DC, Mor V. The Contribution of Skilled Nursing Facilities to Hospitals’ Readmission Rate. Health Serv Res. 2017;52(2). doi: 10.1111/1475-6773.12507 [DOI] [PMC free article] [PubMed] [Google Scholar]
- 23.Weerahandi H, Li L, Bao H, et al. Risk of Readmission After Discharge From Skilled Nursing Facilities Following Heart Failure Hospitalization: A Retrospective Cohort Study. J Am Med Dir Assoc. 2019;20(4). doi: 10.1016/j.jamda.2019.01.135 [DOI] [PMC free article] [PubMed] [Google Scholar]
- 24.Ifejika N, Vahidy F, Reeves M, et al. Association between 2010 Medicare Reforms and Utilization of Post-Acute Inpatient Rehabilitation in Ischemic Stroke. Am J Phys Med Rehabil. 2020;Publish Ah. doi: 10.1097/PHM.0000000000001605 [DOI] [PMC free article] [PubMed] [Google Scholar]
- 25.Spearman RC, Stamm BH, Rosen BH, et al. The use of medicaid waivers and their impact on services. J Head Trauma Rehabil. 2001;16(1). doi: 10.1097/00001199-200102000-00007 [DOI] [PubMed] [Google Scholar]
- 26.Santiago CC, Santiago DC, Sebro R. State variation in Medicaid and Medicare reimbursements in musculoskeletal radiology. Clin Imaging. 2020;66. doi: 10.1016/j.clinimag.2020.04.032 [DOI] [PubMed] [Google Scholar]
- 27.Lalezari RM, Pozen A, Dy CJ. State variation in medicaid reimbursements for orthopaedic surgery. J Bone Jt Surg - Am Vol. 2018;100(3). doi: 10.2106/JBJS.17.00279 [DOI] [PubMed] [Google Scholar]
- 28.Kaura AS, Berlin NL, Momoh AO, Kozlow JH. State variations in public payer reimbursement for common plastic surgery procedures. Plast Reconstr Surg. 2018;142(6). doi: 10.1097/PRS.0000000000005013 [DOI] [PubMed] [Google Scholar]
- 29.Peck MD, Pressman MA, Caruso DM, et al. Reimbursement for out-of-state burn patients is not always lower than that for in-state patients at regional burn centers. J Burn Care Res. 2010;31(4). doi: 10.1097/BCR.0b013e3181e4d6dd [DOI] [PubMed] [Google Scholar]
- 30.Casper DS, Schroeder GD, McKenzie J, et al. Medicaid Reimbursement for Common Spine Procedures: Are Compensation Rates Consistent? Spine (Phila Pa 1976). 2019;44(22). doi: 10.1097/BRS.0000000000003241 [DOI] [PubMed] [Google Scholar]
- 31.Werner RM, Konetzka RT, Qi M, Coe NB. The impact of Medicare copayments for skilled nursing facilities on length of stay, outcomes, and costs. Health Serv Res. 2019;54(6). doi: 10.1111/1475-6773.13227 [DOI] [PMC free article] [PubMed] [Google Scholar]
- 32.Werner RM, Coe NB, Qi M, Konetzka RT. Patient Outcomes After Hospital Discharge to Home With Home Health Care vs to a Skilled Nursing Facility. JAMA Intern Med. 2019;179(5). doi: 10.1001/jamainternmed.2018.7998 [DOI] [PMC free article] [PubMed] [Google Scholar]
- 33.Zhu Y, Stearns SC. Post-Acute Care Locations: Hospital Discharge Destination Reports vs Medicare Claims. J Am Geriatr Soc. 2020;68(4). doi: 10.1111/jgs.16308 [DOI] [PubMed] [Google Scholar]
Associated Data
This section collects any data citations, data availability statements, or supplementary materials included in this article.