

Abstract
BACKGROUND & AIMS:
Previous studies have shown an increasing incidence of pancreatic cancer (PC), especially in younger women; however, this has not been externally validated. In addition, there are limited data about contributing factors to this trend. We report age and sex-specific time-trend analysis of PC age-adjusted incidence rates (aIRs) using the National Program of Cancer Registries database without Surveillance Epidemiology and End Results data.
METHODS:
PC aIR, mortality rates, annual percentage change, and average annual percentage change (AAPC) were calculated and assessed for parallelism and identicalness. Age-specific analyses were conducted in older (≥55 years) and younger (<55 years) adults. PC incidence based on demographics, tumor characteristics, and mortality were evaluated in younger adults.
RESULTS:
A total of 454,611 patients were diagnosed with PC between 2001 and 2018 with significantly increasing aIR in women (AAPC = 1.27%) and men (AAPC = 1.14%) without a difference (P = .37). Similar results were seen in older adults. However, in younger adults (53,051 cases; 42.9% women), women experienced a greater increase in aIR than men (AAPCs = 2.36%, P < .001 vs 0.62%, P = 0.62) with nonparallel trends (P < .001) and AAPC difference of 1.74% (P < .001). This AAPC difference appears to be due to rising aIR in Blacks (2.23%; P < .001), adenocarcinoma histopathologic subtype (0.89%; P = .003), and location in the head-of-pancreas (1.64%; P < .001). PC mortality was found to be unchanged in women but decreasing in counterpart men (AAPC difference = 0.54%; P = .001).
CONCLUSION:
Using nationwide data, covering ≈64.5% of the U.S. population, we externally validate a rapidly increasing aIR of PC in younger women. There was a big separation of the incidence trend between women and men aged 15–34 years between 2001 and 2018 (>200% difference), and it did not show slowing down.
Keywords: Pancreatic Cancer, Sex, Epidemiology, Incidence, Mortality
Pancreatic cancer (PC) is a highly fatal disease with a 5-year survival rate of ≈12%,1 accounting for 7% of all cancer-related deaths in 2018.2 Only about 12% of PC cases are diagnosed before metastasis, which contributes to its poor survival.1 Prior data from the Surveillance Epidemiology and End Results (SEER) and the Centers for Disease Control and Prevention (CDC) show an increasing incidence of PC in the United States.3,4 Furthermore, patients with PC suffer from a poor overall quality of life and a worse psychological-related quality of life compared with other cancers.5 In addition, PC has an enormous economic burden on both patients and the health care system.6
PC is generally considered a disease of the elderly with a median age-at-diagnosis of 70 years.1 However, newer data show an emerging trend in the incidence of PC among the younger population7 with variations in demographic-specific subgroups.3,8 Moreover, a recent time-trend analysis revealed an increasing incidence of PC in both older women and men. This study also reports increasing incidence in younger women and men with a higher rate among women.9 However, the data represented a smaller proportion of the U.S. population, and, therefore, the generalizability of these findings is somewhat limited. Furthermore, there appears to be a wide dispersion of the incidence rates reported in the previous study, especially among women aged 15–34 in years 2009 and 2018, which are potential outliers and can thus result in biased findings. The role of race, histopathologic subtype, tumor location, and stage-at-diagnosis in these trends have not been reported in this population. Moreover, the impact of such findings on PC mortality has not been evaluated. Despite the implementation of sex as a biological variable policy by the National Institutes of Health and the growing body of literature showing that sex differences extend beyond hormonal effects,10 there are limited data on sex disparity in PC incidence.
Therefore, the aims of our current study were to externally validate the rising incidence trend of PC in younger women using a SEER-independent database, the CDC’s National Program of Cancer Registries (NPCR).
Our secondary aims were: (1) to investigate the role of demographics and tumor characteristics, such as race, histopathologic subtype, tumor location, and stage-at-diagnosis, on PC incidence in younger adults (<55 years of age) using the NPCR database; and (2) to evaluate the impact of these incidence trends on PC sex-specific mortality trends in younger adults using the CDC’s National Center of Health Statistics (NCHS) database.
Methods
A population-based time-trend analysis of PC incidence rates in the United States from January 1, 2001, through December 31, 2018 was conducted from the NPCR database, and of PC mortality rates in the US during 2000–2019 was conducted from the NCHS database. These are publicly available databases with deidentified data. Based on the recommendations of the National Human Research Protections Advisory Committee, the institutional review board’s policy considers this study exempted from review.
NPCR, SEER, and NCHS databases
The NPCR, established in 1992, is a CDC-based program that collects data from cancer registries in 46 states, the District of Columbia, Puerto Rico, the U.S. Pacific Island Jurisdictions, and the U.S. Virgin Islands.11 The National Cancer Institute’s (NCI) SEER program, established in 1973, collects data from cancer registries in several geographic areas covering multiple states (Figure 1). When combined, the CDC’s NPCR and NCI’s SEER form the United States Cancer Statistics, which covers approximately 100% of the U.S. population.11
Figure 1.
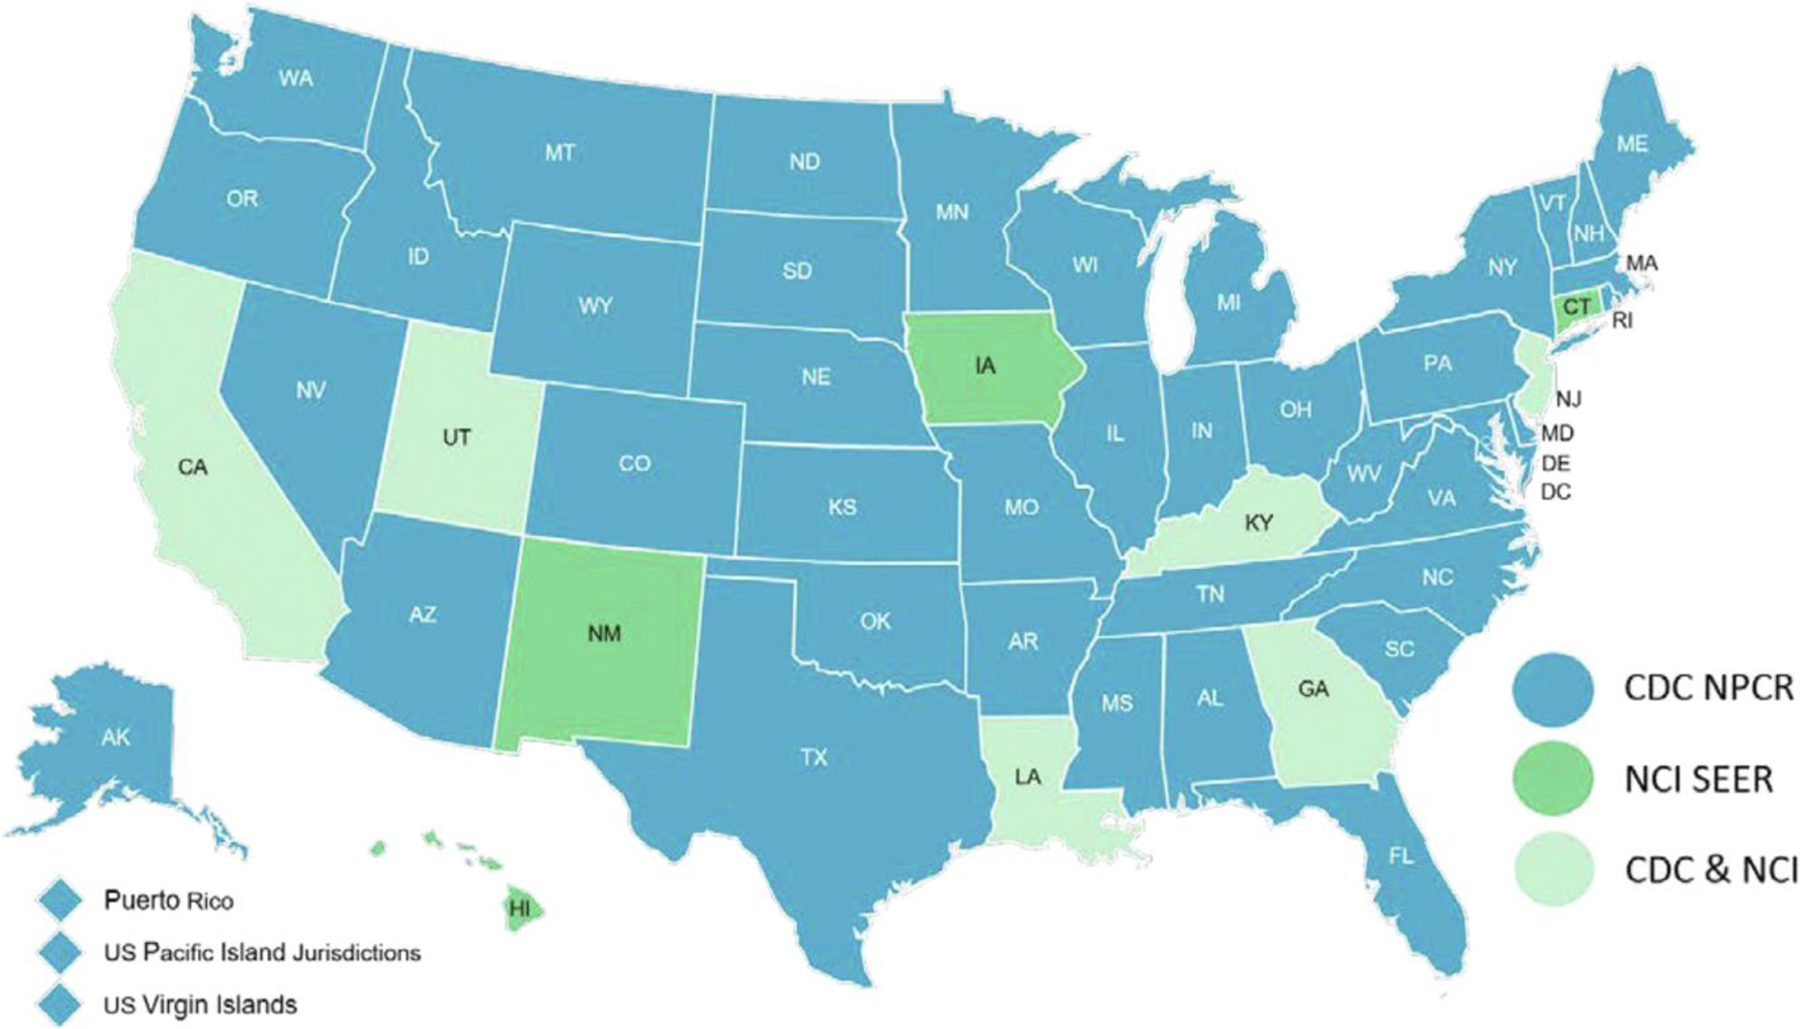
Central Cancer Registry Programs submitting cancer data to the CDC’s NPCR and NCI’s SEER programs in the United States.11 This figure was reproduced from the NPCR-SEER public use database data standards and data dictionary.11
The NCHS is the primary health statistics agency in the United States It provides mortality data of many underlying causes of death, including cancer. Their statistics cover approximately the entire U.S. population.12 Causes of death are encoded from death certificates into the NCHS database.
Data Collection
Medical centers are required by state law to send data on patients diagnosed with cancer to central cancer registries in their respective states. Most of these data are transformed from medical records to registries’ records using free software that are maintained by the CDC to ensure automation, coding, and standardization of data, in compliance with the North American Association of Central Cancer Registries’ Data Standards.13 State cancer registries review the reported cases, extract their deidentified data, and send these data on an annual basis to the CDC’s NPCR and/or the NCI’s SEER program as applicable. Before publication, the NPCR data undergo rigorous quality checks, centralization, and review to ensure its compliance with the United States Cancer Statistics publication-quality criteria, which include checking for data completeness, duplication, and errors.11
The National Vital Statistics System is an intergovernmental system that provides the most comprehensive data on births and deaths from the 57 U.S. vital registration areas across 50 states, 2 cities (Washington, DC, and New York City), and 5 territories (Puerto Rico, the Virgin Islands, Guam, American Samoa, and the Commonwealth of the Northern Mariana Islands). The National Vital Statistics System provides mortality data to the NCHS database. These data are mainly collected using the electronic death registration system that was implemented by the NCHS to improve the timeliness, quality, and consistency of mortality data. This system, NCHS’s mortality medical data system, was developed in 1967 to provide a method to enter, classify, and access causes of death. Data are collected through various mechanisms including death certificates recorded throughout the U.S. territories and national surveys. Several software programs are used to automate the data entry process and specify the cause of death based on the International Classification of Diseases (ICD) and death certificates, while taking into account the World Health Organization rules.14 The data quality is maintained through monitoring survey designs to ensure high-quality data collection, processing, and analysis, while maintaining full confidentiality.
Inclusion and Exclusion Criteria
SEER-excluded NPCR data were used for incidence analysis, and, therefore, all state registries that reported in part or full to SEER during the study period were excluded (Figures 1 and 2). Some states report exclusively to SEER (Connecticut, Hawaii, Iowa, and New Mexico; ≈3.4% of the U.S. population), and others report to both SEER and NPCR (California, Georgia, Kentucky, Louisiana, New Jersey, and Utah; covering 19.9% of the U.S. population).15,16 To definitively obtain data that is independent of SEER, we excluded states that either had portions of their state reporting to SEER (Washington and Alaska; ≈2.4% of the U.S. population) or became part of SEER during the study period (New York, Massachusetts, and Idaho; covering 9.8% of the U.S. population). In summary, the incidence data being considered in this study consist of only those derived from SEER-excluded NPCR states (35 states and Washington, DC; covering 64.5% of the U.S. population). On the other hand, the CDC’s NCHS database was used for mortality analysis in this study, which provides comprehensive mortality data covering 100% of the U.S. population.
Figure 2.
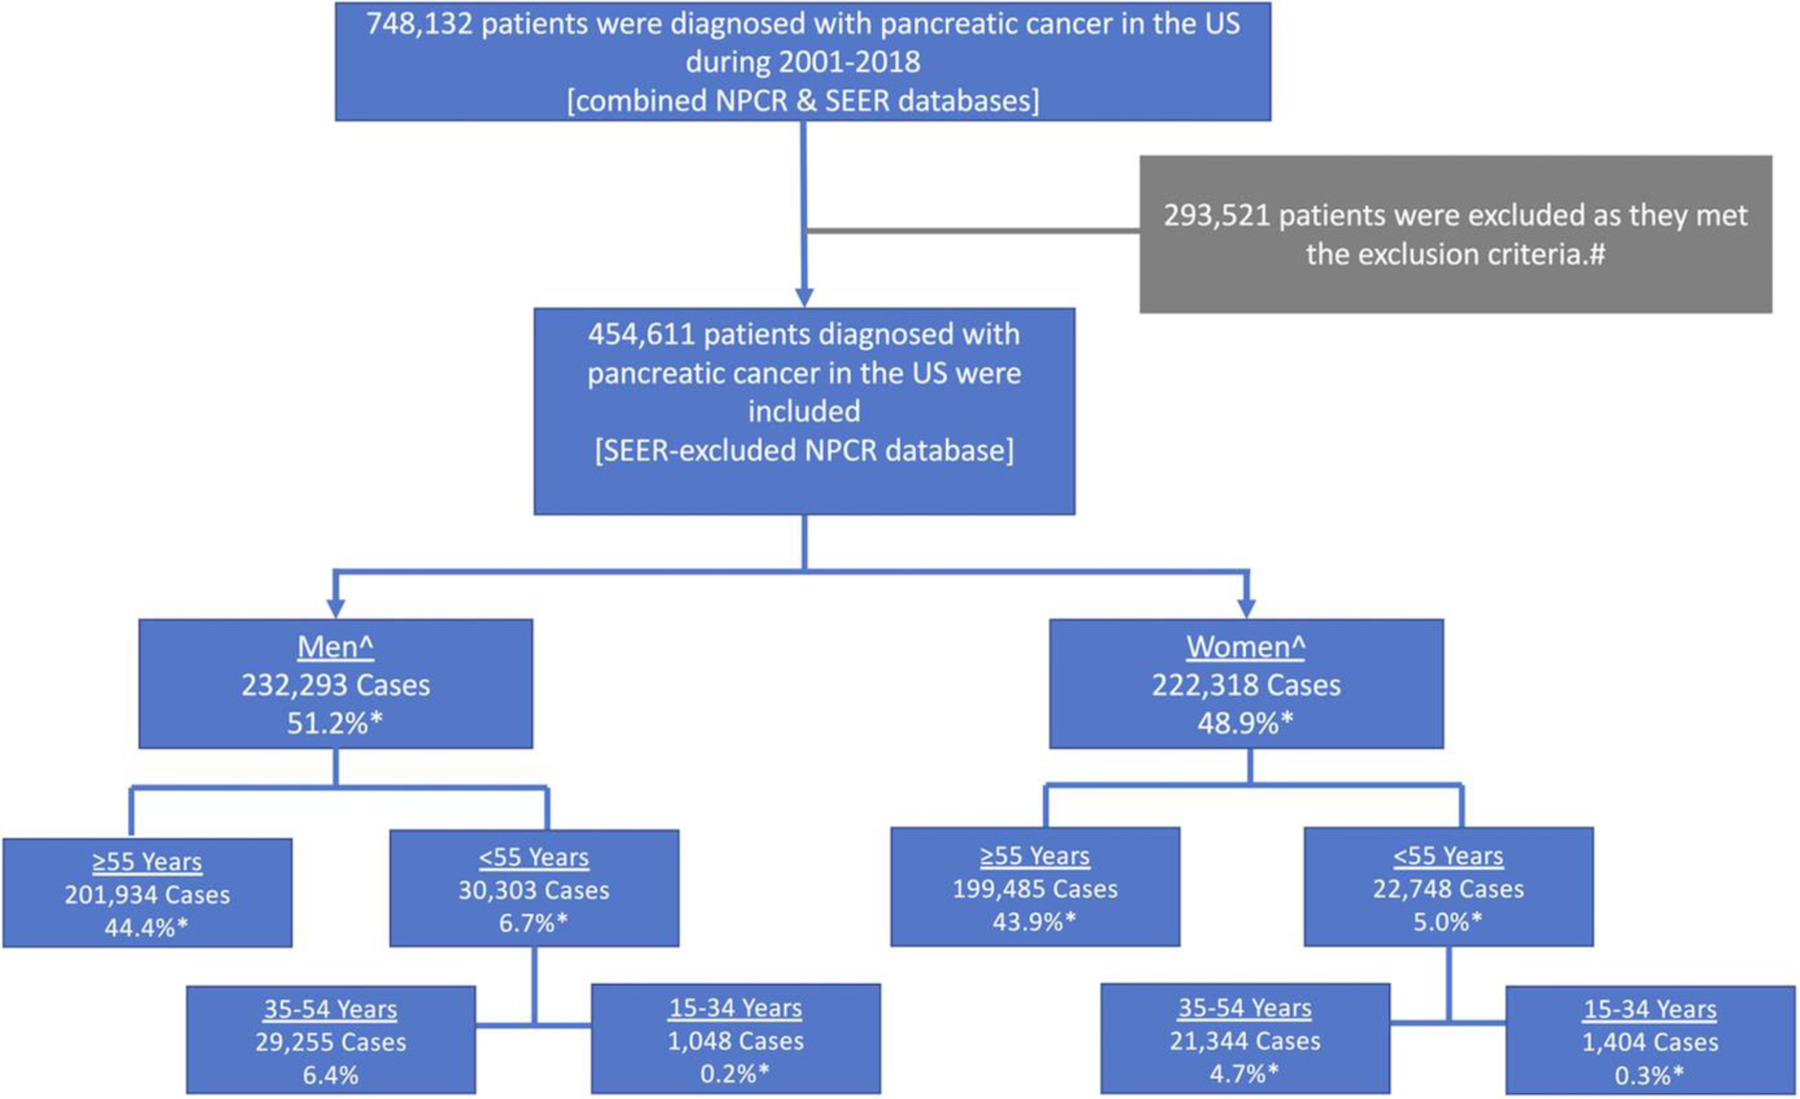
Flow chart showing the inclusion process of patients who were diagnosed with PC in the United States during 2001–2018 using the NPCR database. #These patients were located in a state that contributed in part or full data to the SEER database during the study period. The excluded states were Alaska, California, Connecticut, Georgia, Hawaii, Idaho, Illinois, Iowa, Kentucky, Louisiana, Massachusetts, Michigan, New Jersey, New Mexico, New York, Utah, and Washington. ^Patients aged 0–14 years (85 females and 56 males) were excluded. *Percentage of overall cases.
Definitions
Incidence rate was defined as the number of people diagnosed with PC per 100,000 in a given calendar year. Mortality rate was defined as the number of people whose death was attributed to PC per 100,000 population in a given calendar year. The annual percentage change (APC) was defined as the percentage change in PC incidence or mortality rates between subsequent years, while the average annual percentage change (AAPC) was defined as the mean percentage change per year for the entire period. Increasing and decreasing trends were defined as statistically significant positive and negative values of APC or AAPC, respectively, whereas stable trends were defined as nonsignificant values. The ICD for Oncology, Third Edition “Site Recode ICD-O-3/WHO 2008 classification” with malignant behavior (ie, after excluding in situ neoplasms) was used to specify PC.11,17 The population was subdivided with a cutoff at age 55 into 2 prespecified age groups: older (≥55 years) and younger (<55 years; range, 15–54) adults. A post hoc analysis was conducted after subdividing patients aged 15–54 into 2 equal subgroups: 35–54 and 15–34 years.
Pancreatic ductal adenocarcinoma (PDAC) histopathologic subtype was specified using the following ICD-O-3 codes: 8000, 8001, 8010, 8050, 8140, 8144, 8211, 8230, 8260, 8261, 8262, 8263, 8310, 8481, 8500, 8521, and 8570. The NPCR variable “Primary Site - Labeled” was used to identify tumor location within the pancreas (head of pancreas [HOP]; body and tail of pancreas [BOP/TOP]). Race groups were specified as White, Black, and other, which included American Indian/Alaska Native and Asian or Pacific Islander. Stage-at-diagnosis of the tumors was determined using the NPCR database “Merged Summary Stage” as Localized, Regional, Distant, and Unknown stages. The cause of death record in the NCHS database was specified as malignant cancer of the pancreas.
Statistical Analysis
PC incidence rates per 100,000 population (age-adjusted to the 2000 U.S. population [aIR]) were computed using SEER*Stat software, v8.3.9.2 (NCI), and the analysis was stratified by sex and age. The Shapiro-Wilk test was used to evaluate normality of data distribution using SPSS IBM software v.24.0.18 Time-trends were quantified using the Joinpoint Regression Program, v4.9.0.1 (NCI), which generates best-fit models for a series of data on a logarithmic scale.19 The program uses Monte Carlo permutation analysis to identify the number of joinpoints needed to generate the simplest segmented line that reflects change over time. The APC and AAPC were calculated using parametric estimations with a 2-sided t test to evaluate significance.20,21 Pairwise comparison was performed to assess for parallelism and identicalness.22 The test of parallelism evaluates whether the 2 segmented linear regression mean functions are parallel. This test is performed on the log-transformed scale of the APCs and, subsequently, the results are back-transformed to the original scale in the final output generated by the Joinpoint Regression program. A Taylor series expansion was used to estimate if the absolute difference between the AAPCs was statistically significant. A 2-sided P value <.05 was considered statistically significant for the overall analysis and for the prespecified ≥55 and <55 years age groups. Bonferroni correction was conducted for the post hoc subgroup analyses (P < .025).23 Sensitivity analysis was performed by only including cases with microscopically confirmed PC. Thereafter, sex-specific incidence trends specified by different demographic and tumor characteristics in younger adults were evaluated. Lastly, sex-specific PC mortality rates per 100,000 population (age-adjusted to the 2000 U.S. population) were also computed in younger adults using SEER*Stat software, v8.3.9.2 (NCI), and the aforementioned time-trend analysis was performed on these data.
Results
Primary Aim: PC Incidence
Demographics.
A total of 748,132 patients were diagnosed with PC (Figure 2). After excluding SEER data, 454,611 patients met the inclusion criteria (48.9% women). Further details on the sex- and age-based distribution of the patients are shown in Figure 3. PC aIRs were normally distributed in all subgroups.
Figure 3.
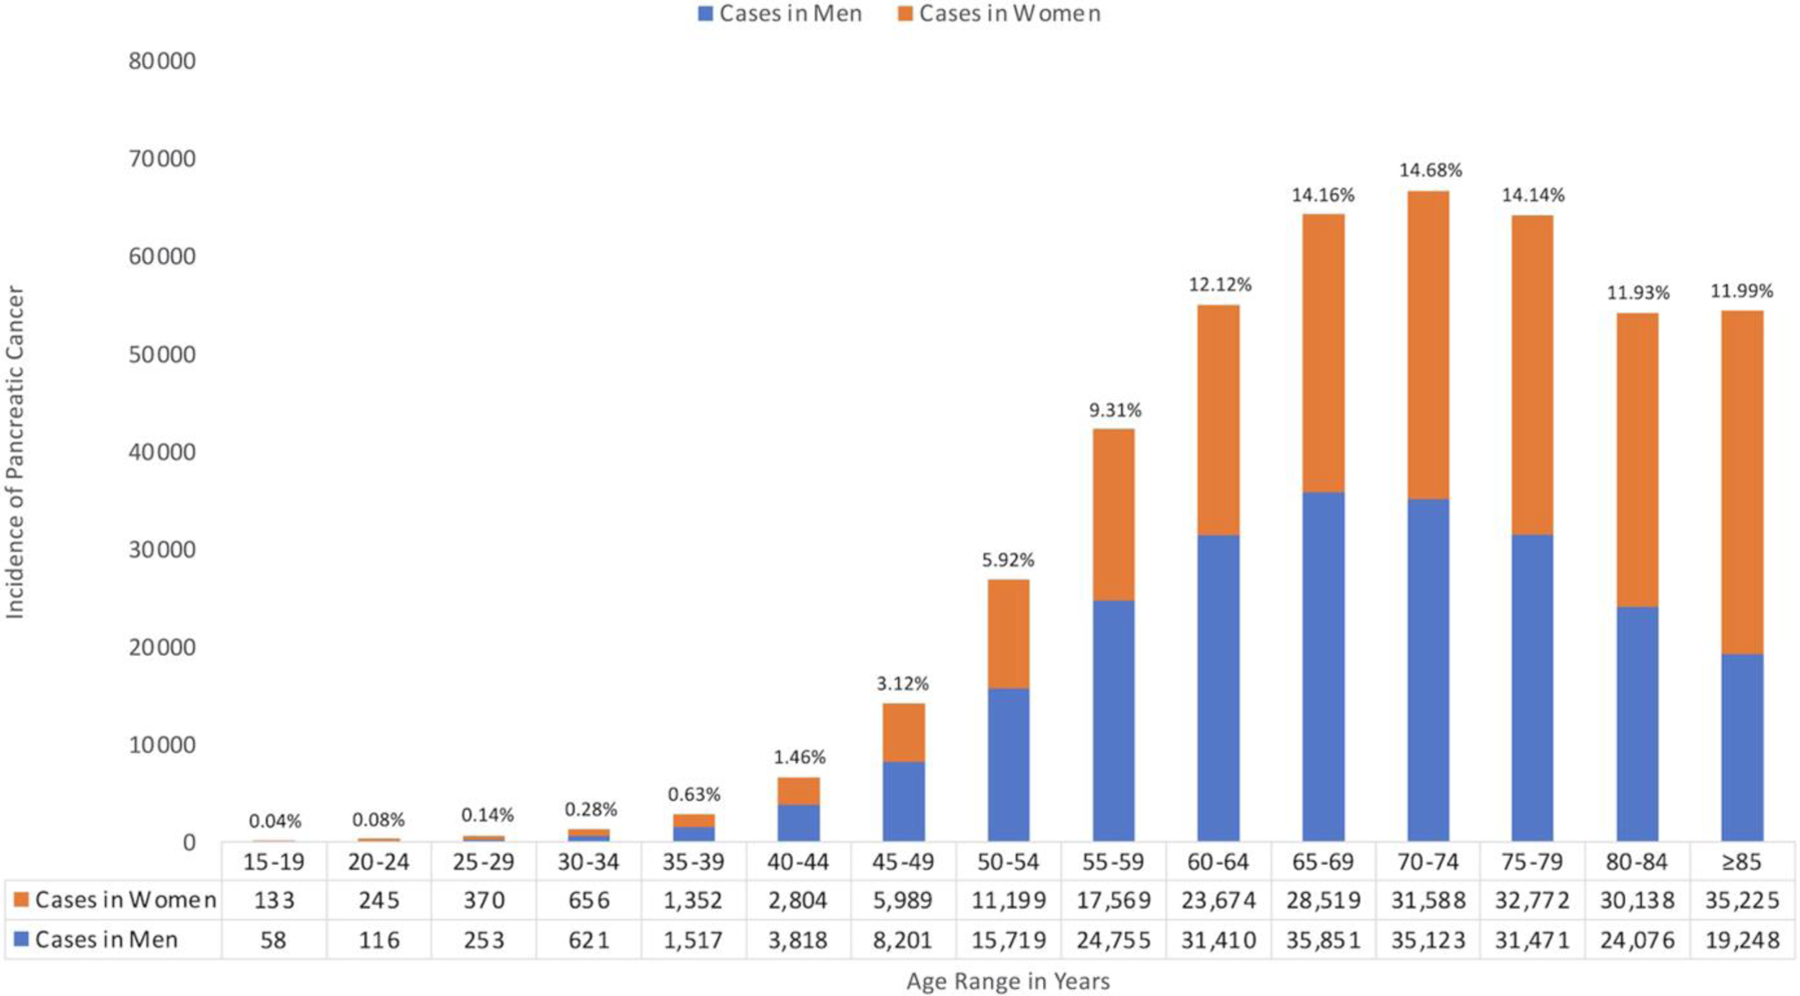
The sex- and age-based distribution of patients diagnosed with PC in the United States during 2001–2018 using the NPCR database. Percentages were calculated with the number of cases among men and women combined for the age subgroup as the numerator, and the overall number of cases as the denominator.
Incidence rates and time-trends.
The overall aIR of PC over the study period was 12.18 per 100,000 (95% confidence interval [CI], 12.14–12.22). Sex-specific incidence rates of PC aIR were 10.69 per 100,000 (95% CI, 10.64–10.73) in women and 13.95 per 100,000 (95% CI, 13.90–14.01) in men. Women had significantly lower aIRs than men (aIRs <1; Supplementary Table 1).
Overall, PC aIRs were significantly increasing (AAPC, 1.17%; 95% CI, 1.04%–1.30%; P < .001). Sex-specific trends were increasing among women (AAPC, 1.27%; 95% CI, 1.00%–1.55%; P < .001) and men (AAPC, 1.14%; 95% CI, 1.00%–1.27%; P < .001) without a significant difference (P = .37) and were parallel (P = .45), suggesting that the aIRs are increasing at a similar rate among both sexes (Table 1).
Table 1.
Sex-Specific Trends for PC Incidence Among Different Age Groups
| Age group (y) | Trendsb |
Sex-specific AAPC difference (95% CI)c | Pairwise comparison P-valuesd |
|||||
|---|---|---|---|---|---|---|---|---|
| Cancer cases (N = 454,611)a | Time period | APC (95% CI) | AAPC (95% CI) | Sex-specific AAPC difference | Coincidencee | Parallelismf | ||
| All ages | ||||||||
| Women | 222,318 (48.9%) | 2001–2006 | 2.03 (1.14–2.94) | 1.27 (1.00–1.55) | −0.14 (−0.43 to 0.16) | .37 | <.001 | .45 |
| 2006–2018 | 0.96 (0.75–1.16) | |||||||
| Men | 232,318 (51.1%) | 2001–2018 | 1.14 (1.00–1.27) | 1.14 (1.00–1.27) | ||||
| Age 55 | ||||||||
| Women | 199,485 (43.9%) | 2001–2006 | 1.94 (1.06–2.83) | 1.11 (0.84–1.37) | 0.07 (−0.22 to 0.36) | .65 | <.001 | .008 |
| 2006–2018 | 0.76 (0.56–0.96) | |||||||
| Men | 201,934 (44.4%) | 2001–2018 | 1.17 (1.05–1.30) | 1.17 (1.05–1.30) | ||||
| Age <55g | ||||||||
| Women | 22,748 (5.0%) | 2001–2018 | 2.36 (1.97–2.75) | 2.36 (1.97–2.75) | −1.74 (−2.43 to −1.04) | <.001 | <.001 | <.001 |
| Men | 30,303 (6.7%) | 2001–2016 | 1.10 (0.87–1.33) | 0.62 (0.03–1.22) | ||||
| 2016–2018 | −2.87 (−7.83 to 2.37) | |||||||
| Age 35–54 | ||||||||
| Women | 21,344 (4.7%) | 2001–2018 | 2.09 (1.69–2.50) | 2.09 (1.69–2.50) | −1.55 (−2.24 to −0.86) | <.001 | <.001 | <.001 |
| Men | 29,255 (6.4%) | 2001–2016 | 1.03 (0.80–1.25) | 0.54 (−0.04 to 1.12) | ||||
| 2016–2018 | −3.05 (−7.90 to 2.07) | |||||||
| Age 15–34 | ||||||||
| Women | 1404 (0.3%) | 2001–2018 | 6.45 (5.36–7.55) | 6.45 (5.36–7.55) | −3.48 (−5.05 to −1.92) | <.001 | <.001 | .014 |
| Men | 1048 (0.2%) | 2001–2018 | 2.97 (1.69–4.27) | 2.97 (1.69–4.27) | ||||
Data are presented as count numbers followed by percentages of the count numbers from the total cases of cancer in the database.
Time-trends were computed using Joinpoint Regression Program (v.4.9.0.1) with 3 maximum joinpoints allowed (4 line segments).
A negative value indicates a greater AAPC in women compared with men.
Multiple testing correction was applied with P-value cutoffs at .05 for all ages and the prespecified, older and younger, subgroups, and at .025 for the post hoc 35–54 and 15–34 age subgroups.
Tests whether sex-specific trends were identical. A significant P-value indicates that the trends were not identical (ie, they had different incidence rates and coincidence was rejected).
Tests whether sex-specific trends were parallel. A significant P-value indicates that the trends were not parallel (parallelism was rejected).
Primary outcome.
Age-specific incidence rates and time-trends.
For age ≥55 years, a total of 401,419 patients (49.7% women) were diagnosed with PC. PC aIRs were significantly increasing (AAPC, 1.11%; 95% CI, 0.98–1.24; P < .001). Sex-specific aIRs were also increasing in women (AAPC, 1.11%; 95% CI, 0.84%–1.37%; P < .001) and men (AAPC, 1.17%; 95% CI, 1.05%–1.30%; P < .001) without a significant difference (P = .65).
For age <55 years, a total of 53,051 patients (42.9% women) were diagnosed with PC. PC aIRs were relatively increasing (AAPC, 1.29%; 95% CI, 0.63%–1.96%; P < .001). However, sex-specific trends were reversed compared with the older population. The aIRs were relatively increasing faster in women (AAPC, 2.36%; 95% CI, 1.97%–2.75%; P < .001) compared with men (AAPC, 0.62%; 95% CI, 0.03%–1.22%; P = .03) with an absolute significant difference of 1.74% (95% CI, −2.43% to −1.04%; P < .001). Sex-specific trends were neither identical (P < 0.001) nor parallel (P < .001), suggesting that the aIRs among women are different and increasing at a greater rate than men (Figure 4).
Figure 4.
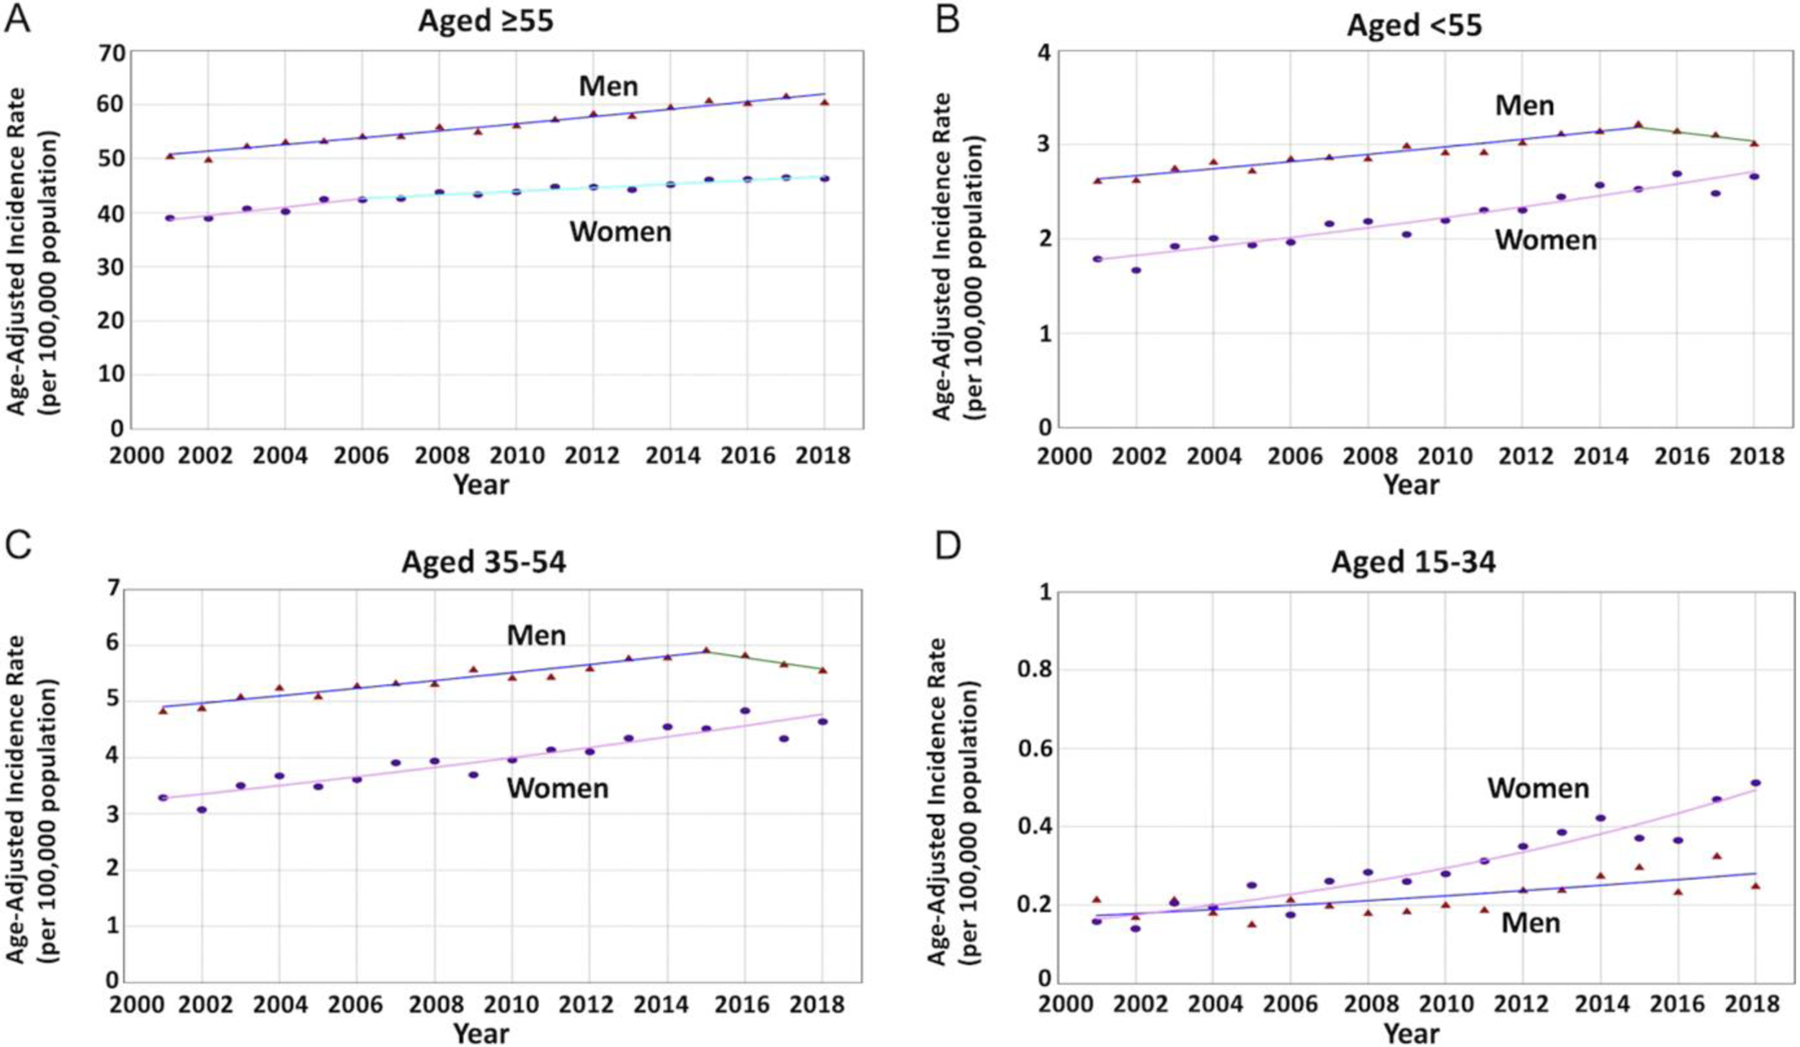
Sex-specific trends and aIRs per 100,000 population for PC among different age groups. (Triangle) Incidence rate in men. (Circle) Incidence rate in women. (A) The AAPC was increasing in women and men without a statistically significant difference (1.11 vs 1.17; P = .65) among patients aged 55 years or older. (B) The AAPC was relatively increasing at a greater rate in women when compared with men (2.36 vs 0.62; P < .001) with nonparallel trends (P < .001) among patients younger than 55 years. (C) The AAPC was relatively increasing at a greater rate in women when compared with the stable trend in men (2.09 vs 0.54; P < .001) with nonparallel trends (P < .001) among patients aged 35–54 years. (D) The AAPC was relatively increasing at a much greater rate in women when compared with men (6.45 vs 2.97; P < .001) with nonparallel trends (P = .014) among patients aged 35–54 years.
For age 35–54, a total of 50,599 patients (42.2% women) were diagnosed with PC. PC aIRs were relatively increasing for the subgroup (AAPC, 1.10%; 95% CI, 0.46%–1.74%; P < .001). Sex-specific aIRs were relatively increasing among women (AAPC, 2.09%; 95% CI, 1.69%–2.50%; P < .001) but stable among men (AAPC, 0.54%; 95% CI, −0.04% to 1.12%; P = .06) with an absolute significant difference of 1.55% (95% CI, −2.24% to −0.86%; P < .001), and nonparallel trends (P < .001), suggesting that aIRs among women are different and relatively increasing at a greater rate than men.
For age 15–34, a total of 2452 patients (57.3% women) were diagnosed with PC. PC aIRs were relatively increasing (AAPC, 4.93%; 95% CI, 4.14%–5.73%; P < .001). Sex-specific aIRs were also relatively increasing in women (AAPC, 6.45%; 95% CI, 5.36%–7.55%; P < .001) and men (AAPC, 2.97%; 95% CI, 1.69%–4.27%; P < .001) with an absolute significant difference of 3.48% (95% CI, −5.05% to −1.92%; P < .001) and nonparallel trends (P = .014), suggesting that the aIRs among young women are different and relatively increasing at a greater rate compared with young men.
Sensitivity analysis.
Further sensitivity analyses were performed in younger adults by choosing different cutoffs at ages 50 and 60 and they showed similar trends with a greater increase in younger women compared with counterpart men (data not shown). Joinpoint segmental analysis of the aIRs over time periods can be found in Table 1. Sensitivity analysis was performed using only microscopically confirmed cases and showed similar trends to the aforementioned analyses (Supplementary Table 2 and Supplementary Figure 1).
Secondary Aim I: PC Incidence in Younger Adults Based on Different Demographics and Tumor Characteristics
Incidence rates and time-trends based on demographics in younger adults (age <55 years).
Although people of White race experienced increasing PC aIRs in women at a greater rate compared with men (41,686 cases; 41.87% women; AAPC difference, 1.59%), a more dramatic increase was seen in women of Black race compared with counterpart men (9498 cases; 46.60% women; AAPC difference, 2.23%; Figure 5 and Supplementary Table 3). However, sex-specific trends in people of other races were parallel (P = .16).
Figure 5.
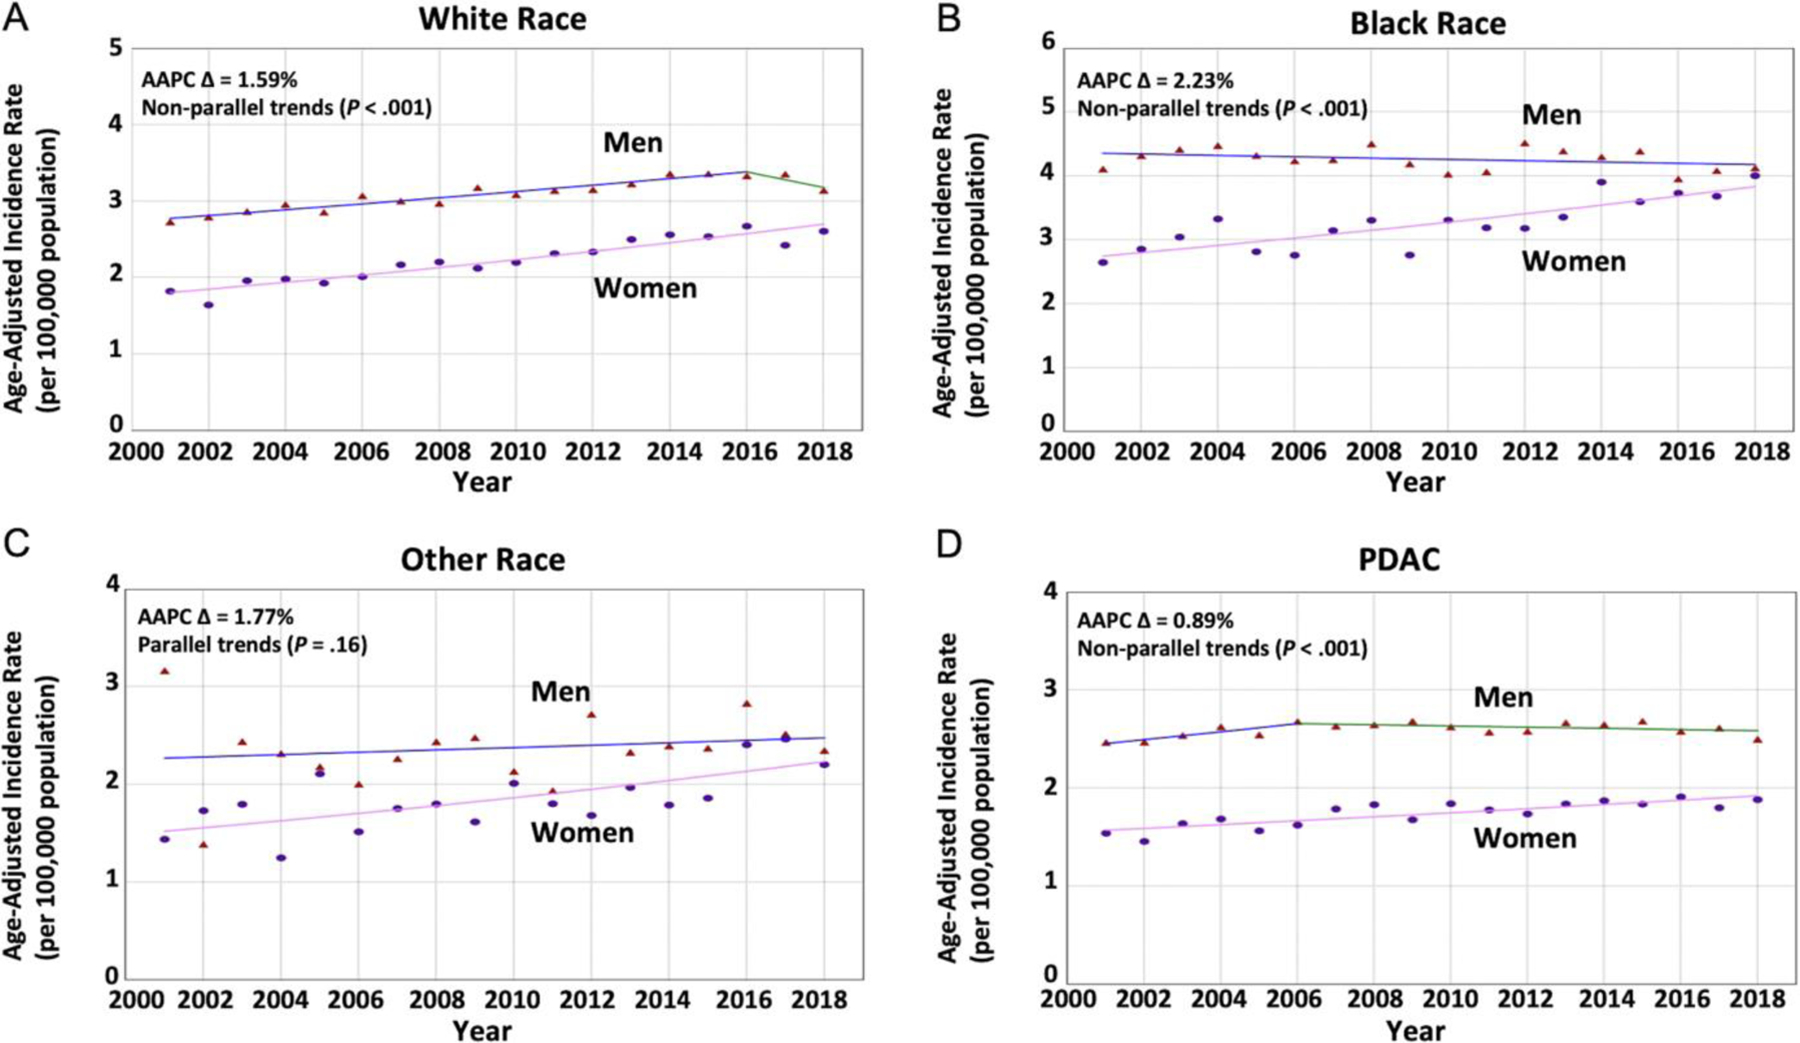
Sex-specific trends for PC incidence based on race and histopathologic subgroup in younger adults. (Triangle) Incidence rate in men. (Circle) Incidence rate in women. (A) The AAPC was relatively increasing at a greater rate in women when compared with men (2.93 vs 0.80; P < .001) with nonparallel trends (P < .001) among patients of White race. (B) The AAPC was relatively increasing at a greater rate in women when compared with men (1.98 vs −0.24; P < .001) with nonparallel trends (P < .001) among patients of Black race. (C) The AAPC was increasing in women and men (2.28 vs 0.51; P = .04) with parallel trends (P = .16) among patients of other races. (D) The AAPC was relatively increasing at a greater rate in women when compared with men (1.19 vs 0.31; P = .003) with nonparallel trends (P < .001) among patients diagnosed with PDAC histopatholgic subtype.
Incidence rates and time-trends based on tumor characteristics in younger adults (age <55 years).
When evaluating PDAC tumors, a total of 41,619 patients were diagnosed with PC (40.8% women), and sex-specific time-trends mirrored the previous analysis of all histopathologic subtypes combined (AAPC difference, 0.89%; Figure 5D). The analysis per tumor location showed a greater increase in PC aIRs in women compared with men for tumors located at the HOP (22,972 cases; 42.33% women) and BOP/TOP (14,766 cases; 45.18% women), and the AAPC difference seemed to be greater for HOP tumors (1.64% vs 1.35%). When evaluating tumors based on their stage-at-diagnosis, the AAPC difference was nonsignificant in all subgroups. However, sex-specific trends were nonparallel in tumors diagnosed at localized stages, suggesting that aIRs in women may be increasing at a greater rate compared with counterpart men (AAPC difference, 1.64%; Figure 6, Supplementary Table 3, and Supplementary Figure 2).
Figure 6.
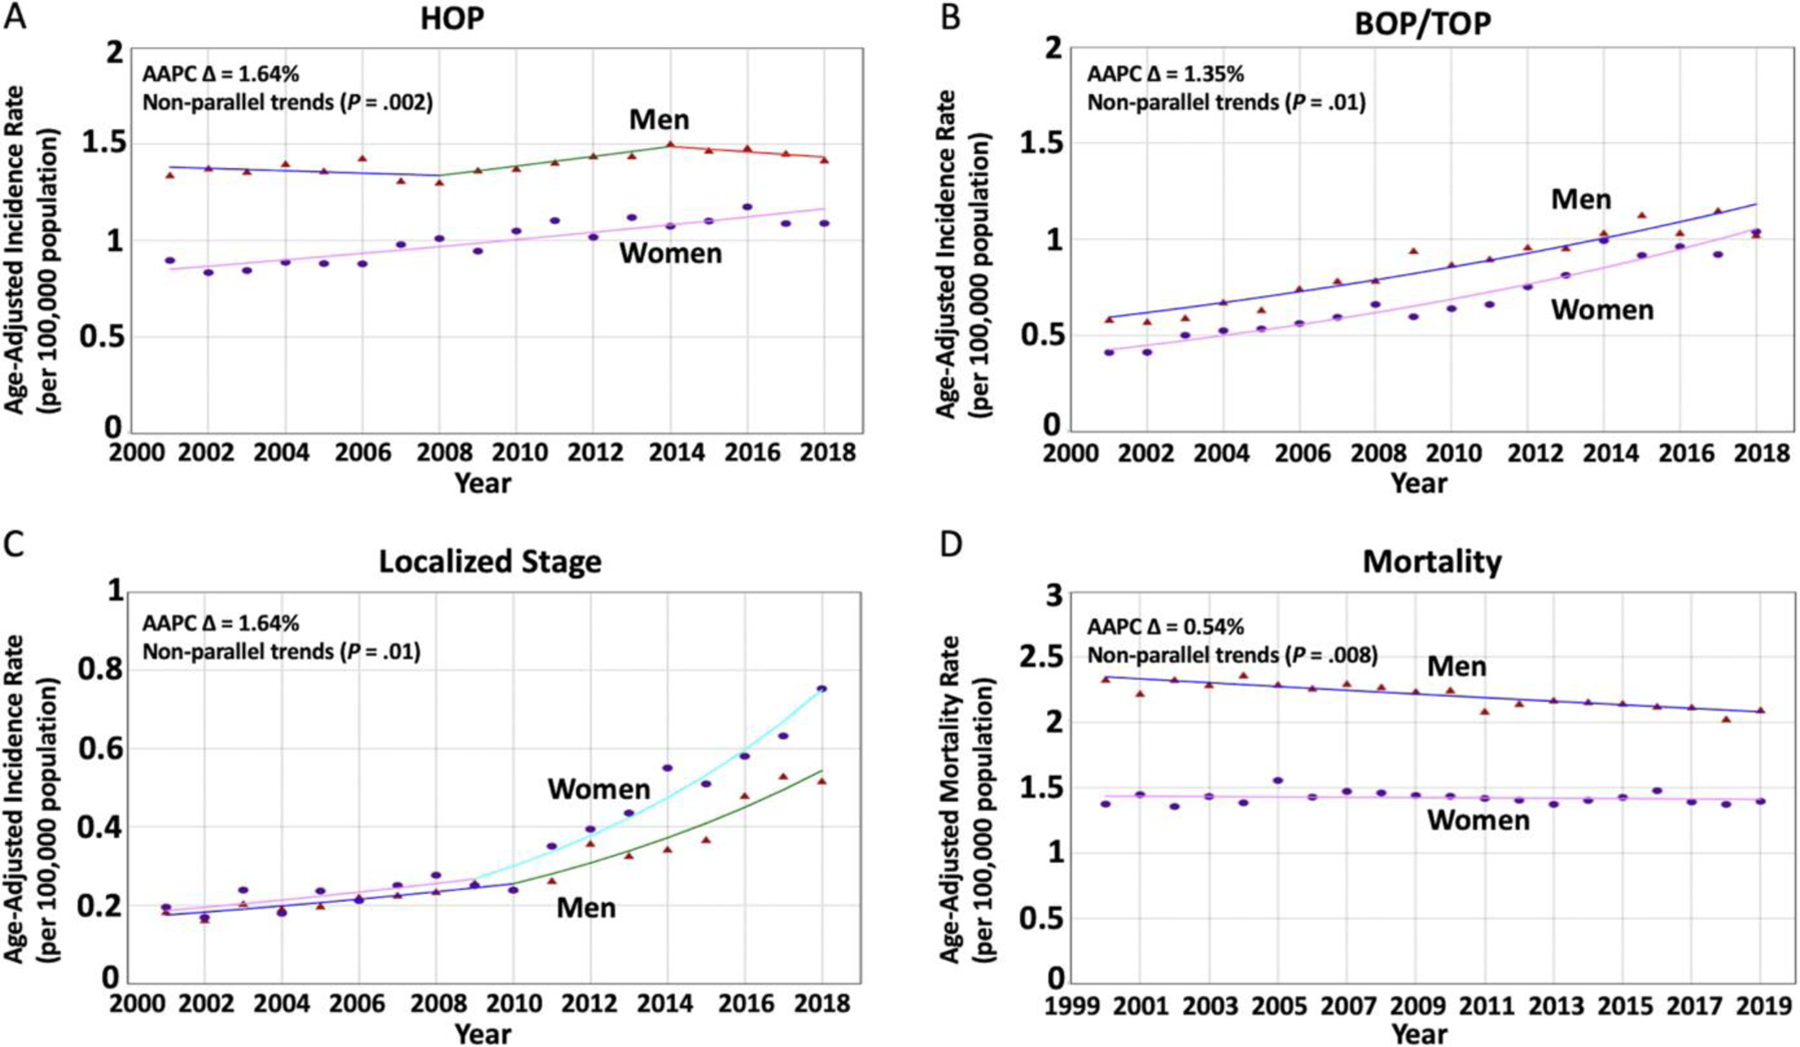
Sex-specific trends for PC incidence based on tumor location and stage-at-diagnosis and sex-specific mortality trends in younger adults. (Triangle) Incidence rate in men. (Circle) Incidence rate in women. (A) The AAPC was relatively increasing at a greater rate in women when compared with men (1.86 vs 0.22; P < .001) with nonparallel trends (P = .002) among patients diagnosed with tumors at the HOP. (B) The AAPC was relatively increasing at a greater rate in women when compared with men (5.47 vs 4.12; P = .006) with nonparallel trends (P = .01) among patients diagnosed with tumors at the BOP or TOP. (C) The AAPC seemed to be relatively increasing at a greater rate in women when compared with men (8.52 vs 6.89; P = .29) with nonparallel trends (P = .01) among patients diagnosed with tumors at a localized stage. (D) Mortality rates were decreasing in men but not in women (AAPC, −0.64 vs −0.09; P = .001) with nonparallel trends (P = .008).
Secondary Aim II: PC Mortality Rates in Younger Adults (Age <55 Years)
A total of 64,239 patients died due to PC (39.3% women). PC mortality rates were unchanged in women (AAPC, −0.09%; P = .48), but decreasing in men (AAPC, −0.64%; P < .001) with an absolute significant AAPC difference of 0.54% (P = .001). Sex-specific trends were neither identical (P < .001) nor parallel (P = .008), suggesting that PC mortality rates in younger men are different and decreasing at a greater rate than the stable trend in younger women (Figure 6D and Supplementary Table 3).
Discussion
The current study shows that overall PC aIRs have been increasing in the United States between 2001 and 2018. We also demonstrate that aIRs were relatively increasing in younger women (<55 years) at a greater rate compared with younger men, and this was more pronounced in the younger subgroup (women aged 15–34 years). Further analyses in younger adults showed that White women experienced a greater increase than counterpart men, but a more dramatic difference between women and men was seen in people of Black race. Moreover, PDAC histopathologic subtype, HOP tumors, and tumors diagnosed at an early stage seemed to be contributing to the increasing trend in younger women. Lastly, our analysis of nationwide mortality data revealed that PC mortality is improving in younger men but not in younger women over the last 2 decades.
Descriptive epidemiologic studies can inform health policies in identifying the population at risk, formulating hypotheses, and guiding future research.24 In this article, we evaluated temporal changes of PC incidence in younger women in a nationwide database, independent from SEER, and validated previous findings.9 However, there were a few differences between the 2 studies. There was no significant difference between the sex-specific trends of the older population in the current study, although the previous study showed that there were significantly greater incidence trends in older men compared with women. Another difference is that joinpoints were seen in several subgroups, which implies significant differences in the rate PC incidence is changing at the year of the joinpoint. This can be due to the larger sample size in the current analysis (SEER-excluded NPCR, 454,611 vs SEER, 283,817) because there is a higher possibility of the regression models detecting joinpoints in large sample sizes.25 Additionally, whereas PC aIRs in women aged 15–34 in the current analysis were found to be normally distributed (P = .70), aIRs in women aged 15–34 in the previous study were not (P = .03). This is likely due to the greater number of women aged 15–34 (SEER-exclusive NPCR, 1404 vs SEER, 896). Finally, unlike the previous study, we performed a sensitivity analysis only in those with microscopically confirmed PC. In addition, we investigated PC trends specified by different demographics and tumor characteristics in younger adults, and, finally, we evaluated PC mortality in this population. In summary, the current study used a larger sample size, a more convincing endpoint of microscopically confirmed PC, and a more comprehensive approach to investigating such findings and their impact on mortality, thus providing firm evidence of increasing PC incidence in younger women.
There are limited data on sex disparity in PC incidence.10 Gordon-Dseagu et al3 analyzed the SEER 13 database (1992–2014), 66,537 PC cases, and found increasing trends among different subgroups stratified by age and race. Moreover, Saad et al8 analyzed the SEER 9 database, 67,878 PC cases, and showed an overall increase in incidence between 1999 and 2014. However, these studies are limited by older data, relatively smaller sample sizes, and lack of sex-specific comparative analysis. Moreover, the SEER registry suffers from several limitations such as the variations in data reporting across the registries and the potential relocation of patients in and out of SEER geographic areas.26 These aforementioned limitations prompted us to investigate sex- and age-specific aIRs of PC in a large national database, independent of SEER. The findings of our current study appear to be nearly identical to those of the recent SEER publication (Supplementary Figure 3), thus independently validating them.
Given that the reproducibility of any experiment is the cornerstone of research, external validation of the data is crucial for the scientific appraisal of the findings before implementing any interventions or health policies.27 Despite its importance, there is a reproducibility crisis in the literature. A survey by Nature involving 1576 researchers showed that >70% of them failed to reproduce other scientists’ studies, and >50% could not reproduce their own work.28 Therefore, by externally validating the findings of the previous SEER study in an independent database, we hope to enhance the generalizability and reproducibility of the previous findings, thereby substantiating the evidence of increasing PC incidence rates among younger women in the United States.
Although previous data showed modifiable risk factors for PC such as body mass index and smoking,29,30 there are limited data on sex-specific risk factors. A pooled analysis of 2170 patients with PC from the National Cancer Institute Pancreatic Cancer Cohort Consortium showed that central fat distribution was associated with increased risk of PC only in women (odds ratio, 1.87).30 Furthermore, an analysis of a prospective cohort of 28,098 individuals from the Malmo Diet and Cancer Study showed that regular smoking was associated with increased risk of PC in women (hazard ratio [HR], 2.62) and men (HR, 3.57).31 However, occasional (HR, 3.29) and passive smoking for >20 years (HR, 2.01) were associated with increased risk only in women. Moreover, other large national analyses showed sex-dependent differences in PC risk factors,32 preventive factors,33 and hormonal levels.34 Lastly, this increase in incidence can also be the result of ongoing improvements in diagnostic modalities and sex-specific disproportional health care use.35
Although previous studies did not show major differences in most PC risk factors between the younger and older populations, genetic-related risk factors were noted to be more common in the young.36 Alcohol consumption was found to be associated with a higher risk of PC among the younger population37, with a meta-analysis showing significant increase in alcohol consumption in women born in the late 1990s.38 This may play a role in increasing PC incidence in younger women during the last 2 decades. Additionally, smoking was noted to significantly increase the risk of PC in the young (<50 years),39 with recent national data showing a significant increase in smoking initiation in early adulthood (18–23 years).40 This temporal change in smoking patterns may be disproportionately driven by women. A meta-analysis of 22 studies showed that parity was inversely associated with PC risk.41 The decrease in fertility rates in the United States during the last decade can potentially lead to a disproportionate increase in incidence rates of PC in younger women.42 Our sensitivity analyses revealed an increase in PC aIRs among women compared with men with a cutoff at 50 and 60 years of age as well, suggesting that these trends are unlikely to be merely due to early diagnosis and could be due to environmental exposure or new risk factors in the last 50–60 years that disproportionately affect women. Future studies should perform an age-period-cohort analysis to evaluate this further. Ideally, all aforementioned variables, stratified by age and sex, will need to be studied to elucidate independent risk factors for PC in younger women. Given that screening is unlikely to be beneficial or cost-effective, the identification of any preventable risk factors may provide insight into the pathogenesis of PC, which may be the first step into stemming the rise of this disease in younger women.
Investigating mortality trends helps to evaluate the efficacy of new health care interventions allows for an ongoing assessment of disparities in health care use and access between different populations, and can also reflect recent changes in incidence trends. This can inform public health policies to address inequalities in health care access. Moreover, evaluating mortality data can help in minimizing detection bias that may arise when evaluating incidence data. This may result from potential disproportionate monitoring of the disease between different populations and can increase the probability of identifying the disease sooner. This can lead to overdiagnosing early-stage PC in younger women. In addition, detection bias can also occur due to the different methods used in reporting the incidence.43 Therefore, to reduce the chance of detection bias in our analysis, we evaluated PC mortality, and PC aIRs using only microscopically confirmed data, which revealed similar findings to the initial analysis that included all modalities of diagnosing PC. To the best of our knowledge, this is the first study to address the impact of the increasing PC incidence in younger women on its mortality rates. A few studies have evaluated PC mortality rates and trends. Saad et al,8 for instance, found that mortality rates of PDAC in the United States increased from 1973 through 2012 and subsequently decreased until 2014.7 However, their study was limited in that the SEER 9 database was used, which has a total of 63,426 patient deaths from PDAC. This is significantly less comprehensive than our current study, which analyzed the CDC’s NCHS database that is designed to report nearly every death attributed to PC in the United States with 734,761 records. Moreover, they did not evaluate sex-specific PC mortality trends in younger adults. Our analysis of PC incidence based on the stage-at-diagnosis of the tumors suggests that younger women are experiencing a greater increase in the incidence of tumors diagnosed at a localized stage compared with men. Given that tumors diagnosed at an early stage have better outcomes, this may explain the nonincreasing mortality trend in younger women, compared with the decreasing mortality trend in younger men. Furthermore, mortality trends can lag behind incidence trends by a few years to reflect recent changes in incidence. Another potential explanation of the disparity between incidence and mortality trends is that the data are not linked and were obtained from 2 different databases. However, these are the most comprehensive cancer statistics databases in the United States. Future studies should investigate PC mortality rates in younger adults.
Some of the strengths of the current study include the large sample size (64.5% of the U.S. population for incidence, and 100% of the U.S. population for mortality)11 and the use of Joinpoint regression.24 Furthermore, unlike the previous study, incidence rates among women aged 15–34 in the current analysis were normally distributed, and we explored incidence trends in younger adults based on different demographics and tumor characteristics. To externally validate the previous SEER findings in an independent database, we meticulously excluded all states that report either in part or full to SEER. Although this has resulted in the loss of some NPCR records in the excluded states that report in part to NPCR, we decided to exclude those states to reduce the likelihood of any SEER data influence on our current study. However, the current analysis has some limitations. First, loss of records and coding reliability are limitations that were reported in the SEER database, and these limitations can also be implied to the NPCR database.26 Second, the unavailability of many variables prevented us from identifying possible risk factors of cancer incidence. Third, the NPCR database does not provide data about the granularity of the histopathologically confirmed cases (ie, lineage and origin). Fourth, despite evaluating PC aIRs in only microscopically confirmed cases, and assessing PC mortality as well, detection bias can be an issue. Fifth, to limit the interaction between the variables in our study, we performed subgroup analyses based on age and sex to study them individually. However, despite our best efforts, interaction is still a possibility. Last, despite our exclusion of SEER data from the NPCR, an overlap between the 2 is still possible. Given that the reported coverage of the NPCR database in the current paper is 64.5% of the U.S. population, whereas SEER 21 represents 36.7%, there is potential overlap of 1.2%. However, we believe this is a small number of cases and is less likely to have a significant effect on the analysis.
Conclusion
Using large national cancer registry data, SEER-excluded NPCR (covering 64.5% of the U.S. population), we validate PC aIRs have been increasing at a greater rate in younger women compared with younger men. The greatest increase in PC trends in younger women was noted in Blacks, and with tumor location in the head. These women tend to present with PDAC at a localized stage of tumor. Although PC mortality trends are improving in men, the same is not true for women. The exact cause of the trend among younger women is unclear and may be driven by sex-based disproportional exposure or response to known or yet-to-be explored risk factors. Future efforts should aim to elucidate the causes of such a trend with the goal to formulate possible preventive measures.
Supplementary Material
WHAT YOU NEED TO KNOW.
BACKGROUND AND CONTEXT
Although previous studies showed an increasing incidence of pancreatic cancer in the United States, there are limited nationwide representative data on its incidence in younger women.
NEW FINDINGS
Using data from the National Program of Cancer Registries database (covering ≈64.5% of the U.S. population), we show that pancreatic cancer incidence is increasing in younger women compared with men.
LIMITATIONS
Limitations are lack of data on risk factors and data reliability issues related to cancer registries.
CLINICAL RESEARCH RELEVANCE
Our research reveals a notable increase in the occurrence of pancreatic cancer among younger women, particularly among those of Black race. Furthermore, a significant proportion of these cases involve tumors situated in the head of pancreas, and are localized at the time-of-diagnosis. In light of these findings, it is imperative that further studies are conducted to shed light on the risk factors driving this trend, with the ultimate aim of devising preventive strategies and improving outcomes.
BASIC RESEARCH RELEVANCE
Our comprehensive nationwide study, which encompasses a vast majority of the U.S. population, presents epidemiologic data that highlight a significant and escalating trend of pancreatic cancer incidence rates among younger women. We aim to guide future research toward a deeper understanding of the histopathologic characteristics of tumors in younger women diagnosed with pancreatic cancer and their response to treatment
Acknowledgments
The authors would like to thank Dr Shelly Lu (Karsh Division of Gastroenterology and Hepatology, Cedars-Sinai Medical Center, Los Angeles, California) for her mentorship, guidance, and support in all stages of this study.
Funding
This project was supported in part by a philanthropic grant by The Widjaja Family Fund for Pancreatic Cancer Research. The funding agency did not have any role in the design and conduct of the study; collection, management, analysis, and interpretation of the data; preparation, review, or approval of the manuscript; and decision to submit the manuscript for publication.
Abbreviations used in this paper:
- AAPC
average annual percentage change
- aIR
age-adjusted incidence rate
- APC
annual percentage change
- BOP
body of pancreas
- CDC
Centers for Disease Control and Prevention
- CI
confidence interval
- HOP
head of pancreas
- HR
hazard ratio
- ICD
International Classification of Diseases
- NCHS
National Center of Health Statistics
- NCI
National Cancer Institute
- NPCR
National Program of Cancer Registries
- PC
pancreatic cancer
- PDAC
pancreatic ductal adenocarcinoma
- SEER
Surveillance; Epidemiology, and End Results
- TOP
tail of pancreas
Footnotes
CRediT Authorship Contributions
Yazan Abboud, MD (Conceptualization: Supporting; Data curation: Lead; Formal analysis: Lead; Methodology: Equal; Validation: Lead; Writing – original draft: Lead). Jamil S. Samaan, MD (Writing – review & editing: Supporting). Janice Oh, MD (Writing – review & editing: Supporting). Yi Jiang, MD (Writing – review & editing: Supporting). Navkiran Randhawa, DO (Writing – review & editing: Supporting). Daniel Lew, MD (Writing – review & editing: Supporting). Jenan Ghaith, MD (Writing – review & editing: Supporting). Pranav Pala, Medical Student (Writing – review & editing: Supporting). ChristineAnn Leyson, DNP (Writing – review & editing: Supporting). Rabindra Watson, MD (Writing – review & editing: Supporting). Quin Liu, MD (Writing – review & editing: Supporting). Kenneth Park, MD (Writing – review & editing: Supporting). Shirley Paski, MD (Writing – review & editing: Supporting). Arsen Osipov, MD (Writing – review & editing: Supporting). Brent K. Larson, MD (Writing – review & editing: Supporting). Andrew Hendifar, MD (Writing – review & editing: Supporting). Katelyn Atkins, MD, PhD (Writing – review & editing: Supporting). Nicholas N. Nissen, MD (Writing – review & editing: Supporting). Debiao Li, PhD (Writing – review & editing: Supporting). Stephen J. Pandol, MD (Writing – review & editing: Supporting). Simon K. Lo, MD (Writing – review & editing: Supporting). Srinivas Gaddam, MD, MPH (Conceptualization: Lead; Funding acquisition: Lead; Investigation: Lead; Methodology: Lead; Supervision: Lead; Writing – review & editing: Lead).
Conflicts of interest
The authors disclose no conflicts.
Supplementary Material
Note: To access the supplementary material accompanying this article, visit the online version of Gastroenterology at www.gastrojournal.org, and at https://doi.org/10.1053/j.gastro.2023.01.022.
References
- 1.NIH National Cancer Institute SEER Program. Cancer Stat Facts: Pancreatic Cancer. Available at: https://seer.cancer.gov/statfacts/html/pancreas.html. Accessed November 6, 2022.
- 2.Siegel RL, Miller KD, Fuchs HE, et al. Cancer Statistics, 2021. CA Cancer J Clin 2021;71:7–33. [DOI] [PubMed] [Google Scholar]
- 3.Gordon-Dseagu VL, Devesa SS, Goggins M, et al. Pancreatic cancer incidence trends: evidence from the Surveillance, Epidemiology and End Results (SEER) population-based data. Int J Epidemiol 2018;47:427–439. [DOI] [PMC free article] [PubMed] [Google Scholar]
- 4.U.S. Cancer Statistics Working Group. U.S. Cancer Statistics. Data Visualizations Tool, based on 2021 submission data (1999–2019): U.S. Department of Health and Human Services, Centers for Disease Control and Prevention and National Cancer Institute. Available at: https://www.cdc.gov/cancer/dataviz. Released November 2022. Accessed November 9, 2022.
- 5.Bauer MR, Bright EE, MacDonald JJ, et al. Quality of life in patients with pancreatic cancer and their caregivers: a systematic review. Pancreas 2018;47:368–375. [DOI] [PubMed] [Google Scholar]
- 6.Malangone-Monaco E, Doleh Y, Cole A, et al. The economic burden of metastatic pancreatic cancer. Pancreatology 2020;20:1434–1441. [DOI] [PubMed] [Google Scholar]
- 7.Sung H, Siegel RL, Rosenberg PS, et al. Emerging cancer trends among young adults in the USA: analysis of a population-based cancer registry. Lancet Public Health 2019;4:e137–e147. [DOI] [PubMed] [Google Scholar]
- 8.Saad AM, Turk T, Al-Husseini MJ, et al. Trends in pancreatic adenocarcinoma incidence and mortality in the United States in the last four decades; a SEER-based study. BMC Cancer 2018;18:688. [DOI] [PMC free article] [PubMed] [Google Scholar]
- 9.Gaddam S, Abboud Y, Oh J, et al. Incidence of pancreatic cancer by age and sex in the US, 2000–2018. JAMA 2021;326:2075–2077. [DOI] [PMC free article] [PubMed] [Google Scholar]
- 10.Clayton JA. Applying the new SABV (sex as a biological variable) policy to research and clinical care. Physiol Behav 2018;187:2–5. [DOI] [PubMed] [Google Scholar]
- 11.United States Department of Health and Human Services, Centers for Disease Control and Prevention and National Cancer Institute. National Program of Cancer Registries and Surveillance Epidemiology and End Results, 2020 Submission (2001–2018). Released June 2021. Available at: www.cdc.gov/cancer/uscs/public-use. Accessed November 9, 2022.
- 12.Surveillance, Epidemiology, and End Results (SEER) Program. Available at: www.seer.cancer.gov. SEER*Stat Database: Mortality - All COD, Aggregated Total U.S. (1990–2019) <Katrina/Rita Population Adjustment>, National Cancer Institute, DCCPS, Surveillance Research Program, released April 2021. Underlying mortality data provided by NCHS. Available at: www.cdc.gov/nchs. Accessed November 9, 2022. [Google Scholar]
- 13.Centers for Disease Control and Prevention. Software and tools for cancer registries and surveillance. Available at: https://www.cdc.gov/cancer/npcr/tools/index.htm. Accessed November 9, 2022.
- 14.Centers for Disease Control and Prevention. NVSS - MMDS - About the Mortality Medical Data System. Available at: https://www.cdc.gov/nchs/nvss/mmds/about_mmds.htm. Published November 6, 2022.
- 15.NIH National Cancer Institute SEER Program. List of SEER Registries - About SEER. Available at: https://seer.cancer.gov/registries/list.html. Accessed November 9, 2021.
- 16.Centers for Disease Control and Prevention. About the Databases. Available at: https://www.cdc.gov/cancer/uscs/public-use/about.htm. Published June 2021.
- 17.Centers for Disease Control and Prevention. U.S. Data Variable Definitions. Available at: https://www.cdc.gov/cancer/uscs/public-use/us/variables.htm. Accessed November 9, 2022.
- 18.Mishra P, Pandey CM, Singh U, et al. Descriptive statistics and normality tests for statistical data. Ann Card Anaesth 2019;22:67–72. [DOI] [PMC free article] [PubMed] [Google Scholar]
- 19.Statistical Research and Applications Branch NCI. Joinpoint Regression Program, Version 4.9.0.0. March 2021. [Google Scholar]
- 20.Clegg LX, Hankey BF, Tiwari R, et al. Estimating average annual per cent change in trend analysis. Stat Med 2009; 28:3670–3682. [DOI] [PMC free article] [PubMed] [Google Scholar]
- 21.NIH National Cancer Institute. Joinpoint Help System. Number of Joinpoints. Available at: https://surveillance.cancer.gov/help/joinpoint/setting-parameters/method-and-parameters-tab/number-of-joinpoints. Accessed November 9, 2022.
- 22.Kim HJ, Fay MP, Yu B, et al. Comparability of segmented line regression models. Biometrics 2004;60:1005–1014. [DOI] [PubMed] [Google Scholar]
- 23.Armstrong RA. When to use the Bonferroni correction. Ophthalmic Physiol Opt 2014;34:502–508. [DOI] [PubMed] [Google Scholar]
- 24.Oliveria SA, Christos PJ, Berwick M. The role of epidemiology in cancer prevention. Proc Soc Exp Biol Med 1997;216:142–150. [DOI] [PubMed] [Google Scholar]
- 25.Zanetti R, Sera F, Sacchetto L, et al. Power analysis to detect time trends on population-based cancer registries data: when size really matters. Eur J Cancer 2015; 51:1082–1090. [DOI] [PubMed] [Google Scholar]
- 26.Park HS, Lloyd S, Decker RH, et al. Limitations and biases of the Surveillance, Epidemiology, and End Results database. Curr Probl Cancer 2012;36:216–224. [DOI] [PubMed] [Google Scholar]
- 27.Ramspek CL, Jager KJ, Dekker FW, et al. External validation of prognostic models: what, why, how, when and where? Clin Kidney J 2021;14:49–58. [DOI] [PMC free article] [PubMed] [Google Scholar]
- 28.Baker M 1,500 scientists lift the lid on reproducibility. Nature 2016;533:452–454. [DOI] [PubMed] [Google Scholar]
- 29.Lynch SM, Vrieling A, Lubin JH, et al. Cigarette smoking and pancreatic cancer: a pooled analysis from the pancreatic cancer cohort consortium. Am J Epidemiol 2009;170:403–413. [DOI] [PMC free article] [PubMed] [Google Scholar]
- 30.Arslan AA, Helzlsouer KJ, Kooperberg C, et al. Anthropometric measures, body mass index, and pancreatic cancer: a pooled analysis from the Pancreatic Cancer Cohort Consortium (PanScan). Arch Intern Med 2010; 170:791–802. [DOI] [PMC free article] [PubMed] [Google Scholar]
- 31.Andersson G, Wennersten C, Borgquist S, et al. Pancreatic cancer risk in relation to sex, lifestyle factors, and pre-diagnostic anthropometry in the Malmö Diet and Cancer Study. Biol Sex Differ 2016;7:66. [DOI] [PMC free article] [PubMed] [Google Scholar]
- 32.Stocks T, Rapp K, Bjørge T, et al. Blood glucose and risk of incident and fatal cancer in the metabolic syndrome and cancer project (me-can): analysis of six prospective cohorts. PLoS Med 2009;6:e1000201. [DOI] [PMC free article] [PubMed] [Google Scholar]
- 33.Nam SY, Jo J, Lee WK, et al. The sex discrepancy effects of fruit and vegetable intake on pancreatic cancer risk; a large Korean cancer screening cohort study. Dig Liver Dis 2022; 54:365–370. [DOI] [PubMed] [Google Scholar]
- 34.Fyssas I, Syrigos KN, Konstandoulakis MM, et al. Sex hormone levels in the serum of patients with pancreatic adenocarcinoma. Horm Metab Res 1997;29:115–118. [DOI] [PubMed] [Google Scholar]
- 35.Bertakis KD, Azari R, Helms LJ, et al. Gender differences in the utilization of health care services. J Fam Pract 2000;49:147–152. [PubMed] [Google Scholar]
- 36.Primavesi F, Stättner S, Schlick K, et al. Pancreatic cancer in young adults: changes, challenges, and solutions. Onco Targets Ther 2019;12:3387–3400. [DOI] [PMC free article] [PubMed] [Google Scholar]
- 37.McWilliams RR, Maisonneuve P, Bamlet WR, et al. Risk factors for early-onset and very-early-onset pancreatic adenocarcinoma: a pancreatic cancer case-control consortium (PanC4) analysis. Pancreas 2016;45:311–316. [DOI] [PMC free article] [PubMed] [Google Scholar]
- 38.Slade T, Chapman C, Swift W, et al. Birth cohort trends in the global epidemiology of alcohol use and alcohol-related harms in men and women: systematic review and metaregression. BMJ Open 2016;6:e011827. [DOI] [PMC free article] [PubMed] [Google Scholar]
- 39.Piciucchi M, Capurso G, Valente R, et al. Early onset pancreatic cancer: risk factors, presentation and outcome. Pancreatology 2015;15:151–155. [DOI] [PubMed] [Google Scholar]
- 40.Barrington-Trimis JL, Braymiller JL, Unger JB, et al. Trends in the age of cigarette smoking initiation among young adults in the US from 2002 to 2018. JAMA Netw Open 2020;3:e2019022. [DOI] [PMC free article] [PubMed] [Google Scholar]
- 41.Guan HB, Wu L, Wu QJ, et al. Parity and pancreatic cancer risk: a dose-response meta-analysis of epidemiologic studies. PLoS One 2014;9:e92738. [DOI] [PMC free article] [PubMed] [Google Scholar]
- 42.Hamilton BE, Martin JA, Osterman MJK. Births: provisional data for 2020: NVSS Vital Statistics Rapid Release; no 12. Hyattsville, MD: National Center for Health Statistics, May 2021:104993. Available at: https://stacks.cdc.gov/view/cdc/104993. [Google Scholar]
- 43.Wirtz HS, Calip GS, Buist DSM, et al. Evidence for detection bias by medication use in a cohort study of breast cancer survivors. Am J Epidemiol 2017; 185:661–672. [DOI] [PMC free article] [PubMed] [Google Scholar]
Associated Data
This section collects any data citations, data availability statements, or supplementary materials included in this article.