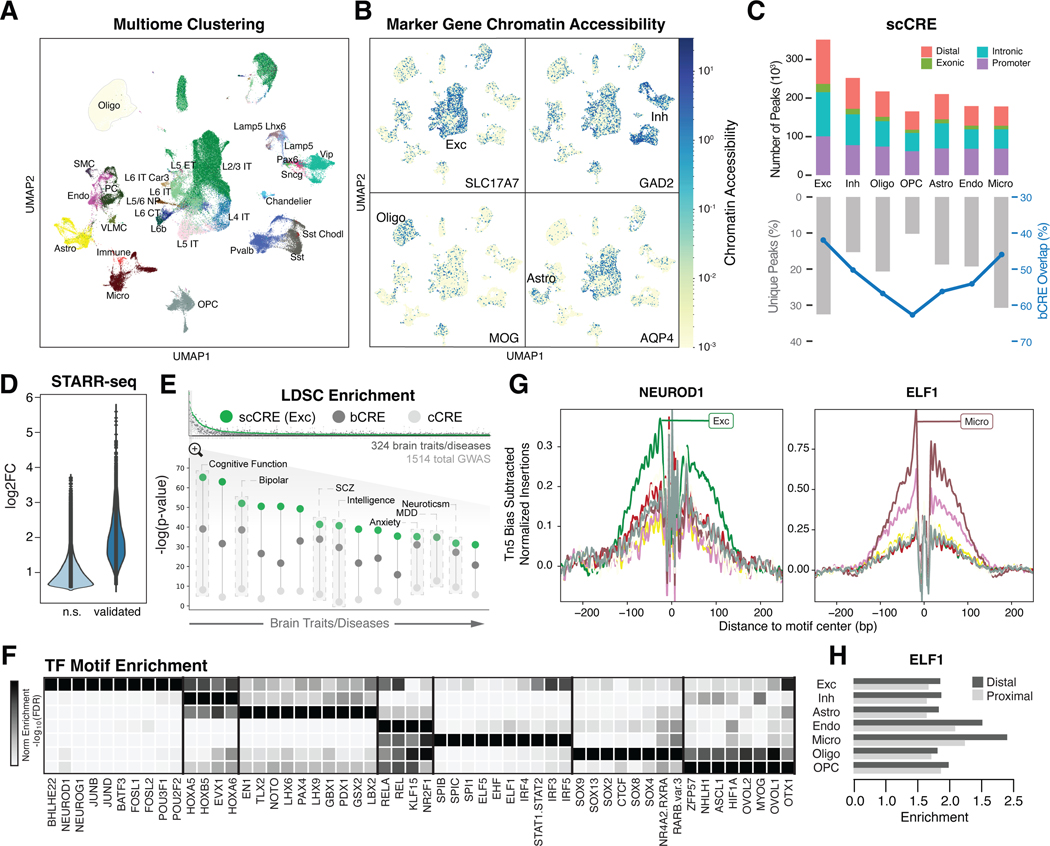
Figure 2. Determining regulatory elements for cell types from snATAC-seq.
(A) UMAP plot for clustering of 28 harmonized cell types from snMultiome data derived from 40 individuals. (B) UMAP plots highlighting chromatin accessibility of key marker genes for four broad cell types (see Fig. 1C). (C) (Top) Counts of open chromatin regions from combined snATAC-seq and snMultiome peaks across cohorts by gene context (promoter, intronic, exonic, or distal). (Bottom) Percentage of unique ATAC peaks found in each cell type. Blue line indicates the percentage of ATAC peaks that overlap with b-cCREs derived from bulk data. (D) Change in enhancer activity among open chromatin regions using STARR-seq assays of predicted enhancers, comparing the log2-fold expression change of validated regions to non-validated regions (n.s.). (E) (Top) LDSC enrichment across GWAS summary statistics for UK BioBank traits and diseases, including brain-related traits (gray bars), cCREs (white circles), b-cCREs (gray circles), and snATAC-seq peaks in excitatory neurons (scCREs, green circles). (Bottom) LDSC enrichment (log-scaled p-values for LDSC analysis as explained in (20)) for select brain traits and disorders. Trait names are listed in table S6. (F) Enrichment (log-scaled FDR) of TF binding motifs among cell-type-specific snATAC-seq peaks. (G) Differential activity of ELF1 in proximal and distal regions across cell types. (H) Cell-type-specific location of TF binding for NEUROD1 (left) and ELF1 (right) across cell types (colors defined in Fig. 1A), based on snATAC-seq footprinting analysis.

