

Abstract
BACKGROUND:
Health insurers have increased the use of copay accumulator adjustment programs (CAAPs) to control costs; however, some states within the United States have banned the use of CAAPs to protect patients from rising out-of-pocket expenses.
OBJECTIVE:
To assess the impact of state CAAP bans on patient liability, treatment adherence, and treatment persistence.
METHODS:
This was a retrospective cohort study using administrative claims recorded in the IQVIA PharMetrics Plus database. Data were extracted for patients with fully insured commercial plans receiving autoimmune or multiple sclerosis drugs between January 1, 2017, and December 31, 2021. Patient liability was defined as the difference in insurer allowed and paid amounts. Treatment adherence was measured as the proportion of days covered over a 1-year period, with “adherent” defined as a proportion of days covered greater than or equal to 80%. Treatment persistence was defined as time from treatment initiation to discontinuation (a period of 60 days without supply of treatment). The analysis compared differences in outcomes in states that implemented a CAAP ban during the study period (Arizona, Georgia, Illinois, Virginia, West Virginia) with states that did not, for before and after the date of ban.
RESULTS:
States that implemented a CAAP ban had relative reductions in patient liability after the first 2 months, which ranged from 41% to 63%, with monthly savings ranging from $128 to $520. Patients in states with a CAAP ban had 14% greater odds of being adherent to their treatment after policy implementation than patients in states without a CAAP ban and a 13% reduction in risk of discontinuing.
CONCLUSIONS:
The implementation of state legislation to restrict the use of CAAPs in state-regulated plans was associated with reductions in patient liability and improvements in treatment adherence and persistence for the 5 states that were early implementers of a CAAP ban. These results may offer insights for states that have recently implemented a CAAP ban, as well as for those considering enacting similar legislation.
Plain language summary
Drug companies and foundations help patients afford medications by covering their cost. However, some health insurance providers have copay accumulator adjustment programs (CAAPs) that do not allow this money to count against what patients owe for medication. This study found that in states that banned CAAPs, patients in most months paid 41%-63% less for their medicine. They were also more likely to keep taking their medicine correctly and less likely to stop taking it.
Implications for managed care pharmacy
The findings from this study offer insights on the impact of restricting the use of CAAP in states that have enacted legislation, as well as in states that may be considering implementing similar legislation in the future. Restricting the use of CAAPs may improve access to medication for patients in state-regulated plans, particularly those for whom high patient costs can be a barrier to remaining on treatment.
Cost sharing in health care is a strategy used by insurers to reduce costs, with the idea that patients will be more considerate of whether they should consume care if they are required to cover a larger proportion of the cost of the service.1 Cost-sharing requirements, such as deductibles and out-of-pocket (OOP) maximums, have risen over time,2 with patients being required to cover more costs being associated with poorer treatment adherence.3 One option for patients to alleviate the financial burden of greater cost sharing is the use of copay assistance. Copay assistance, commonly through manufacturer sponsored programs or nonprofit foundations, helps to offset the OOP cost of prescriptions to patients by reducing their cost-sharing requirements. Furthermore, copay assistance has been shown to reduce prescription abandonment while also potentially having an equity impact, thereby increasing access to medicines for patients.4
Commercial insurers have a skeptical view of copay assistance, mostly viewing such programs as “marketing tools”5 by manufacturers to circumvent formulary management tools. Although most evidence of copay assistance suggests that use of coupons does improve patient adherence,6,7 there is mixed evidence on whether copay assistance encourages higher-cost drugs over less expensive generics.8,9 Nonetheless, in response to the use of copay assistance programs, copay accumulator adjustment programs (CAAPs) have been used by commercial insurers to encourage patients to choose lower-cost drug options by restricting the amount of copay assistance (for higher-cost drugs) that can count toward a patient’s annual deductible and OOP limit, thereby increasing a patient’s OOP exposure.10 Furthermore, as CAAPs have grown in use, insurers have increasingly viewed copay assistance programs as a source of revenue to help to save the plan sponsor’s money,11 with insurers reporting specialty drug–spend savings with copay adjustment programs.12 CAAPs were initially focused in specific specialty therapeutic areas, such as autoimmune diseases or multiple sclerosis; however, their use has expanded to other disease areas as well.13 Reports have suggested that CAAPs may raise patient OOP expenses14 and decrease patient adherence to treatment.15
Despite the potential negative impact to patient’s OOP costs and outcomes, the 2021 Notice of Benefit and Payment Parameters confirmed the ability of commercial insurers to use CAAPs.16 On the other hand, states have taken a different approach toward CAAPs, with 20 states having passed legislation banning the use of CAAPs, although these legislations are limited to state-regulated health plans and do not apply to Employee Retirement Income Security Act (ERISA)–regulated plans.17 The policies of the first states to enact legislation on CAAPs went into effect between 2019 and 2021. Therefore, there has been little empirical data thus far to understand the real-world impact of CAAP bans. The purpose of this study was to assess whether there is an association between the implementation of a CAAP ban and patient liability and treatment adherence and persistence.
Methods
STUDY DESIGN
This was a retrospective cohort study using administrative claims from the IQVIA PharMetrics Plus database for patients with commercial plans receiving autoimmune or multiple sclerosis drugs between January 1, 2017, and December 31, 2021. To assess the impact of the state CAAP bans, we limited our patient population to those with fully insured health plans, which fall under state regulations (whereas self-funded health plans would be ERISA regulated). We compared differences in patient liability and treatment adherence and persistence in states that implemented a CAAP ban during the study period (Arizona, Georgia, Illinois, Virginia, West Virginia) with states that did not, for before and after the date of ban. The policy effective dates for the states that implemented a CAAP ban can be found in Supplementary Table 1 (579.1KB, pdf) (available in online article). For states not implementing a CAAP ban, a pseudopolicy effective date was set to January 1, 2020. Autoimmune and multiple sclerosis drugs were chosen because of the early focus of CAAPs on these specialty drugs. We included autoimmune and multiple sclerosis drugs that were available both before and after the policy effective date. Included drugs were required to not have a generic or biosimilar available during the study period to minimize confounding in patient liability and treatment persistence due to potential switching from branded to generic/biosimilar products (Supplementary Table 2 (579.1KB, pdf) ).
PATIENT LIABILITY
The study design for the patient liability analyses can be found in Supplementary Figure 1 (579.1KB, pdf) . Previously treated patients were included in the patient liability analyses to minimize any potential imbalance in the amount of costs already contributed toward a deductible as a result of patients initiating treatment at various points during the calendar year. First and last drug use had to cover January of any calendar year within the study period (2017-2021), with January 1st after first drug use defined as the index date. Additional criteria included continuous enrollment in medical and pharmacy benefits for at least 1 year before the index date (defined as the baseline period) and at least 1 month of drug use between the index date and end of continuous enrollment (Supplementary Table 3 (579.1KB, pdf) ). Only months for which the patient was continuously enrolled since the index date were included. Because copay assistance is not captured by the data source used for this study, overall financial liability to the patient, which is inclusive of both OOP costs spent by the patient and manufacturer copay assistance spent on behalf of the patient, was examined as the outcome instead. Patient liability was thus defined as the difference in allowed costs and plan-paid amounts. Costs were adjusted to 2021 US dollars using the medical care component of the consumer price index.
TREATMENT ADHERENCE AND PERSISTENCE
The study design for the treatment adherence and persistence analyses is depicted in Supplementary Figure 2 (579.1KB, pdf) . Because time since treatment initiation for previously treated patients could bias adherence and persistence results, newly treated patients were used for these analyses, with drug initiation during the study period defined as the index date. Patients across both adherence and persistence analyses were required to have at least 1 year of continuous enrollment in medical and pharmacy benefits before the index date (patient attrition can be found in Supplementary Tables 4 and 5 (579.1KB, pdf) ).
For the adherence analyses, patients were required to have additional continuous enrollment of at least 1 year after the index date. Patients in the adherence analysis were grouped into cohorts according to whether most of the 1-year follow-up time fell before or after the policy effective date. Treatment adherence was measured as the proportion of days covered (PDC), defined as the number of days with drug on hand, over a 1-year continuous enrollment period after the index date.
In the persistence analyses, patients were required to have additional continuous enrollment of at least 3 months after the index date and were categorized into cohorts based on the index date. Treatment persistence was measured as the time from treatment initiation to discontinuation, defined as a period of 60 days without supply of treatment.
STATISTICAL METHODS
Three separate statistical models were used for analyzing the effect of state CAAP bans on patient liability, treatment adherence, and treatment persistence, with separate cohorts for each outcome, for ease of interpretation of results. Multivariate difference-in-difference models with year-month as the unit of analysis were fit to mean monthly patient liability, weighted by the number of patients with drug claims per year-month, to assess differences in patient liability between states with and without a CAAP ban. Mean monthly patient liability was modeled using a log-linked gamma generalized linear model with a 4-way interaction between drug, calendar month, CAAP status, and before vs after the policy effective date. Parallel trends in patient liability before the policy effective date were assessed by fitting generalized linear models to data from only before the policy effective date. To account for composition effects, patient characteristics whose relative distributions were different before compared with after the policy effective date, in states with or without a CAAP ban, were included in the generalized linear model as adjustment variables. Composition effects for each patient characteristic were tested for by an overall F-test (for continuous variables) or likelihood ratio test (categorical) from fitting a linear (continuous) or logistic (categorical) regression model for each variable as a function of CAAP status and before vs after the policy effective date, comparing models with and without an interaction term. Estimates of the overall mean monthly patient liability across drugs were weighted by the number of patients in each factor combination in the model to reflect OOP costs best in the patient sample (R package emmeans18).
One-year adherence was estimated as a weighted mean and was assessed using a weighted logistic regression (defined as PDC ≥0.8). In adherence analyses, patients were followed up for 1 year (1-year continuous enrollment). Patients who initiated before the policy effective date and had follow-up time across both policy periods were assigned to either the before or after policy period according to when most of the follow-up time (ie, >6 months) occurred. Weights for both persistence and adherence analyses were computed using propensity score methods, in which the propensity of being in a state with a CAAP ban vs not was modeled according to baseline characteristics that included demographic factors, health care resource utilization, and disease status (rheumatoid arthritis, multiple sclerosis, psoriasis). All analyses were conducted using R version 4.1.0.19
Persistence was assessed as time to treatment discontinuation using weighted Kaplan-Meier methods. Given that persistence, unlike adherence, tends toward a variable follow-up design, we decided to maximize our patient population for the persistence analyses by requiring a less restrictive minimum of 3 months (as opposed to the minimum of 1 year for adherence) of post-index continuous enrollment. Patients who initiated treatment before the policy effective date and did not discontinue were censored at the end of continuous enrollment or policy effective date, whichever was the earlier date. Patients who initiated after the policy effective date and did not discontinue were censored at the end of continuous enrollment.
Results
PATIENT CHARACTERISTICS
Overall, 95,519 patients were included for the patient liability analyses, 44,969 for the treatment adherence analyses, and 65,990 for the treatment persistence analyses. Baseline characteristics were similar pre-policy vs post-policy within each analytic cohort, with a mean (SD) age ranging from 45 (14) to 48 (13) years and with female patients constituting 57% to 64% of each cohort (Supplementary Tables 6, 7, and 8 (579.1KB, pdf) ). The relative proportions of patients before vs after the policy effective date on preferred provider organization plans or health maintenance organization plans, residing in the South or the Midwest, and with any diagnosis of rheumatoid arthritis during the baseline period differed in states with or without a CAAP ban; therefore, they were added as covariates to the difference-in-difference models of patient liability. With the exception of baseline pharmacy costs, baseline outpatient costs, and baseline total costs, which were higher/lower in the persistence analysis cohort, there were no significant differences among the cohorts for individual drug use, baseline health care resource utilization, and costs.
PATIENT LIABILITY
In the states that implemented a CAAP ban, the mean monthly patient liability reduced from a range of $2,781 (January) to $303 (November) before the policy effective date to a range of $2,460 (January) to $164 (November) after the policy effective date (Figure 1A). In contrast, patient liability in states without a CAAP ban increased from a range of $930 (January) to $88 (November) before the policy effective date to a range of $930 (January) to $103 (November) after the policy effective date (Figure 1B). For states with a CAAP ban, relative reductions in patient liability were similar to those of states without a CAAP ban in January and February, whereas relative reductions were greater from March through December, ranging from 41% to 63% and monthly savings ranging from $128 to $520 (Table 1).
FIGURE 1.

Patient Liability for States With a CAAP (A) and With a CAAP Ban (B)
TABLE 1.
Relative Patient Liability Before and After CAAP Ban, by CAAP Status
| Month | Ratio of patient liability before and after ban | Adjusted ratio (ratio of CAAP allowed/ratio of CAAP banned) | Effect of CAAP ban on patient liability, % ($) | |
|---|---|---|---|---|
| CAAP allowed | CAAP banned | |||
| January | 1.00 (0.91, 1.10) | 1.13 (0.85, 1.50) | 0.89 (0.66, 1.20) | −12% ($320) |
| February | 0.93 (0.84, 1.02) | 1.24 (0.93, 1.65) | 0.75 (0.56, 1.01) | −25% ($399) |
| March | 0.91 (0.82, 0.997) | 1.68 (1.27, 2.24) | 0.54 (0.40, 0.73) | −46% ($520) |
| April | 0.90 (0.82, 0.99) | 2.17 (1.62, 2.90) | 0.42 (0.31, 0.57) | −58% ($472) |
| May | 0.96 (0.86, 1.06) | 2.55 (1.89, 3.44) | 0.37 (0.27, 0.51) | −63% ($415) |
| June | 0.90 (0.81, 0.99) | 2.26 (1.66, 3.06) | 0.40 (0.29, 0.55) | −60% ($317) |
| July | 0.88 (0.80, 0.98) | 2.36 (1.77, 3.14) | 0.38 (0.28, 0.51) | −63% ($336) |
| August | 0.87 (0.78, 0.97) | 2.07 (1.55, 2.76) | 0.42 (0.31, 0.57) | −58% ($255) |
| September | 0.86 (0.77, 0.96) | 2.09 (1.55, 2.81) | 0.41 (0.30, 0.57) | −59% ($217) |
| October | 0.97 (0.87, 1.08) | 1.84 (1.36, 2.49) | 0.53 (0.38, 0.72) | −47% ($161) |
| November | 0.86 (0.77, 0.96) | 1.85 (1.36, 2.50) | 0.47 (0.34, 0.64) | −53% ($162) |
| December | 0.88 (0.79, 0.98) | 1.49 (1.09, 2.03) | 0.59 (0.43, 0.82) | −41% ($128) |
Model included covariates for the proportion of patients on preferred provider organization plans, on health maintenance organization plans, residing in the South, residing in the Midwest, and with any diagnosis of rheumatoid arthritis.
CAAP = copay accumulator adjustment program.
TREATMENT ADHERENCE AND PERSISTENCE
Before the policy effective date, PDC was not significantly different between states with and without a ban (mean [SD], 0.66 [0.31] vs 0.66 [0.31]; P = 0.7), and there was no difference in the odds of being adherent to their medication (odds ratio 0.99 [95% CI = 0.91-1.08]; P = 0.9) (Table 2). After the policy effective date, mean PDC was greater in those states with a CAAP ban (mean [SD], 0.69 [0.31] vs 0.66 [0.31]; P < 0.01), and patients in these states had a 14% greater odds of being adherent to their treatment (odds ratio 1.14 [95% CI = 1.03-1.27]; P < 0.01) compared with patients in states without a CAAP ban.
TABLE 2.
Treatment Adherence Before and After CAAP Ban, by CAAP Status
| N | Mean PDC (SD) | P value | Adherence (PDC ≥ 0.8), % | P value | IPTW-weighted OR (95% CI) for adherence (PDC ≥ 0.8) | P value | |
|---|---|---|---|---|---|---|---|
| Before CAAP ban | |||||||
| CAAP allowed | 25,643 | 0.66 (0.31) | 0.7 | 46.4 | 0.6 | Reference | 0.9 |
| CAAP banned | 2,865 | 0.66 (0.31) | 46.9 | 0.99 (0.91–1.08) | |||
| After CAAP ban | |||||||
| CAAP allowed | 14,613 | 0.66 (0.31) | <0.01 | 47.9 | <0.01 | Reference | 0.01 |
| CAAP banned | 1,848 | 0.69 (0.31) | 52.9 | 1.14 (1.03–1.27) | |||
Weighting was performed for propensity of a patient in a state with a CAAP ban vs a patient in a state without a CAAP ban according to age, sex, drug type, patient region, psoriasis status at baseline period, rheumatoid arthritis status at baseline period, multiple sclerosis status at baseline period, total baseline costs, number of prescription fills at baseline, and quarter of drug start.
CAAP = copay accumulator adjustment program; IPTW = inverse probability of treatment weighting; OR = odds ratio; PDC = proportion of days covered.
Before the policy effective date, there was no significant difference in the risk of patients discontinuing treatment between states that had a CAAP ban or not (hazard ratio 0.99 [95% CI = 0.94-1.04]; P = 0.6) (Figure 2A). After the policy effective date, states with a CAAP ban had a 13% reduction in risk of patients discontinuing treatment compared with states without a CAAP ban (hazard ratio 0.87 [95% CI = 0.82-0.93]; P < 0.01) (Figure 2B). The median persistence was 4 months longer for states with a CAAP ban than those without.
FIGURE 2.
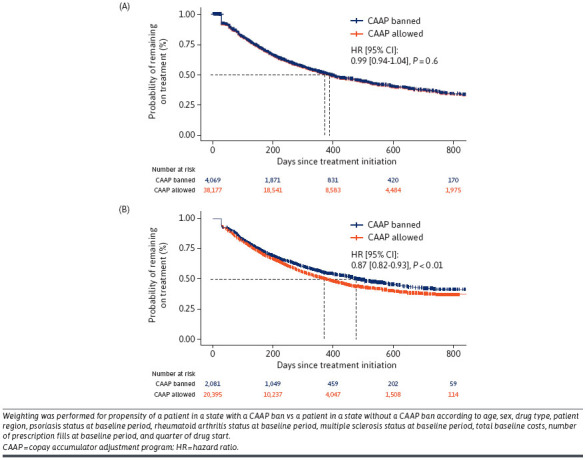
Treatment Persistence Before (A) and After (B) CAAP Ban, by CAAP Status
Discussion
This study demonstrated that states that had implemented a ban on CAAPs had lower patient liability than before the ban went into effect and better treatment adherence and persistence among patients treated with autoimmune and multiple sclerosis medications. To our knowledge, this is the first study to assess the real-world implications of state legislation prohibiting the use of CAAPs for state-regulated health plans. The findings here have implications for both policymakers and patients.
The real-world findings from our study on patient liability support previous reports that have illustrated the potential increase in OOP costs for CAAP patients in hypothetical examples.14 Despite the potential patient OOP savings, critics of proposed CAAP ban legislation often cite that offsetting increases patient premiums. However, other analyses have found no evidence that state CAAP bans increase premiums,20,21 which, taken in consideration with the present study, suggests that CAAP bans may alleviate the financial burden for patients.
The improved treatment adherence and persistence associated with the legislation prohibiting CAAPs found in this study is also consistent with previous research that found that CAAPs are associated with lower adherence and higher rates of treatment discontinuation for specialty drugs.15 Despite the improvement, the mean adherence observed in both states with and without CAAP bans was less than ideal, and additional efforts beyond legislative action are needed to improve adherence overall. Given the importance of medication adherence in treating serious and chronic diseases, the implementation of state CAAP bans may potentially have an impact on the overall health outcomes for patients in the states with a CAAP ban, and further research is needed. With the observed potential impacts on patient OOP costs, adherence, and persistence, patients and plan sponsors should consider these when choosing health plan benefits. However, to aid patients in deciding whether to choose a plan with a CAAP, additional transparency is needed on the presence of CAAPs in a plan’s benefit design14 to enable patients to make the most informed choice of their health coverage.
These results could provide insight for future policy regarding CAAPs. State policymakers who are debating legislation on CAAPs should consider the findings here and whether the outcomes observed in the early implementers of CAAP bans may also apply to their own state if similar legislation were to be passed. It should be noted, however, that state CAAP bans are limited in their impact both in terms of geography (limited to that state) and the plan types that they affect (state-regulated health plans), with estimates of the proportion of commercially insured lives affected by the current 19 states banning CAAPs being approximately 19%.22
Given the limited scope of the state CAAP legislation, an additional consideration is the health equity impact of such legislation, because previous research has suggested that CAAPs may disproportionately impact historically marginalized patients.23 Although states that prohibit CAAPs may alleviate health disparities exacerbated by CAAPs among patients on state-regulated health plans through a reduction in patient liability and improvement in adherence and persistence, this may also widen differences between those on ERISA-regulated health plans and state-regulated health plans, as well as for patients in states without legislation that prohibits the use of CAAPs. Recently, the US Department of Health and Human Services (HHS) dropped its appeal challenging a US district court decision to strike down a federal rule that allowed plans to omit manufacturer copay assistance from cost-sharing calculations. Although this would limit the use of copay accumulators in federally regulated plans, HHS has stated that it will not enforce the previous rule and instead will enter into new rulemaking on the topic. Thus, close attention should be paid to the potential impact of this, as well as other federal-level legislation, such as the HELP Copays Act, in addressing the use of CAAPs and reducing the variation in access to medicines for patients across the United States.
There are several limitations to consider when interpreting the results of this study. First, the database is not able to detect the use of copay cards or coupons, and thus we were not able to distinguish between copay assistance being used and patient OOP costs. That being said, the results observed are in line with expectations, as patients were expected to have higher patient liability with CAAPs (owing to the full deductible amount plus the value of the copay cards accounting for the patient liability) and CAAP bans were expected to reduce patient liability (copay card value accounting for some of the deductibles). Given that patients are required to cover their entire deductible once their copay assistance is exhausted, it is likely that their OOP expenses have increased as demonstrated by other studies that have conducted modeling exercises,14 although further research is warranted to measure the extent of the increased financial burden. Furthermore, our results could potentially be conservative because this analysis was not restricted to only patients with copay assistance, and the reductions in patient liability associated with the CAAP bans could be greater if patients without copay assistance were to have similar patient liability irrespective of the state CAAP laws. Second, the 5 states that implemented a CAAP ban in this study started out with higher patient liability in January of calendar years before the ban relative to states that did not implement bans. Thus, these 5 states had more room to decrease patient liability after the bans went into effect, and it is possible that other states with lower patient liability to start off with may not realize the same level of savings by implementing a CAAP ban. Third, although parallel trends in OOP costs between states with and without a CAAP ban before the policy effective date provides confidence in the estimated effect on patient liability after the bans were implemented, other confounding factors that might differ before and after policy implementation (such as COVID-19) could potentially impact the results. Lastly, even though the claims database used for the analysis covers multiple insurers and plans, not all US insurers were included in the data and we did not include all specialty medicines impacted by CAAPs. Further research would be needed to understand whether similar findings are observed in other insurers and health plans, as well as generalizable to other therapeutic areas.
Conclusions
The implementation of state legislation to restrict the use of CAAPs in state-regulated plans was associated with reductions in patient liability and greater treatment adherence and persistence for the 5 states that were early implementers of a CAAP ban. These results may offer insights to those states that have recently implemented a CAAP ban, as well as those considering enacting similar legislation. Given the variation in state adoption of CAAP bans, additional considerations should be given to the health equity impact of CAAPs, as well as potential federal solutions to address the variation in access for patients across the United States.
ACKNOWLEDGMENTS
The authors acknowledge Vikte Lionikaite, PhD, and Rebecca Hornby, PhD, of Oxford PharmaGenesis, Oxford, UK, for medical writing support funded by Genentech, Inc.
Funding Statement
This study was funded by Genentech, Inc. Genentech, Inc., had a role in the study design, data analysis and interpretation, manuscript writing, submission, and approval.
DATA SHARING STATEMENT
This claims database analyses used IQVIA PharMetrics Plus closed claims data obtained under license from IQVIA, Inc., as per signed agreement between Genentech, Inc., and IQVIA, Inc., and thus data cannot be publicly shared. Interested researchers can reach out to IQVIA Inc. to request access to the data.
REFERENCES
- 1.Remler DK, Greene J. Cost-sharing: A blunt instrument. Annu Rev Public Health. 2009;30:293-311. doi:10.1146/annurev.publhealth.29.020907.090804 [DOI] [PubMed] [Google Scholar]
- 2.Employee Benefit Research Institute. Trends in cost sharing for medical services, 2013–2020. Accessed May 26, 2023. https://www.Ebri.Org/docs/default-source/chartbooks/ebri_cb_costsharing-5jan23.Pdf?Sfvrsn=172392f_2
- 3.Fusco N, Sils B, Graff JS, Kistler K, Ruiz K. Cost-sharing and adherence, clinical outcomes, health care utilization, and costs: A systematic literature review. J Manag Care Spec Pharm. 2023;29(1):4-16. doi:10.18553/jmcp.2022.21270 [DOI] [PMC free article] [PubMed] [Google Scholar]
- 4.Wong WB, Donahue A, Thiesen J, Yeaw J. Copay assistance use and prescription abandonment across race, ethnicity, or household income levels for select rheumatoid arthritis and oral oncolytic medicines. J Manag Care Spec Pharm. 2023;29(3):324-34. doi:10.18553/jmcp.2023.22288 [DOI] [PMC free article] [PubMed] [Google Scholar]
- 5.Optum. Making sense of copay cards: How copay cards can disrupt your benefit strategy. Accessed July 4, 2023. https://www.optum.com/business/insights/pharmacy-care-services/page.hub.managing-copay-cards.html
- 6.Hung A, Blalock DV, Miller J, et al. Impact of financial medication assistance on medication adherence: A systematic review. J Manag Care Spec Pharm. 2021;27(7):924-35. doi:10.18553/jmcp.2021.27.7.924 [DOI] [PMC free article] [PubMed] [Google Scholar]
- 7.Parekh KD, Wong WB, Zullig LL. Impact of co-pay assistance on patient, clinical, and economic outcomes. Am J Manag Care. 2022;28(5):e189-97. doi:10.37765/ajmc.2022.89151 [DOI] [PubMed] [Google Scholar]
- 8.Dafny L, Ody C, Schmitt M. When discounts raise costs: The effect of copay coupons on generic utilization. Am Econ J Econ Policy. 2017;9(2):91-123. doi:10.1257/pol.20150588 [Google Scholar]
- 9.Rome BN, Gagne JJ, Kesselheim AS. Association of California’s prescription drug coupon ban with generic drug use. JAMA. 2021;325(23):2399-402. doi:10.1001/jama.2021.6568 [DOI] [PMC free article] [PubMed] [Google Scholar]
- 10.Zuckerman AD, Schneider MP, Dusetzina SB. Health insurer strategies to reduce specialty drug spending-copayment adjustment and alternative funding programs. JAMA Intern Med. 2023;183(7):635-6. doi:10.1001/jamainternmed.2023.1829 [DOI] [PubMed] [Google Scholar]
- 11.Drug Channels. How copay accumulators and maximizers have changed payers’ view of copay support. Accessed July 17, 2023. https://www.drugchannels.net/2022/07/how-copay-accumulators-and-maximizers.html
- 12.CVS Health. Low specialty drug trend - without compromises. Accessed July 17, 2023. https://insightslp.cvshealth.com/rs/161-LXO-491/images/CVS-Drug-Trend-Report_PDF_2.23.22.pdf
- 13.Xcenda. Copay accumulators and the impact on patients - assessing the proliferation of copay accumulators hindering patient access through an opaque benefit design. Accessed July 4, 2023. https://www.Xcenda.Com/-/media/assets/xcenda/english/content-assets/white-papers-issue-briefs-studies-pdf/xcenda-issue-brief_copay-accumulators-and-the-impact-on-patients.Pdf
- 14.The AIDS Institute. Discriminatory copay policies undermine coverage for people with chronic illness - copay accumulator adjustment policies in 2023. Accessed July 4, 2023. https://aidsinstitute.net/documents/TAI-Report-Copay-Accumulator-Adjustment-Programs-2023.pdf
- 15.Sherman BW, Epstein AJ, Meissner B, Mittal M. Impact of a co-pay accumulator adjustment program on specialty drug adherence. Am J Manag Care. 2019;25(7):335-40. [PubMed] [Google Scholar]
- 16.US Department of Health and Human Services. Patient protection and affordable care act; HHS notice of benefit and payment parameters for 2021; notice requirement for non-federal governmental plans. Accessed July 4, 2023. https://s3.amazonaws.com/public-inspection.federalregister.gov/2020-10045.pdf
- 17.National Conference of State Legislatures (NCSL). Copayment adjustment programs. Accessed July 7, 2023. https://www.Ncsl.Org/health/copayment-adjustment-programs
- 18.Lenth RV. emmeans: Estimated marginal means, aka least-squares means. Accessed July 7, 2023. https://cran.r-project.org/web/packages/emmeans/index.html
- 19.R Core Team. R: A language and environment for statistical computing. Vienna, Austria: R foundation for statistical computing, 2021. Accessed July 17, 2023. Available from: https://www.R-project.org/
- 20.Global Healthy Living Foundation. State laws protecting patient assistance programs by prohibiting accumulators and maximizers have not impacted health insurance premiums. Accessed July 11, 2023. https://ghlf.org/copay-assistance-protection/#1668713434132-8026b016-ce470
- 21.The AIDS Institute. Comparison of marketplace average benchmark premiums between states with and without copay accumulator adjustment bans. All Copays Count Coalition. Accessed July 11, 2023. https://allcopayscount.org/wp-content/uploads/2023/06/The-AIDS-Inst.-Copay-Assistance-Does-Not-Increase-Premiums.pdf
- 22.Avalere. State copay accumulator bans will affect 19% of US commercial lives. Accessed July 4, 2023. https://avalere.Com/insights/state-copay-accumulator-bans-impact-11-of-us-commercial-lives
- 23.Ingham M, Sadik K, Zhao X, Song J, Fendrick AM. Assessment of racial and ethnic inequities in copay card utilization and enrollment in copay adjustment programs. J Manag Care Spec Pharm. 2023;29(9):1084-92. [DOI] [PMC free article] [PubMed] [Google Scholar]