

Abstract
Purpose:
To develop consensus terminology and criteria for defining atrophy based on OCT findings in the setting of age-related macular degeneration (AMD).
Design:
Consensus meeting.
Participants:
Panel of retina specialists, image reading center experts, retinal histologists, and optics engineers.
Methods:
As part of the Classification of Atrophy Meetings (CAM) program, an international group of experts surveyed the existing literature, performed a masked analysis of longitudinal multimodal imaging for a series of eyes with AMD, and reviewed the results of this analysis to define areas of agreement and disagreement. Through consensus discussions at 3 meetings over 12 months, a classification system based on OCT was proposed for atrophy secondary to AMD. Specific criteria were defined to establish the presence of atrophy.
Main Outcome Measures:
A consensus classification system for atrophy and OCT-based criteria to identify atrophy.
Results:
OCT was proposed as the reference standard or base imaging method to diagnose and stage atrophy. Other methods, including fundus autofluorescence, near-infrared reflectance, and color imaging, provided complementary and confirmatory information. Recognizing that photoreceptor atrophy can occur without retinal pigment epithelium (RPE) atrophy and that atrophy can undergo an evolution of different stages, 4 terms and histologic candidates were proposed: complete RPE and outer retinal atrophy (cRORA), incomplete RPE and outer retinal atrophy, complete outer retinal atrophy, and incomplete outer retinal atrophy. Specific OCT criteria to diagnose cRORA were proposed: (1) a region of hypertransmission of at least 250 μm in diameter, (2) a zone of attenuation or disruption of the RPE of at least 250 μm in diameter, (3) evidence of overlying photoreceptor degeneration, and (4) absence of scrolled RPE or other signs of an RPE tear.
Conclusions:
A classification system and criteria for OCT-defined atrophy in the setting of AMD has been proposed based on an international consensus. This classification is a more complete representation of changes that occur in AMD than can be detected using color fundus photography alone. Longitudinal information is required to validate the implied risk of vision loss associated with these terms. This system will enable such future studies to be undertaken using consistent definitions.
Geographic atrophy (GA) is a well-established end-stage manifestation of age-related macular degeneration (AMD).1,2 Gass3 originally described “geographic areas of atrophy” in the context of “senile macular choroidal degeneration” in 1970.4 As early as the 19th century, various other terms were used in the literature, including macular heredodegeneration, choroidal sclerosis, and senile macular disease. These terms were applied to inflammatory as well as monogenic conditions such as Stargardt disease or central areolar choroidal dystrophy.5–9 With the initiation of clinical studies of AMD, systems to classify the phenotypic features of AMD were refined.1,10–15 In 1995, the International Age-Related Maculopathy Epidemiological Study Group defined various clinical lesions associated with AMD and developed a grading system for disease severity.15 The system was categorical or semiquantitative and required the examiner or grader to determine the extent of specific findings (e.g., depigmentation, increased pigment, drusen, GA) relative to standardized reference circles of defined sizes. This method was used in part because of the limitations of the main imaging method available at the time, film-based flash color fundus photography (CFP).
However, these early classifications systems did establish specific CFP definitions for AMD lesions that continue to be used in studies decades later. Geographic atrophy was defined as any sharply delineated roughly round or oval area of hypopigmentation or depigmentation with increased visibility of the underlying choroidal vessels and of at least 175 μm in diameter on 30° or 35° CFP images.15 However, the borders of GA are not identified easily on monoscopic images, and high-quality stereoscopic photography often is needed to improve lesion boundary discrimination. Furthermore, stereoscopic images are difficult to obtain consistently in the context of large clinical studies, and this may explain the recent transition to fundus autofluorescence (FAF) imaging as the primary method to detect, monitor, and quantify atrophic lesions.16,17
By blue- or green-light fundus FAF, areas of GA appear as well-demarcated areas of decreased signal intensity.18 The high-contrast discrimination of atrophic versus nonatrophic areas by FAF has provided a reproducible method for semiautomated image analysis and accurate quantification of lesion area, and this method has been adopted in various clinical trials.19,20 One disadvantage of blue-light FAF to identify GA lesions is that the central macular luteal pigment also absorbs the blue excitation light, which makes it difficult to assess foveal involvement if FAF images are used in isolation.21 This limitation can be overcome by using green excitation light for FAF imaging, provided that confocal optics are used.22,23 More commonly, blue-light FAF is performed in conjunction with near-infrared reflectance, which is not affected by luteal pigment and therefore allows assessment of foveal involvement. Nonconfocal systems are prone to pseudoautofluorescence phenomena that are caused by absorption and generation of long-wavelength reflectance light by the natural lens that subsequently is scattered inside the vitreous cavity.24
OCT has become an essential imaging technology to evaluate the macula.25–31 The high axial resolution of current Fourier-domain OCT devices (both spectral-domain OCT and swept-source OCT) allow atrophy to be studied in 3 dimensions, and the involvement and tissue loss of specific retinal layers can be assessed quantitatively. Moreover, conventional B-scan viewing of OCT images can be combined with en face viewing of the volumetric OCT scans so that the borders of atrophy, which vary somewhat by layer, can be identified easily and the enlargement rates measured, as with FAF imaging. Modern high-resolution OCT affords us an opportunity to identify the early stages of the atrophic process, before lesions are clinically visible or detected as atrophy by CFP or FAF. In addition, the depth-resolved nature of OCT imaging allows us to evaluate tissue layer by layer, which is important because the severity of cellular loss in atrophic disease may vary among layers. This technology offers the possibility of a classification system that is based on OCT-defined changes in the various layers of the retina and choroid as atrophy evolves. Furthermore, OCT can identify precursor features, an example of which is nascent GA.32 Finally, a new classification system will allow harmonization of the findings provided by different imaging methods.
Although enlargement of atrophy as determined by CFP or FAF currently is the only regulatory agency-approved main anatomic end point for therapeutic trials, the use of OCT could allow for the identification of robust precursor end points that would facilitate and allow earlier and more precise estimation of tissue loss.33 Consequently, it is possible that clinical trials could be more efficient and briefer. Therefore, consensus definitions for precursor and end-stage atrophy are essential for the construction of a more granular classification system to enable acceptance and use of these novel future end points.
In the context of the construction of a consensus classification system, several considerations are key. For example, more than 1 OCT-defined pathway can lead to atrophy in the context of AMD. In a longitudinal study of eyes with reticular pseudodrusen (RPD), which manifest as subretinal drusenoid deposits on OCT, Spaide34 observed that progressive loss of photoreceptors associated with outer retinal thinning could occur with a preserved RPE layer. In eyes receiving antiangiogenic therapy for neovascular AMD, progressive photoreceptor and RPE atrophy are common over the course of long-term treatment.35–39 Should these additional forms of atrophy in the setting of AMD be termed geographic atrophy? If not, in this era of multimodal imaging, how might these various manifestations of atrophy associated with AMD be assessed, defined, and classified?
To address these issues and to understand and classify atrophic AMD better based on the multimodal imaging techniques now widely available, we assembled an international consensus group of experts in AMD and retinal imaging to review existing data and to propose a consensus definition and nomenclature for OCT-defined atrophy in the setting of AMD. This consensus group previously standardized the OCT nomenclature of anatomic landmarks and published guidelines for the use of various imaging methods to be used in clinical trials of AMD.40,41 In the present consensus effort, we borrowed methodology and terminology from those reports.
Methods
Formation of the Classification of Atrophy Meeting Group
An international team of experts in AMD and AMD imaging research was assembled to address the problem of developing multimodal definitions of atrophy in the setting of AMD. The initial selection of Classification of Atrophy Meetings (CAM) group members was performed by the 3 CAM chairs (S.R.S., G.S., and F.G.H.). Criteria for selection included a history of relevant publications (in AMD pathogenesis and histopathology, imaging technologies, image interpretation and analysis in AMD, and AMD clinical trials); recent AMD and imaging research contributions; a track record of success in previous collaborative, consensus efforts; and availability to attend the CAM meetings. The CAM group included clinicians, image reading center leaders, clinical trialists, histologists, and optical engineers (the full list of participants is provided in Appendix 1, available at www.aaojournal.org). Industry leaders from pharmaceutical and imaging companies were invited and allowed to attend the meetings as observers, but did not actively participate in the consensus development.
Classification of Atrophy Meetings and Overview of Consensus Methodology
The CAM group met on 3 occasions: June 2015, September 2015, and June 2016. To collect background information on atrophic AMD for discussion with the group, the CAM cochairs surveyed and distilled the pre-existing literature (PubMed search, using the search terms atrophy and macular degeneration and classification). Before each CAM meeting, CAM participants contributed to premeeting exercises for the purpose of identifying areas of agreement and disagreement in advance of the group meeting. Clinical vignettes comprising a multimodal imaging dataset (color fundus photograph, OCT, FAF, infrared reflectance) of eyes at different stages of early to intermediate to late AMD, as defined in part by the Beckman classification, were constructed.1 Images for these exercises were contributed by CAM participants, who were asked to provide examples documented with multimodal longitudinal imaging that reflected the spectrum of atrophy that they encountered in their clinical experiences. These cases then were assembled by the CAM co-organizers (G.S., S.R.S.) for grading by all participants. Participants were asked to review the image sets and to identify features of interest that were specified in the accompanying instructions in atrophic areas and the junctional zone with normal retina at the margins of atrophy. In addition, in cases where longitudinal data were available, participants were asked to determine the time point at which atrophy was first noted in the images.
An example of 1 of the exercise cases is shown in Figure 1. Participants were asked to indicate the presence or absence of atrophy using each of the different imaging methods, namely, CFP, fluorescein angiography, near-infrared reflectance, blue-light FAF, and spectral-domain OCT (en face and cross-sectional) independently. Subsequently, they also defined the margins of the area of atrophy on each of the various imaging methods. Exercises before the meeting were completed and returned to the meeting co-organizers, who aggregated the results for presentation at the group meetings.
Figure 1.
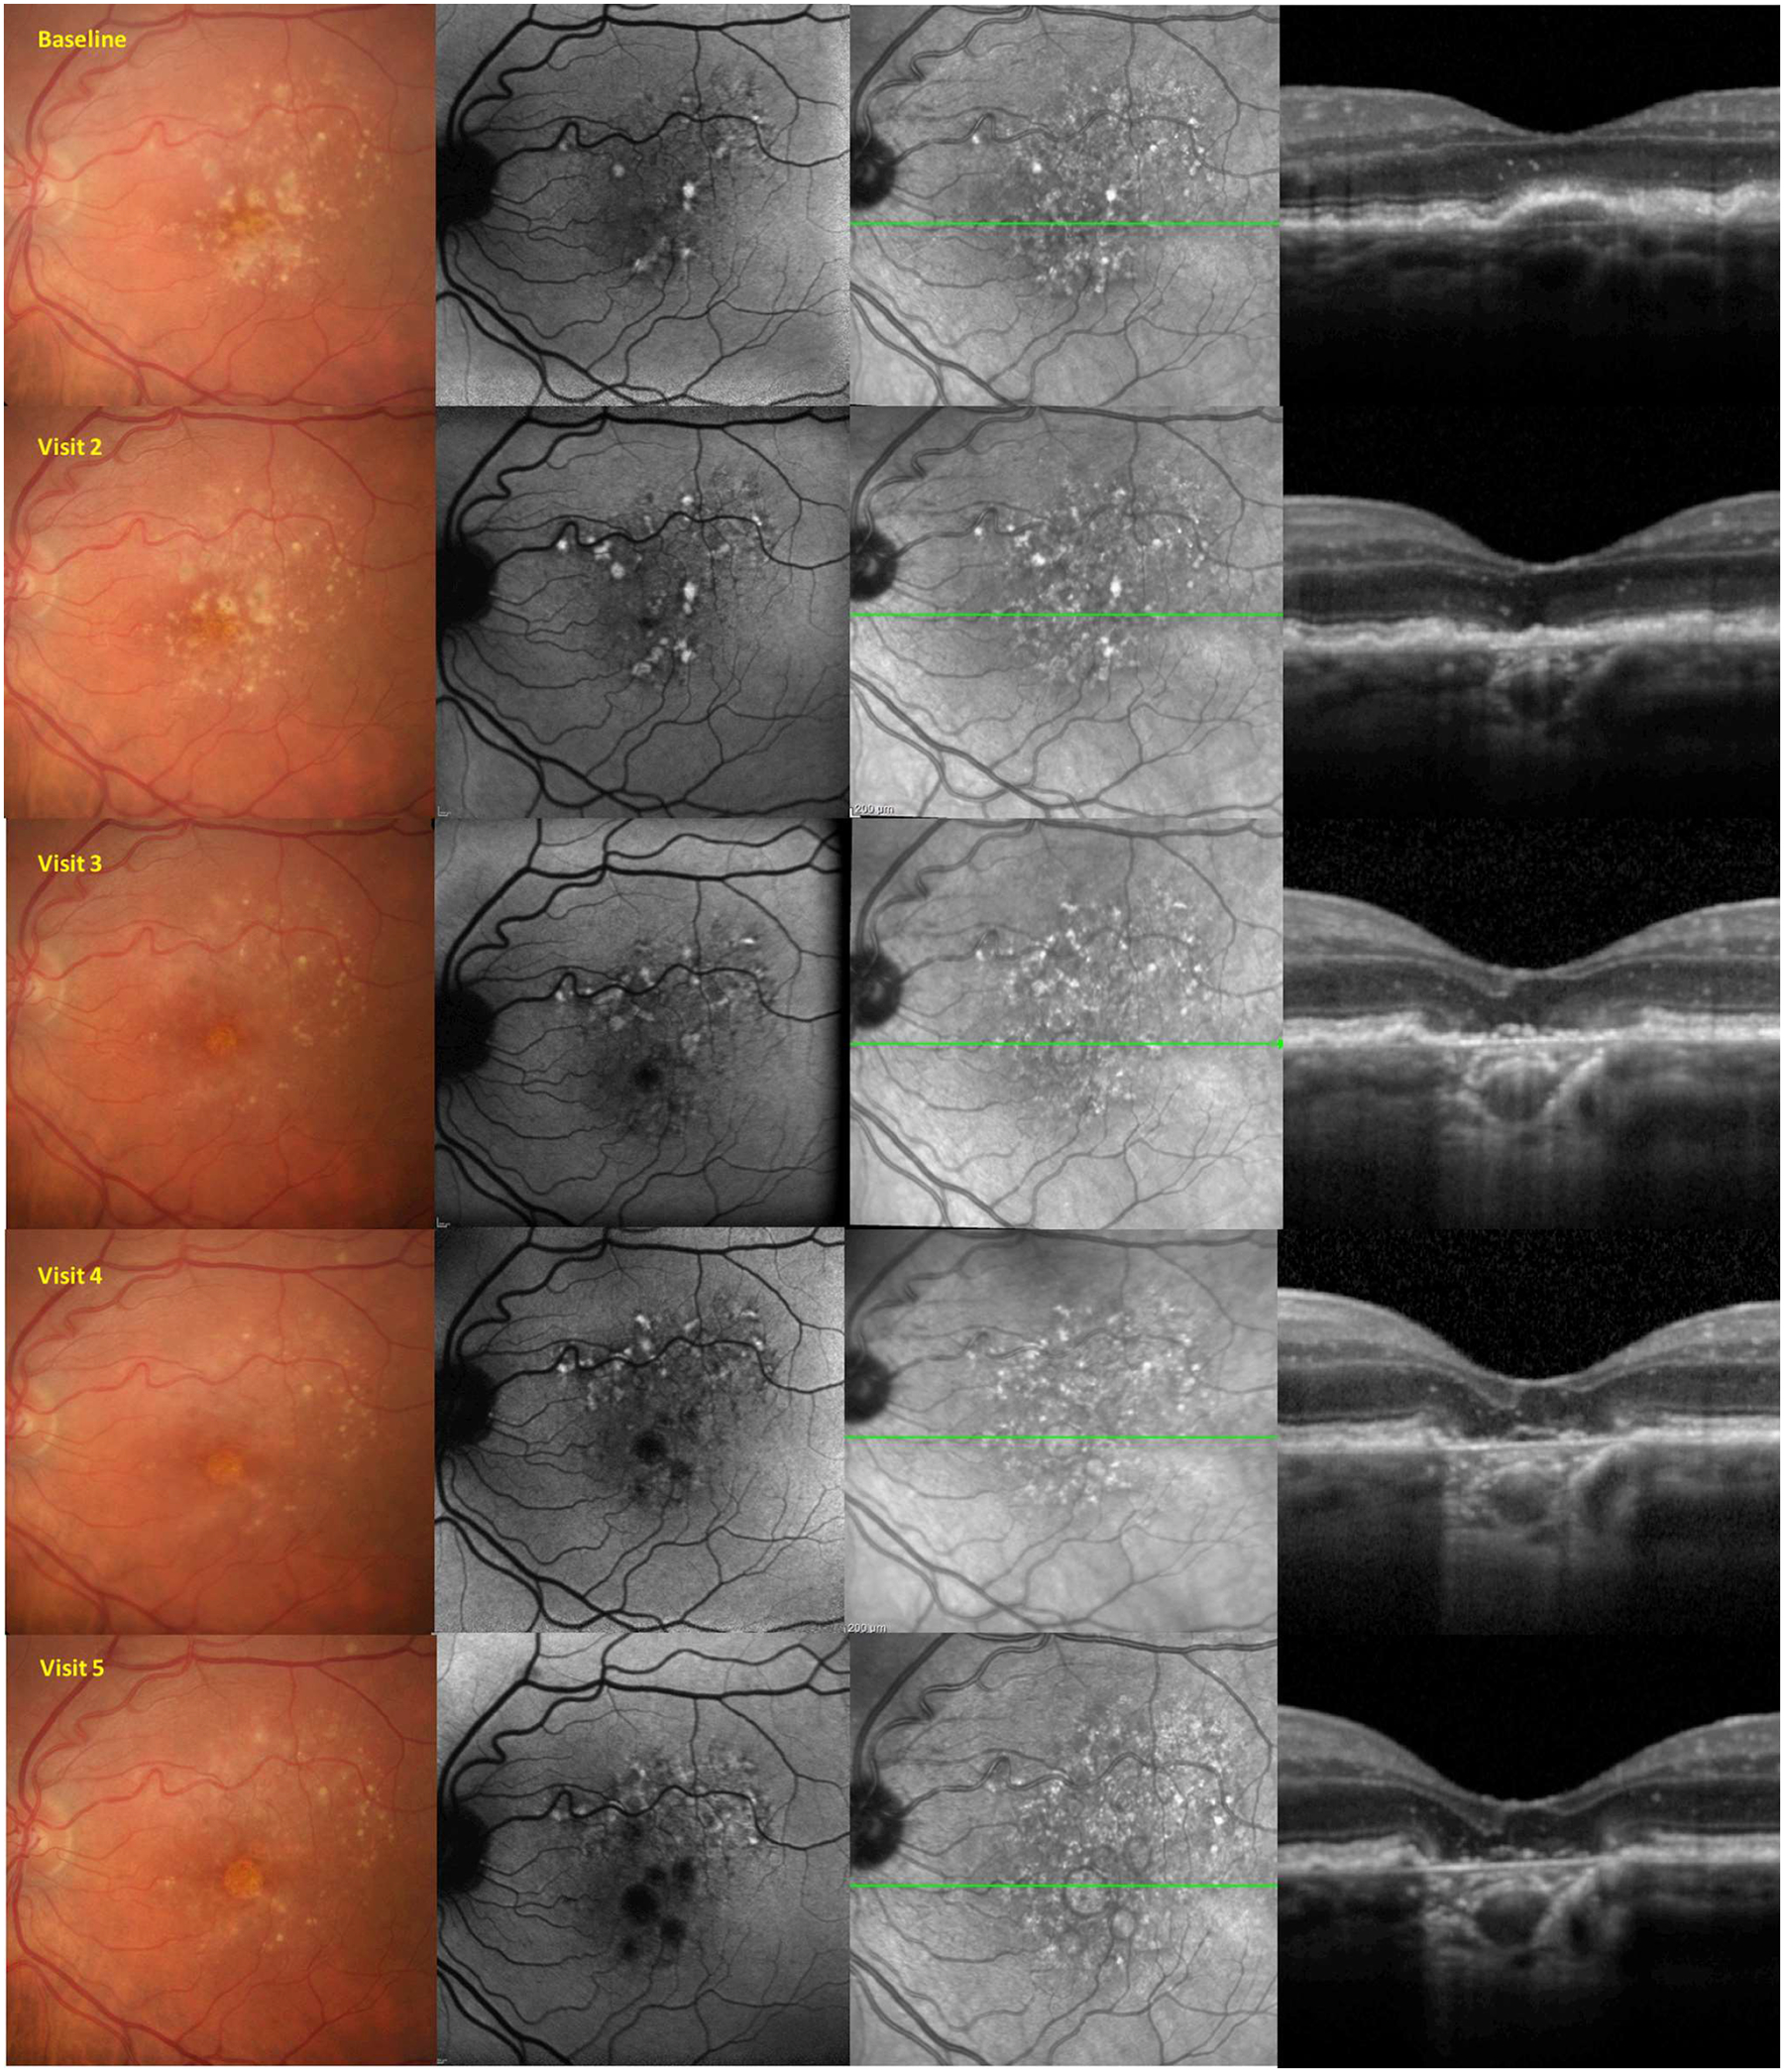
Example of a premeeting exercise distributed to the Classification of Atrophy Meetings participants. From this longitudinal multimodal imaging dataset, participants were asked to define the earliest time point at which complete atrophy and complete retinal pigment epithelium and outer retinal atrophy were present.
The format of the meetings included initial short overview lectures by individual participants summarizing the relevant literature to provide background and context for further discussions. Lecture topics included previous definitions of atrophy, histopathologic correlations of atrophy, and longitudinal natural history data on AMD lesions such as drusen and RPD or subretinal drusenoid deposits. These lectures were followed by presentation of the premeeting exercise results, which were used as a starting point for subsequent consensus discussion. The most important a priori goal for this CAM consensus effort was to define criteria for the presence of atrophy using any of the available imaging methods, as well as to determine reproducible OCT criteria for the grading and classification of atrophy. Accordingly, most of the discussion was directed to this topic. Of note, the definitions described in this report are intended to be applied in the setting of AMD, a disease associated with aging and clinically defined by the presence of medium or large drusen with or without pigmentary alterations and with or without RPD.
Results
What Is Atrophy in the Context of Age-Related Macular Degeneration?
In general use, atrophy means a shrinking or withering, particularly because of poor nutrition or disuse. In the context of AMD, the term atrophy means either loss of tissue (typically) or the irreversible attenuation of tissue.
Selection of a Base Imaging Method to Define Atrophy
Given the wide availability of multiple imaging methods to evaluate the fundus, it seems reasonable to incorporate information from multiple imaging sources to confirm the presence of atrophy. However, in such a multimodal system, we believed that it would be prudent to establish a starting point or base method and that other methods would be used to confirm the determination. The CAM participants discussed the relative merits of each of these imaging methods, and their advantages and disadvantages were summarized in CAM report 2.41 The consensus recommendation of the CAM group was that OCT should serve as the reference method for defining different atrophy phenotypes and stages. Several factors were cited for the selection of OCT: (1) visualization of specific layers affected by the disease process, (2) wide availability of this technology, (3) ease of acquisition even by unskilled operators, and (4) patient comfort. However, the CAM group recognized that OCT alone may not be sufficient in many cases, for reasons such as limited scan field (at least with current technology), better axial compared with lateral resolution for planimetric (en face) assessment of atrophy (compared with confocal scanning laser ophthalmoscopy with superior lateral resolution), and partial nonspecificity of choroidal hypertransmission of OCT signal in relation to atrophy detection. In addition, other imaging methods such as blue-light FAF may provide information over and above OCT, including prescient abnormal FAF signals that could predict future atrophy development. Thus, it was believed that a multimodal approach would be valuable, such that other imaging methods would be used to corroborate or support OCT-based observations.
General Principles to Establish Atrophy Nomenclature
With the selection of OCT as the reference method, the CAM group recognized an opportunity to define atrophy based on the specific retinal layers that are involved. Longitudinal studies have demonstrated that outer retinal atrophy, without RPE atrophy, can be observed in eyes with subretinal drusenoid deposits, which are the manifestation of RPD on OCT.25,34 However, the CAM participants agreed that loss of the RPE was associated with overlying thinning or loss of the outer retina in all cases. In addition, the CAM group recognized that the development of atrophy was a gradual complex process that evolved from earlier stages to an end stage.30,32
To address these considerations, the CAM group recommended 4 terms to describe atrophy in the context of AMD (Table 1): (1) complete RPE and outer retinal atrophy (cRORA), (2) incomplete RPE and outer retinal atrophy (iRORA), (3) complete outer retinal atrophy, and (4) incomplete outer retinal atrophy. These terms may be applied to describe atrophy in the presence or absence of choroidal neovascularization (CNV). Because the term GA has been firmly embedded in the literature for the past several decades, the CAM group proposed to retain the term and to restrict its use to atrophy in the absence of CNV (present or previous, recognizing that evidence of previous CNV may not be present in some eyes), as evident on CFP. Thus, GA would be considered a subset of the more comprehensive term cRORA, with cRORA encompassing macular atrophy both with and without associated CNV. Nascent GA was suggested to be retained as the term to describe iRORA in the absence of CNV as evident on OCT.32 The CAM group recognized that atrophy may be present in an eye with CNV, but remote (i.e., not colocalized or immediately adjacent) from the prior or present location of the CNV. Such a lesion also would be considered GA in the proposed classification. Subsequent sections of this report describe specific features or criteria for atrophy and in particular cRORA. Consensus criteria, definitions, illustrations, and suggested histologic correlates for cRORA, iRORA, complete outer retinal atrophy, and incomplete outer retinal atrophy are shown in Figure 2. These entities will be described in more detail in future CAM reports. For reference, the appearance of normal retinal layers on OCT and histologic analysis are shown in Figures S1 and S2 (available at www.aaojoumal.org), respectively.
Table 1.
Classification of Atrophy Meetings Consensus Classification of Atrophy Associated with Age-Related Macular Degeneration
| Term | Abbreviation |
|---|---|
| Complete RPE and outer retinal atrophy | cRORA |
| Incomplete RPE and outer retinal atrophy | iRORA |
| Complete outer retinal atrophy | cORA |
| Incomplete outer retinal atrophy | iORA |
RPE = retinal pigment epithelium.
Figure 2.
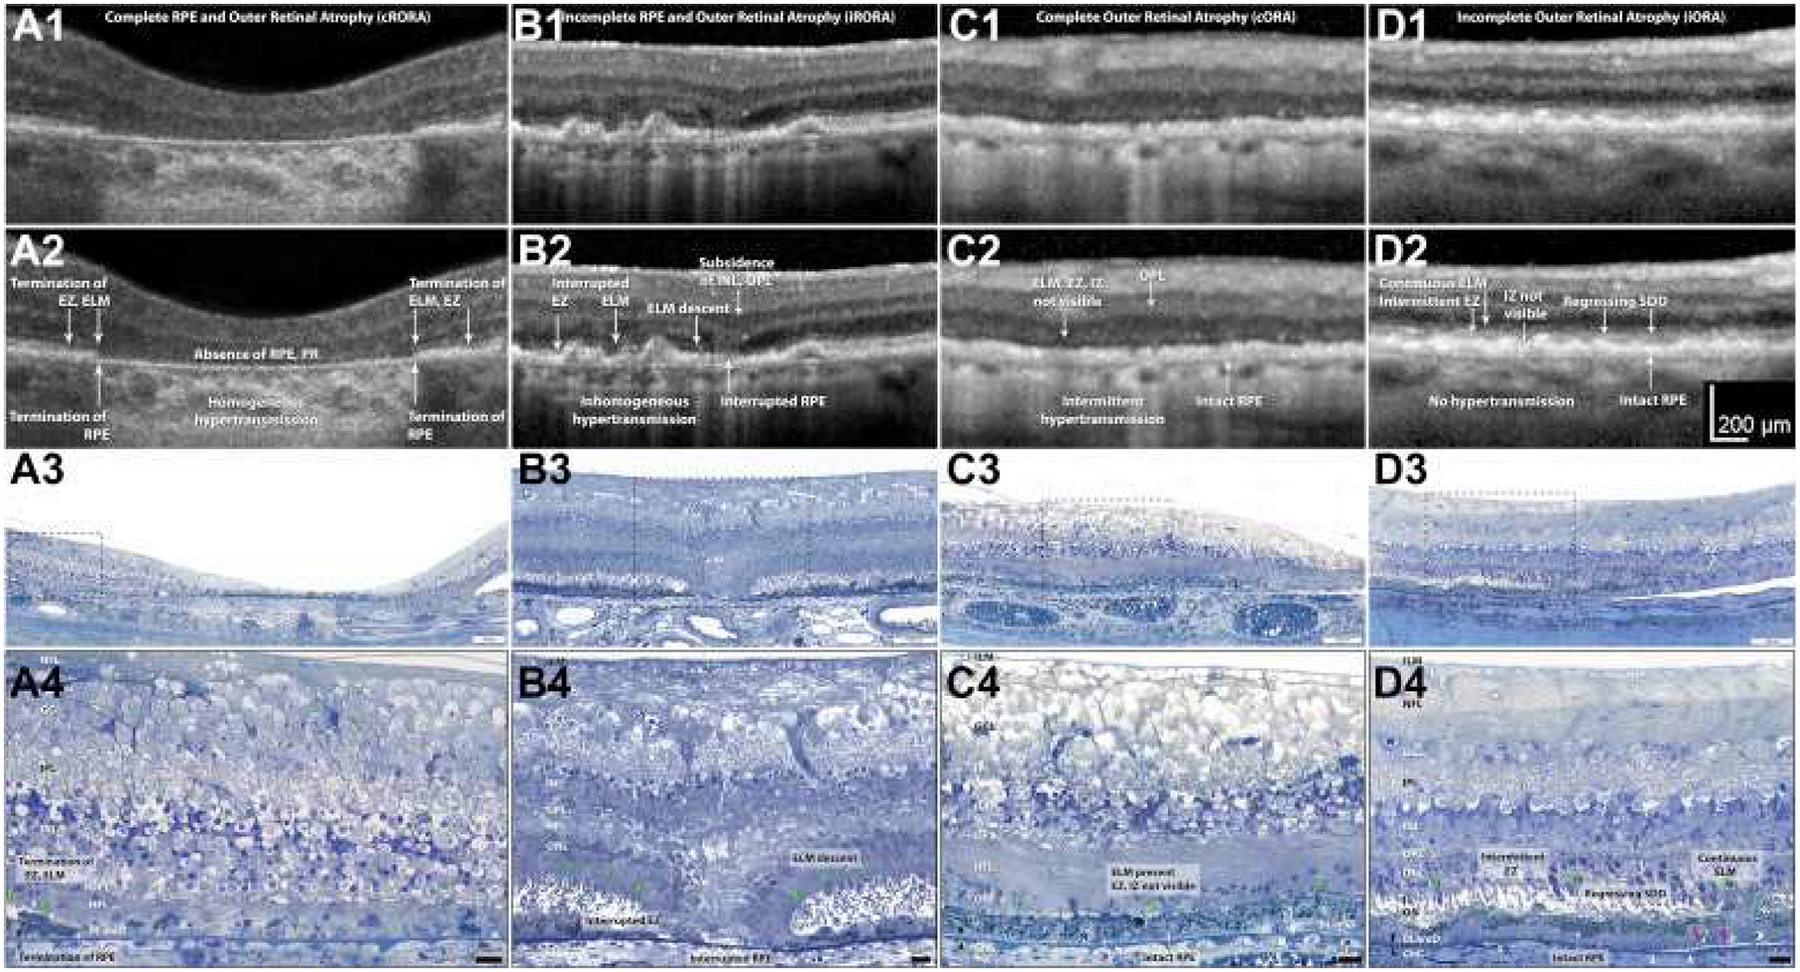
Exemplar OCT B-scans and representative corresponding histologic images demonstrating the 4 terms for atrophy defined by the Classification of Atrophy Meetings. Rows 1 and 2 show B-scans of each atrophy phenotype, without and with annotations, respectively. Rows 3 and 4 show histologic images of different eyes (i.e., not those in the B-scans) at medium and high magnification, respectively. Nomenclature and annotations are given below. OCT scans and photomicrographs of normal retinas are available in Figures S1 and S2 (available at www.aaojoumal.org), respectively; methods for histologic examination and photomicroscopy are in Figure S2 (available at www.aaojoumal.org). A, Images obtained from an 83-year-old white woman. A1, A2, Complete retinal pigment epithelium (RPE) and outer retinal atrophy (cRORA) is defined by a zone of homogeneous choroidal hypertransmission and absence of the RPE band measuring 250 μm or more with overlying outer retinal thinning and loss of photoreceptors (PR). No signs of an RPE tear are evident. Terminations of the external limiting membrane (ELM), ellipsoid zone (EZ), and RPE are indicated. A3, A4, In a region of fovea and parafovea measuring 1 mm or more in diameter, RPE cells are absent, with some dissociated RPE cells remaining.42 Complete loss of photoreceptors is shown, that is, the outer nuclear layer (ONL), ELM, inner segment (IS), and outer segment (OS) are not apparent. The Henle fiber layer (HFL) in the atrophic zone consists primarily of Muller cell fibers that do not make an ELM among themselves. B, Images obtained from an 87-year-old white man. B1, B2, For incomplete RPE and outer retinal atrophy (iRORA), some hypertransmission is evident but is discontinuous; the RPE band is present but irregular or interrupted. Interrupted ELM and EZ evidences photoreceptor degeneration. The inner nuclear layer (INL) and outer plexiform layer (OPL) exhibit subsidence. Criteria for cRORA are not met. B3, B4, The ELM descends in 2 curved lines (green arrowheads). The ONL, HFL, OPL, and INL subside in parallel to the ELM, creating a funnel. The RPE layer is interrupted. The IS are short, and the OS are absent near the ELM descent. C, Images from an 88-year-old-white woman. C1, C2, Complete outer retinal atrophy (cORA) is defined by continuous nonvisibility of the EZ and interdigitation zone (IZ) and severe thinning of the outer retina, in the setting of an intact RPE band. Hypertransmission associated with RPE degeneration is intermittent. C3, C4, The RPE layer largely is intact, although individual cells are dysmorphic. The OS and IS are completely absent. The ONL is thin or interrupted, with several clumps of RPE-derived material, and the ELM is intact. The HFL contains fibers of Müller cells and some photoreceptors. D, Images from an 85-year-old white woman. D1, D2. Incomplete outer retinal atrophy (iORA) demonstrating continuous ELM and detectable EZ disruption in the setting of regressing subretinal drusenoid deposits (SDD), with detectable thinning of the outer retina, an intact RPE band, and no hypertransmission. D3, D4, The RPE layer largely is intact, although individual cells are dysmorphic. Some isolated subretinal drusenoid deposits (Regressing SDD) are present above the RPE, but OS and IS remain.43 The ONL is depopulated with intact ELM and pale-staining reactive Muller processes between the photoreceptor nuclei. Photoreceptors span layers OPL, HFL, ONL, IS, and OS. Muller cells span the internal limiting membrane (ILM) to ELM. In naming the OPL and HFL, we use the OCT designations40 while recognizing that a commonly used neurobiological nomenclature44 divides the OPL into 2 sublayers (photoreceptor synaptic terminals and bipolar or horizontal cell dendrites) and combines these with the HFL into 1 “OPL.” White arrowheads = calcified Bruch’s membrane; pink arrowheads = basal mounds; X = artifactual wrinkle; black arrowheads = Bruch’s membrane; green arrowheads = ELM. BLamD = basal laminar deposit; ChC = choriocapillaris; GCL = ganglion cell layer; IPL = inner plexiform layer; NFL = nerve fiber layer. Figure prepared by M. Li and J. D. Messinger.
Lexicon for Atrophy Features Visible on OCT (OCT Anatomic Biomarkers of Atrophy)
Through the premeeting exercises, participants were asked to provide labels to findings visible on OCT B-scans passing through regions of potential atrophy. Figure 3 provides an example of a premeeting exercise B-scan with consensus labels for various features shown. A commonly described OCT feature associated with atrophy is the presence of increased transmission of signal below the level of the RPE and into the choroid resulting from loss of scatter or attenuation from overlying RPE and neurosensory retina. A variety of terms were proposed by CAM participants from the premeeting exercises including sub-RPE illumination, choroidal hyperreflectivity, and hypertransmission. Through discussion, CAM participants agreed that the term hypertransmission was the preferred term because it conveyed the cause for the observed phenomenon and acknowledged that the hypertransmission may not always penetrate to the underlying choroid in eyes with tall pigment epithelial detachments (PEDs). Another common feature was a persistent hyperreflective line within the bed of atrophy, but significantly thinner than the adjacent RPE—Bruch’s membrane band. This line was termed persistent basal laminar deposit in early pathologic studies and recently was shown to be visible on OCT.12,45–47 Histopathologic analysis demonstrated that a few dissociated RPE cells are also present in regions of persistent basal laminar deposit, as well as subducted RPE, shed RPE granules, processes of Müller cells, and avascular fibrosis.
Figure 3.
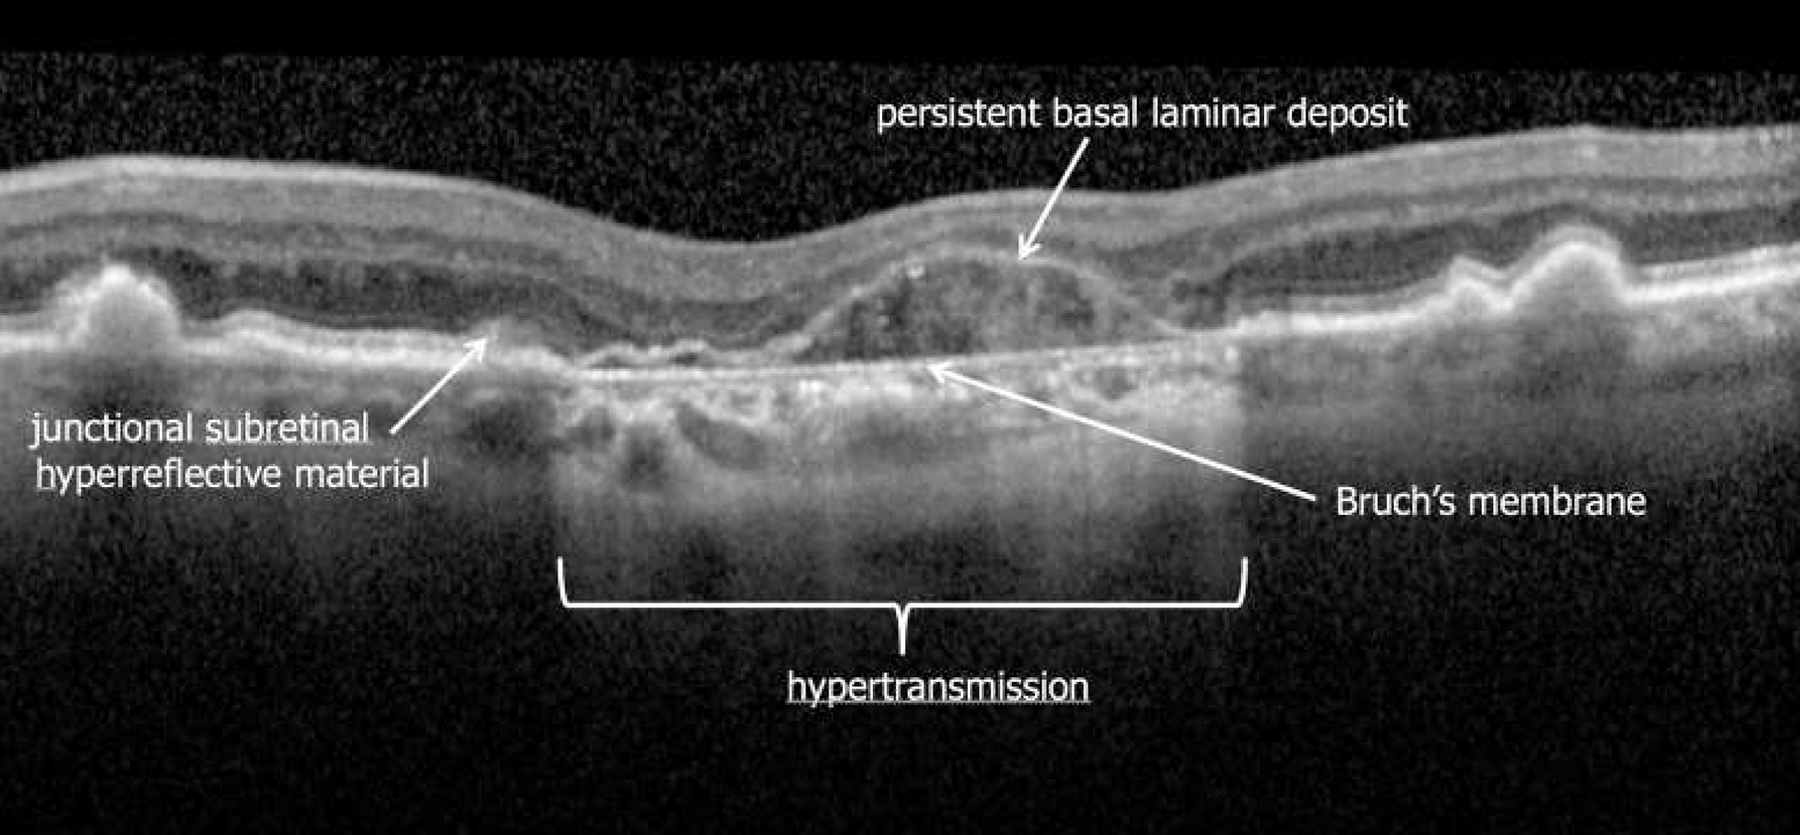
Example of a premeeting exercise distributed to the Classification of Atrophy Meetings (CAM) participants. Arrows were used to mark specific features on images (in this case an OCT B-scan) for which participants were asked to provide specific terms or labels. Consensus labels for 4 specific features after discussions at CAM are shown in this illustration. Note the thinning of the outer retina over the persistent basal laminar deposit band.45,46
Minimum OCT Criteria for Presence of Complete Retinal Pigment Epithelium and Outer Retinal Atrophy
A set of longitudinal cases with multimodal imaging that featured progression from intermediate AMD to late AMD was the primary tool used to establish criteria for cRORA, as illustrated in Figure 1. As noted above, participants were asked to assess for the development of atrophy on the OCT B-scans and to use other methods as needed to assist in questionable cases. Because each CAM participant designated (in a masked fashion) the time point or visit for initial identification of cRORA for each case, it was possible to establish the earliest time point when most participants believed cRORA was present (Fig 3). In many cases, a relatively long interval was noted between the time point at which at least 1 CAM participant and the time point at which all participants finally indicated that cRORA had first developed. Such a long interval indicated that individual CAM participants used different criteria or features when establishing the presence of atrophy. To progress toward a consensus, images from the time point for each case at which at least 60% of participants deemed atrophy was present were aggregated. The cutoff point of 60% was chosen arbitrarily because it was intended simply to generate a basis for subsequent discussion. However, aggregating the OCT images from these time points across all cases (Figs 4, 5) allowed the common features or minimum criteria for atrophy to be determined more easily.
Figure 4.
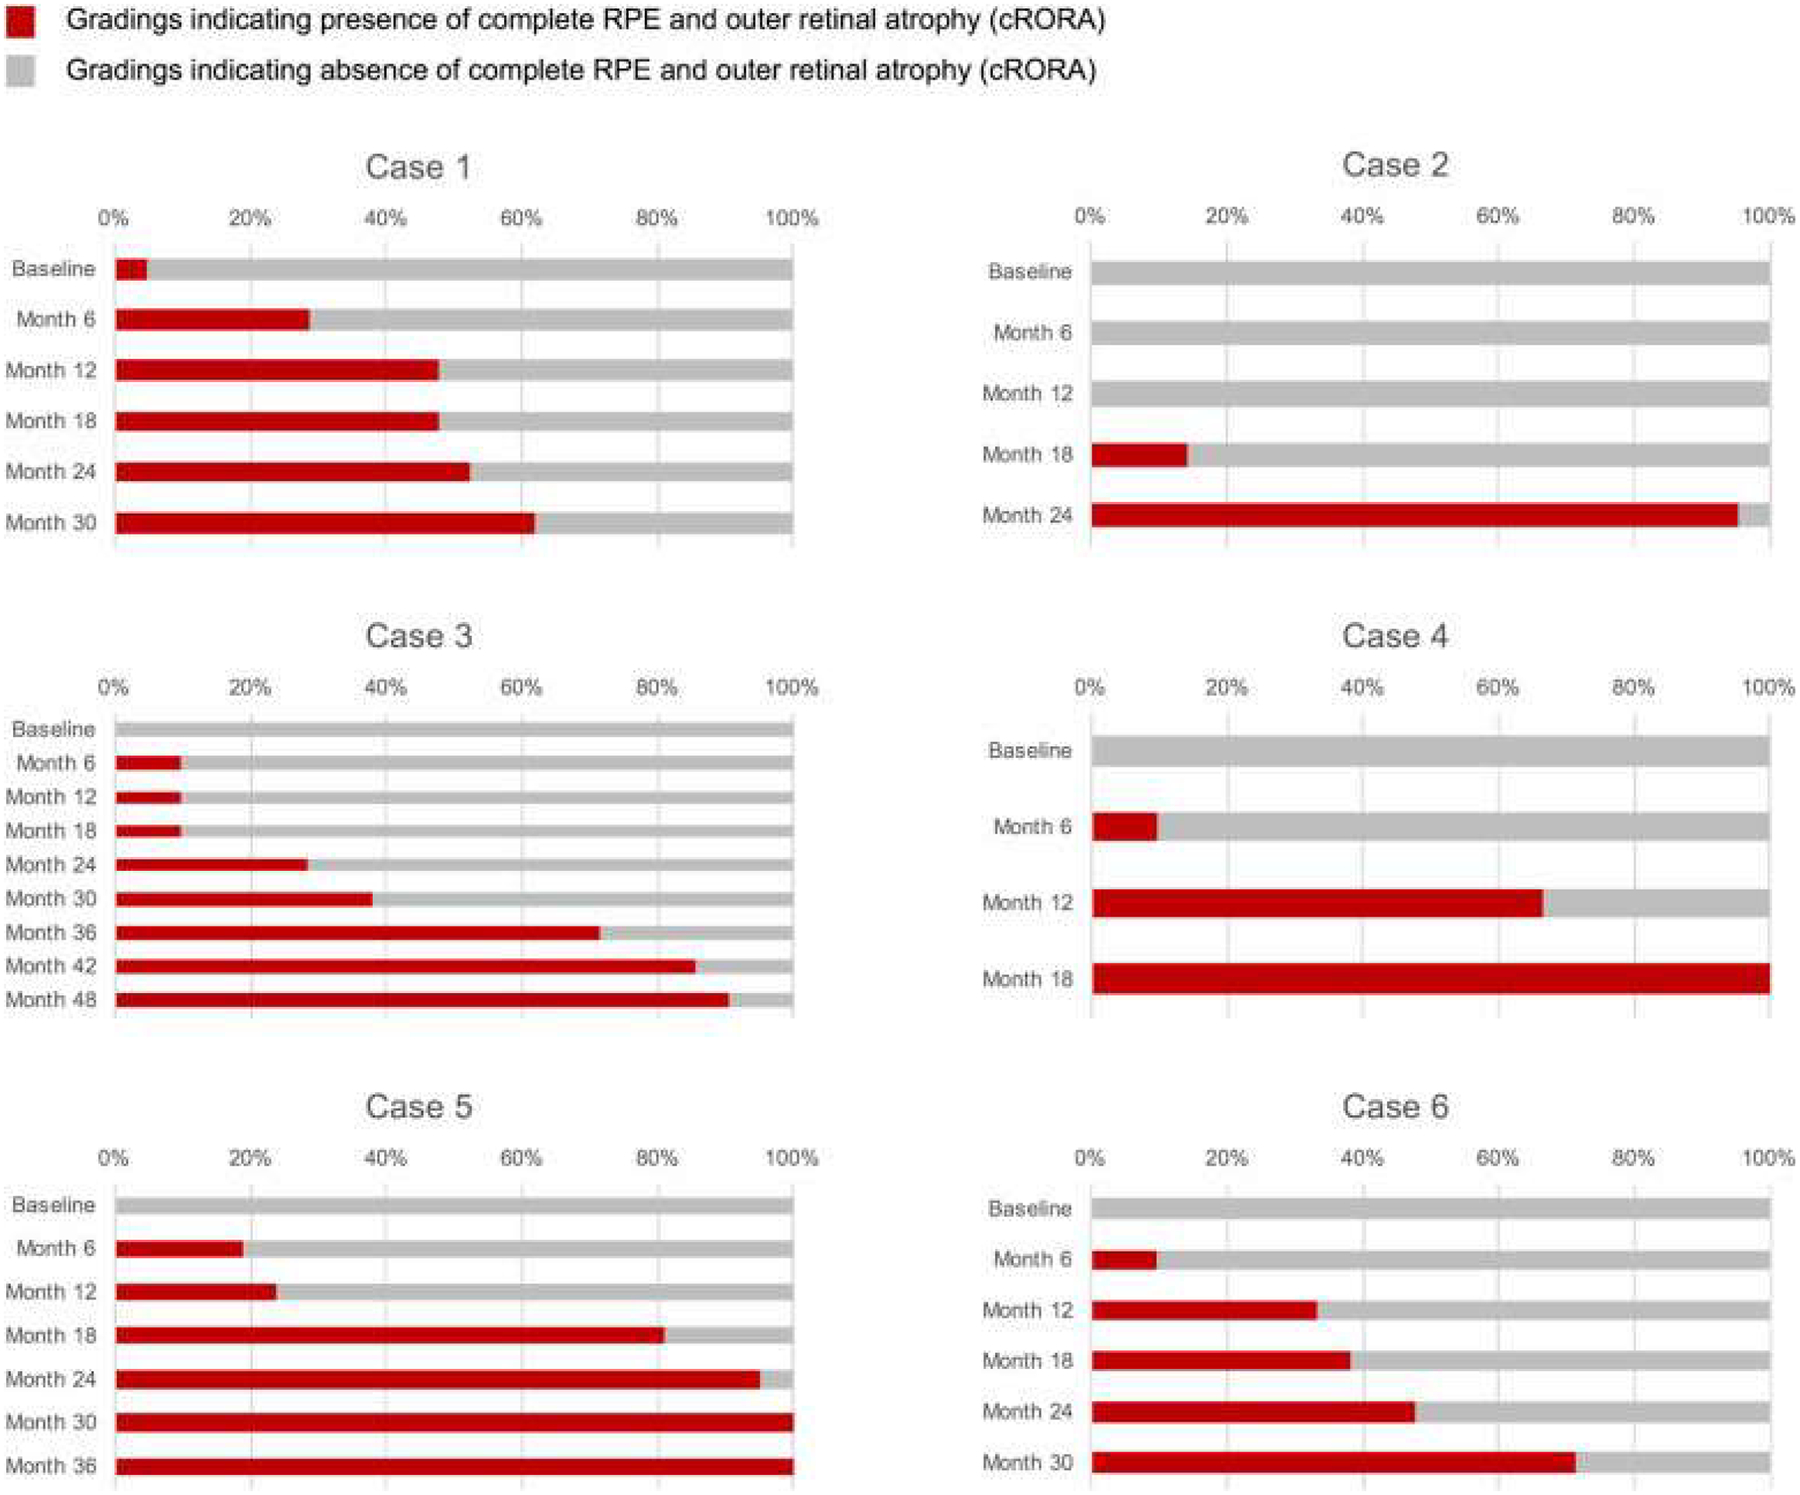
Cumulative frequency of Classification of Atrophy Meetings (CAM) participants indicating that the complete retinal pigment epithelium (RPE) and outer retinal atrophy (cRORA) had been achieved for 6 patients with multimodal imaging. For each patient, each row represents 1 visit or time point, with the baseline visit at the top and the final visit at the bottom. The length of the bar indicates the percentage of CAM participants who deemed the cRORA end point was present on the OCT images for that visit. Note for patient 2, only 6 months elapsed between when at least 1 CAM participant determined that cRORA was present and the vast majority believed that it was present. In other patients, the interval was considerably longer, highlighting initial disagreement among participants regarding the criteria used for establishing presence of atrophy on OCT.
Figure 5.
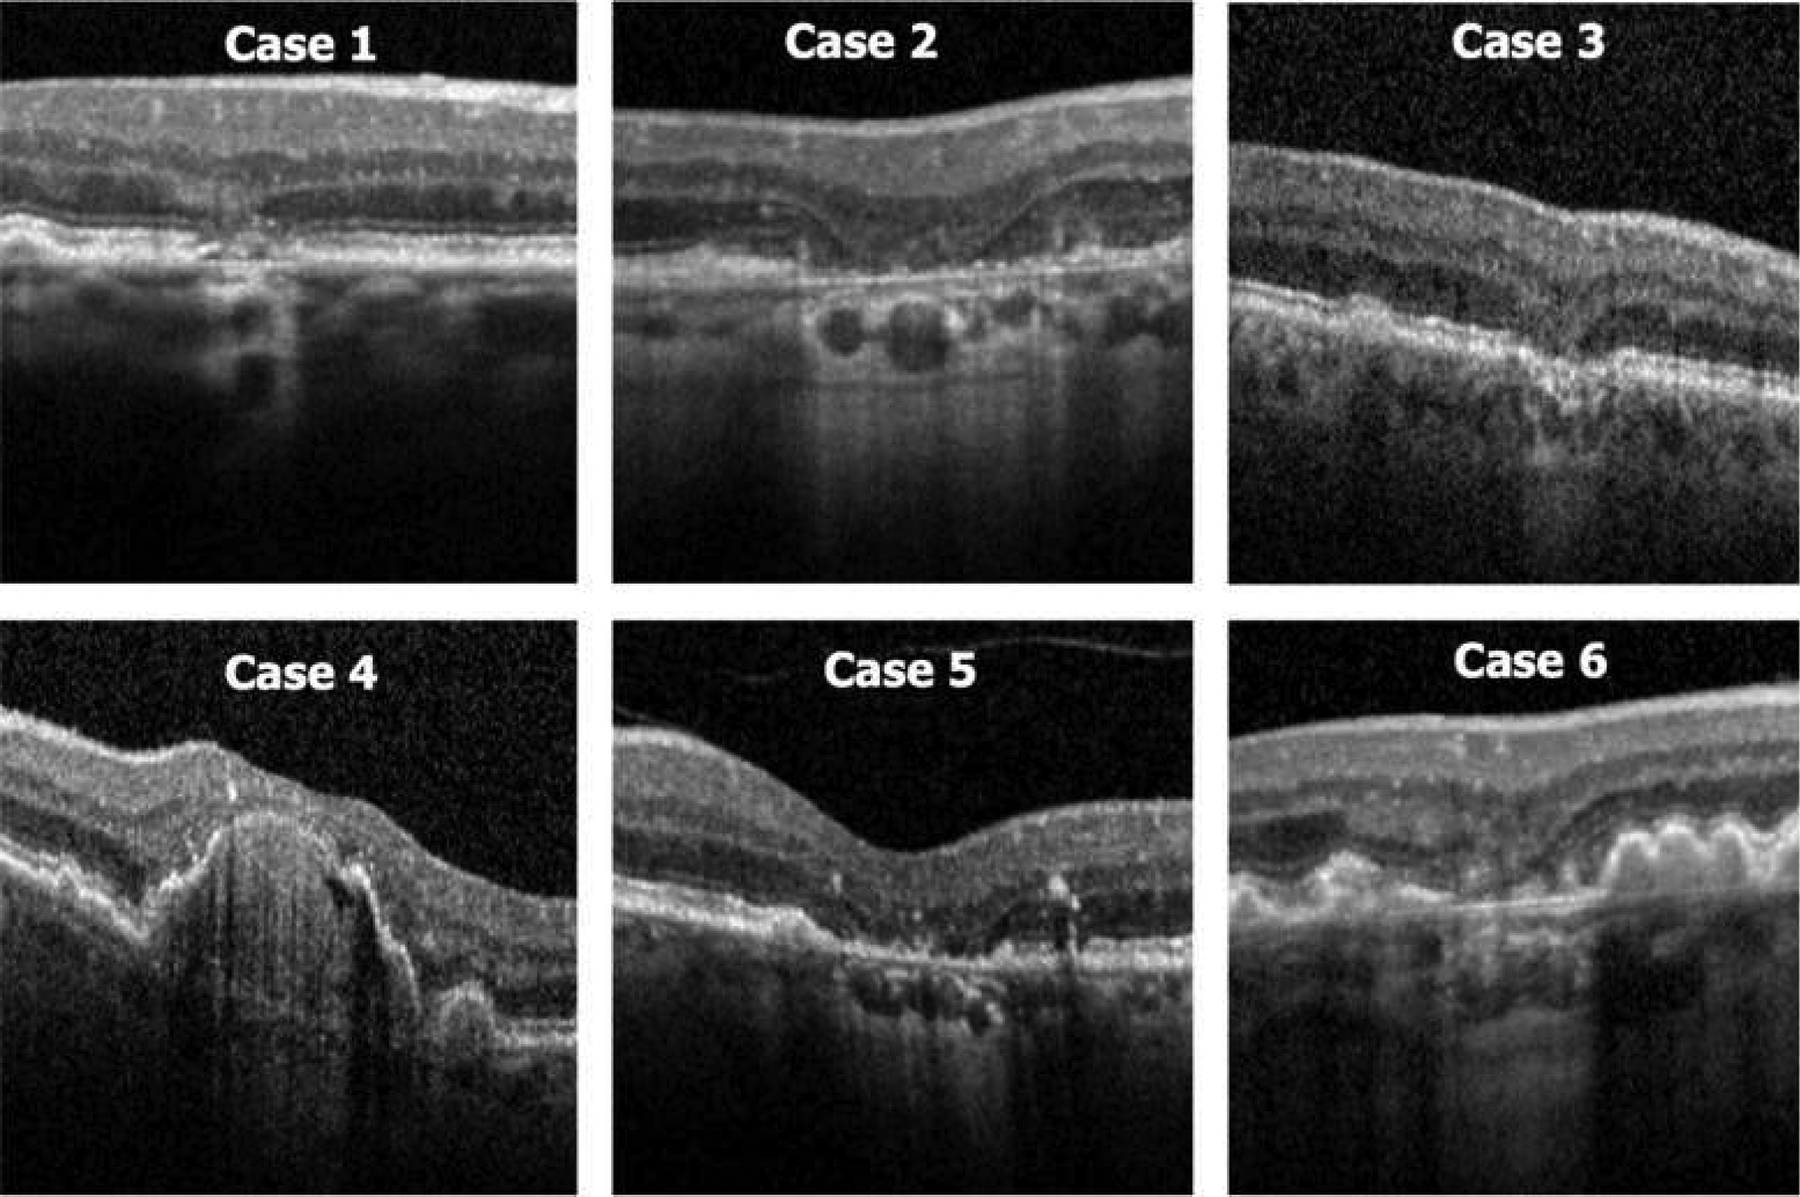
Montage of the OCT images for the 6 patients shown in Figure 4 at the first time point at which at least 60% of Classification of Atrophy Meetings participants determined that complete retinal pigment epithelium (RPE) and outer retinal atrophy (cRORA) was present. Patients 2 and 5 most clearly illustrate the typical features of cRORA, with choroidal hypertransmission and attenuation of the RPE band with thinning of the overlying retina in a region exceeding 250 μm in diameter.
Classification of Atrophy Meetings Consensus OCT Definition for Complete Retinal Pigment Epithelium and Outer Retinal Atrophy
After review and discussion of these cases, the CAM group proposed a set of 3 inclusive and 1 exclusive criteria to establish the presence of cRORA on OCT. All criteria are required to designate a lesion as cRORA. The inclusive criteria are: (1) region of hypertransmission of at least 250 μm in diameter in any lateral dimension, (2) zone of attenuation or disruption of the RPE of at least 250 μm in diameter, and (3) evidence of overlying photoreceptor degeneration. Features of photoreceptor degeneration include all of the following: loss of the interdigitation zone, ellipsoid zone, and external limiting membrane and thinning of the outer nuclear layer. The key exclusion criteria are the presence of scrolled RPE or other signs of an RPE tear, because areas of RPE and eventual photoreceptor loss resulting from an RPE tear were not judged to constitute cRORA.
Confirmatory Classification of Atrophy Meetings Criteria for Complete Retinal Pigment Epithelium and Outer Retinal Atrophy on Planar Imaging Methods
Although the CAM group designated OCT as the reference method to define cRORA, it recognized that in clinical practice, many patients will show questionable or borderline features. In such cases, the CAM group proposes that information from other imaging methods (color imaging, FAF, near-infrared reflectance, multicolor imaging) should be used to assist the OCT interpretation whenever available. Because there are well-established definitions of GA in the literature for color photographs and for atrophy on FAF imaging, the CAM group agreed that only minor modifications (based on new size criteria from OCT) were needed. These criteria are summarized in Table 2 and are used as an adjunct to OCT for confirmatory purposes.
Table 2.
Criteria for Diagnosis of Complete Retinal Pigment Epithelium and Outer Retinal Atrophy on Optical Coherence Tomography and Confirmatory Findings on Other Imaging Methods
| Optical Coherence Tomography | Fundus Autofluorescence | Near-Infrared Reflectance | Color/Multicolor |
|---|---|---|---|
| Zone of hypertransmission of ≥250 μm | Sharply demarcated borders | Sharply demarcated borders | Sharply demarcated borders |
| Zone of attenuation or disruption of RPE band of ≥250 μm | Hypoautofluorescent: black level similar to optic nerve head or retinal blood vessels* | Hyperreflective | Hypopigmentation |
| Evidence of overlying photoreceptor degeneration whose features include ONL thinning, ELM loss, and EZ or IZ loss | Diameter, ≥250 μm (area, 0.05 mm2) | Diameter, ≥250 μm (area, 0.05 mm2) | Increased visibility of choroidal vessels |
| Exclude: scrolled RPE or other signs of RPE tear | Exclude: macular pigment or other artifact | Exclude: artifact | Diameter, ≥250 μm (area, 0.05 mm2) |
ELM = external limiting membrane; EZ = ellipsoid zone; IZ = interdigitation zone; ONL = outer nuclear layer; RPE = retinal pigment epithelium.
If trickling junctional autofluorescence pattern is present or refractile drusen deposits or residual debris are present in bed of atrophy, lesion can appear grey rather than black.
Discussion
Through the CAM program, a consensus nomenclature and definition for atrophy based on OCT imaging was proposed. The intention of the program was to develop a system that could be used by practitioners for assessing and counseling their patients with AMD. Using OCT findings to define the earliest anatomic changes that portend the future development of atrophy are highly relevant for interventions applied early in the disease process and certainly will accelerate interventional clinical trials aiming to slow progression to atrophy.2,48,49 Indeed, this desire was a key rationale for the CAM group to define both complete and incomplete RORA (iRORA, to be described further in future reports). These areas of iRORA are presumed to represent changes that portend development of cRORA. Although one might expect to have a dense scotoma if it were possible to test only the area of cRORA, one might expect that areas of iRORA would retain some degree of retinal sensitivity (relative scotoma). Loss of fine discriminant acuity with retention of local light perception is functionally detrimental to visual function in any case, and may occur on a background of impaired rod-mediated vision early in the disease process. Ultimately, we may find that it is more effective to intervene at the iRORA stage to alter the natural course of progression to atrophy than to wait for cRORA to develop. Indeed, the rate of progression from iRORA to cRORA may prove to be a useful outcome measure in future trials. This of course will require validation in longitudinal studies.
However, this CAM report focuses on criteria for what one might term end-stage atrophy, the time point associated with irreversible changes associated with an eventual development of a dense scotoma. The complete loss of photoreceptors and RPE, as defined in cRORA, is a reproducible measure that will be critical for clinical trials aimed to prevent atrophy. With regard to the OCT criteria for cRORA, the CAM group focused on extracting criteria from the OCT B-scans. The possibility of using en face OCT slabs alone was discussed at length, because hypertransmission is well seen on OCT slabs through the choroid. In fact, commercial OCT algorithms exist to quantify these regions of hypertransmission on OCT images as a potential surrogate for atrophy. However, hypertransmission alone was not deemed to be a sufficient criterion to define cRORA, although it was acknowledged potentially to serve as a rapid and convenient screening tool for the identification of potential areas of cRORA. The CAM participants noted that in some cases, hypertransmission could be present with a depigmented but otherwise intact RPE band and without definite photoreceptor degeneration. Thus, although hypertransmission on en face OCT may be useful for identifying potential candidate regions of cRORA, these regions would need to be confirmed by inspection of the relevant B-scans to ensure that the other criteria for cRORA also are present. The CAM group also agreed that other imaging methods, such as FAF, are of benefit in confirming the presence of atrophy on OCT in more uncertain cases. However, further analyses to correlate FAF changes spatially to the 4 different categories of atrophy are still required. At this stage, it remains unclear whether severely reduced FAF (which has been used to define atrophy in many clinical trials) would be correlated exclusively with a single category of OCT-defined atrophy or if certain variations might be present.
Another point of considerable discussion was the size requirement of 250 μm needed to define cRORA. Several CAM participants suggested a smaller threshold of 125 μm, because this represented the minimum size of a large druse, and the collapse of large drusen is known to be associated with the development of atrophy. Review of minimum size criteria used by reading centers to denote atrophy on non-OCT imaging methods revealed a wide range of sizes from a minimum of 175 μm for FAF imaging to 433 μm (AREDS 2 circle 12) for CFP.19,50 Limited unpublished existing reading center criteria were available to the group and suggested that lesions at least 250 μm in diameter could be graded reliably on OCT. In the absence of better data, the CAM group believed that the most reasonable and conservative cutoff to use at present was a 250-μm extent to define cRORA. The group acknowledged that this size threshold may need to be revised as reading centers and research groups adopted the definition and evaluate its repeatability in large datasets.
In a previous report from the CAM group, we reviewed the origins and the basis for the term GA.4 Based on that review, it was unclear how the term geographic was chosen and whether this was the best term to describe atrophy. Replacement of the term GA with the proposed CAM-derived term cRORA therefore was considered to unify the AMD lexicon, but the CAM group believed strongly that the term GA was too firmly entrenched in the literature and clinical care to be dismissed. Rather, we propose that GA be retained and its use limited to atrophy in AMD, in the absence of CNV and evident on CFP, just as it has been to date (although GA clearly is a subset of cRORA as defined on OCT). In the presence of CNV (present or prior), only the more general term cRORA should be used when observed on OCT, and the term macular atrophy should be used when observed clinically or on CFP.
In summary, the CAM group has proposed an extended classification for AMD based on OCT changes that signify the evolution of the atrophic process. We introduce 4 new terms—cRORA, iRORA, complete outer retinal atrophy, and incomplete outer retinal atrophy—and specific OCT criteria for cRORA are elaborated in this report. We present the definitions and terminology of this classification system because the adoption by the international community of a common nomenclature with increased granularity has many advantages. Doing so will permit pooling of data from longitudinal studies and clinical trials to define better risk factors for progression and the best therapeutic strategies. We believe that this report is particularly timely because there are a large number of ongoing prospective studies pertinent to this topic. Feedback from such longitudinal studies will allow further refinement and optimization of these definitions and estimates of long-term risk of vision loss to be established. Ultimately, validation is needed to make these structural end points acceptable to regulatory authorities.
Supplementary Material
Financial Disclosure(s):
The author(s) have made the following disclosure(s): S.R.S.: Consultant – Allergan, Iconic Therapeutics, Novartis, Thrombogenics, Genentech, Centervue, Heidelberg Engineering; Research support – Optos, Carl Zeiss Meditec, Allergan; Research Instruments – Optos, Carl Zeiss Meditec, Nidek, Centervue, Heidelberg Engineering
R.G.: Financial support – Novartis, Bayer, Genentech
F.G.H.: Financial support – Heidelberg Engineering, Optos, Zeiss, Novartis, Bayer Healthcare, Genentech, Acucela, Boehringer Ingelheim, Alcon, Allergan
S.S.-V.: Financial support – Novartis, Bayer Healthcare, Genentech, Acucela, Alcon, Allergan, Heidelberg Engineering, Formycon/Bioeq; Nonfinancial support — Optos, Heidelberg Engineering, Carl Zeiss Meditec
C.A.C.: Financial support – Hoffman-LaRoche, Heidelberg Engineering, Regeneron, Novartis, Unity, Janssen Cell Therapy
F.B.: Financial support – Novartis, Bayer; Nonfinancial support – Allergan, Heidelberg Engineering
U.C.: Financial support – Novartis, Bayer, Allergan, Heidelberg Engineering, Zeiss
K.C.: Financial support – Genentech, Regeneron, Heidelberg Engineering, Santen, Ophthotech, Acucela, GSK, Roche, Allergan; Other — Ophthotech
R.D.: Financial support – Allergan, GSK, Thrombogenics, KangHong, Ionis; Equity owner — EyeKor, Inc; Employee – EyeKor, Inc
M.F.: Financial support – Heidelberg Engineering, Optos, Novartis, Bayer, Genentech, Roche; Nonfinancial support: Zeiss Meditech, Heidelberg Engineering, Optos; Patent pending – US20140303013 A1
K.B.F.: Consultant – Heidelberg Engineering, Optovue, Optos, Spark Therapeutics; Financial support – Genentech/Roche
G.J.J.: Consultant – Heidelberg Engineering
S.L.: Financial support – Heidelberg Engineering, Carl Zeiss Meditec, Novartis, Allergan, Bayer; Nonfinancial support – Heidelberg Engineering, Carl Zeiss Meditec
J.M.M.: Financial support – Eyerisk Consortium 2020, Novartis, Bayer, Alcon, Roche, Ophthotech; Consultant – Novartis, Bayer, Alcon, Roche, Genentech; Equity owner – Ophthotech, Notalvision
D.P.: Consultant – Novartis, Bayer; Clinical study participation – Roche, Novartis, Bayer
P.J.R.: Research support – Astellas Institute for Regenerative Medicine (AIRM), Carl Zeiss Meditec, Genentech, Tyrogenex; Consultant – Acu-cela, Apellis, Boehringer-Ingelheim, Carl Zeiss Meditec, Cell Cure Neurosciences, Chengdu Kanghong Biotech, Isarna Therapeutics, Genentech, Healios K.K., Hemera Biosciences, F. Hoffmann-La Roche Ltd., Ocudyne, Ocunexus, Tyrogenex, Unity Biotechnology; Equity Interest – Apellis, Digisight, Ocudyne
D.S.: Consultant – Genentech, Optovue, Bayer, Novartis; Financial support – Allergan, Genentech, Heidelberg Engineering, Regeneron, Optovue, Optovue; Lecturer – Optovue
R.F.S.: Consultant – Topcon Medical Systems, Heidelberg Engineering; Royalties – Topcon Medical Systems, DORC
R.T.: Financial support – Alcon, Allergan, Alimera, Novartis, Bayer, B+L, FCI, Zeiss, Thromgenics, Genentech, Roche; Nonfinancial support – Alcon, Allergan, Novartis, Bayer, B+L, Zeiss
A.T.: Financial support – Novartis, Roche, Bayer Healthcare, Genentech, Allergan, Alcon, Heidelberg Engineering
S.W.: Financial support – Allergan, Bayer, Novartis; Other – Zeiss, Heidelberg Engineering, Optos
G.S.: Financial support – Heidelberg Engineering, Zeiss Meditec, Optovue, Optos, Centervue, Nidek, Novartis, Bayer; Other – Heidelberg Engineering, Zeiss Meditec, Optos, Centervue, Novartis, Bayer, Boeheringer, Allergan, Alcon
Acquisition of human donor eyes and the Project MACULA web site were supported by the National Institutes of Health, Bethesda, Maryland (grant nos.: R01EY06019 and P30 EY003039 [C.A.C.]); EyeSight Foundation of Alabama (C.A.C.); International Retinal Research Foundation (C.A.C.); the Edward N. and Della L. Thome Foundation (C.A.C.); the Arnold and Mabel Beckman Initiative for Macular Research (C.A.C.); and Research to Prevent Blindness, Inc, New York, New York (C.A.C.). Supported by the Lowy Research Medical Institute (travel grant, A.C.B.).
Abbreviations and Acronyms:
- AMD
age-related macular degeneration
- CAM
Classification of Atrophy Meetings
- CFP
color fundus photography
- CNV
choroidal neovascularization
- cRORA
complete retinal pigment epithelium and outer retinal atrophy
- FAF
fundus autofluorescence
- GA
geographic atrophy
- iRORA
incomplete retinal pigment epithelium and outer retinal atrophy
- RPD
reticular pseudodrusen
- RPE
retinal pigment epithelium
Footnotes
Supplemental material available at www.aaojoumal.org.
HUMAN SUBJECTS: No human subjects were included in this study.
References
- 1.Ferris FL 3rd, Wilkinson CP, Bird A, et al. Clinical classification of age-related macular degeneration. Ophthalmology. 2013;120:844–851. [DOI] [PMC free article] [PubMed] [Google Scholar]
- 2.Holz FG, Strauss EC, Schmitz-Valckenberg S, van Lookeren Campagne M. Geographic atrophy: clinical features and potential therapeutic approaches. Ophthalmology. 2014;121:1079–1091. [DOI] [PubMed] [Google Scholar]
- 3.Gass JD. Stereoscopic Atlas of Macular Diseases. 1st ed. St. Louis: The C. V. Mosby Company; 1970. [Google Scholar]
- 4.Schmitz-Valckenberg S, Sadda S, Staurenghi G, et al. Geographic atrophy: semantic considerations and literature review. Retina. 2016;36:2250–2264. [DOI] [PMC free article] [PubMed] [Google Scholar]
- 5.Haab O Erkrankungen der Macula Lutea. Centralblat Augenheilkd. 1885;9:384–391. [Google Scholar]
- 6.Nettleship E Central senile areolar choroidal atrophy. Trans Ophthalmol Soc U K. 1884;4:165–167. [Google Scholar]
- 7.Behr C Die Heredodegeneration der Makula. Monatsblätter für Augenheilkunde. 1920;65:465–505. [Google Scholar]
- 8.Sarks SH. Senile choroidal sclerosis. Br J Ophthalmol. 1973;57:98–109. [DOI] [PMC free article] [PubMed] [Google Scholar]
- 9.Klien BA. The heredodegeneration of the macula lutea—diagnostic and differential diagnostic considerations and a histopathologic report. Am J Ophthalmol. 1950;33:371–379. [Google Scholar]
- 10.Klein R, Davis MD, Magli YL, et al. The Wisconsin age-related maculopathy grading system. Ophthalmology. 1991;98:1128–1134. [DOI] [PubMed] [Google Scholar]
- 11.Age-Related Eye Disease Study Group. The Age-Related Eye Disease Study system for classifying age-related macular degeneration from stereoscopic color fundus photographs: the Age-Related Eye Disease Study report number 6. Am J Ophthalmol. 2001;132:668–681. [DOI] [PubMed] [Google Scholar]
- 12.Sarks JP, Sarks SH, Killingsworth MC. Evolution of geographic atrophy of the retinal pigment epithelium. Eye (Lond). 1988;2(Pt 5):552–577. [DOI] [PubMed] [Google Scholar]
- 13.Sunness JS, Bressler NM, Tian Y, et al. Measuring geographic atrophy in advanced age-related macular degeneration. Invest Ophthalmol Vis Sci. 1999;40:1761–1769. [PubMed] [Google Scholar]
- 14.Mitchell P, Smith W, Attebo K, Wang JJ. Prevalence of age-related maculopathy in Australia. The Blue Mountains Eye Study. Ophthalmology. 1995;102:1450–1460. [DOI] [PubMed] [Google Scholar]
- 15.Bird AC, Bressler NM, Bressler SB, et al. An international classification and grading system for age-related maculopathy and age-related macular degeneration. The International ARM Epidemiological Study Group. Surv Ophthalmol. 1995;39:367–374. [DOI] [PubMed] [Google Scholar]
- 16.Schmitz-Valckenberg S, Sahel JA, Danis R, et al. Natural history of geographic atrophy progression secondary to age-related macular degeneration (Geographic Atrophy Progression Study). Ophthalmology. 2016;123:361–368. [DOI] [PubMed] [Google Scholar]
- 17.Jaffe GJ, Schmitz-Valckenberg S, Boyer D, et al. Randomized trial to evaluate tandospirone in geographic atrophy secondary to age-related macular degeneration: the GATE study. Am J Ophthalmol. 2015;160:1226–1234. [DOI] [PubMed] [Google Scholar]
- 18.von Ruckmann A, Fitzke FW, Bird AC. Distribution of fundus autofluorescence with a scanning laser ophthalmoscope. Br J Ophthalmol. 1995;79:407–412. [DOI] [PMC free article] [PubMed] [Google Scholar]
- 19.Schmitz-Valckenberg S, Brinkmann CK, Alten F, et al. Semiautomated image processing method for identification and quantification of geographic atrophy in age-related macular degeneration. Invest Ophthalmol Vis Sci. 2011;52:7640–7646. [DOI] [PubMed] [Google Scholar]
- 20.Hwang JC, Chan JW, Chang S, Smith RT. Predictive value of fundus autofluorescence for development of geographic atrophy in age-related macular degeneration. Invest Ophthalmol Vis Sci. 2006;47:2655–2661. [DOI] [PMC free article] [PubMed] [Google Scholar]
- 21.Lindner M, Boker A, Mauschitz MM, et al. Directional kinetics of geographic atrophy progression in age-related macular degeneration with foveal sparing. Ophthalmology. 2015;122:1356–1365. [DOI] [PubMed] [Google Scholar]
- 22.Wolf-Schnurrbusch UE, Wittwer VV, Ghanem R, et al. Blue-light versus green-light autofluorescence: lesion size of areas of geographic atrophy. Invest Ophthalmol Vis Sci. 2011;52:9497–9502. [DOI] [PubMed] [Google Scholar]
- 23.Pfau M, Goerdt L, Schmitz-Valckenberg S, et al. Green-light autofluorescence versus combined blue-light autofluorescence and near-infrared reflectance imaging in geographic atrophy secondary to age-related macular degeneration. Invest Ophthalmol Vis Sci. 2017;58(6):BIO121–BIO130. [DOI] [PubMed] [Google Scholar]
- 24.Schmitz-Valckenberg S, Fleckenstein M, Gobel AP, et al. Evaluation of autofluorescence imaging with the scanning laser ophthalmoscope and the fundus camera in age-related geographic atrophy. Am J Ophthalmol. 2008;146:183–192. [DOI] [PubMed] [Google Scholar]
- 25.Fleckenstein M, Charbel Issa P, Helb HM, et al. High-resolution spectral domain-OCT imaging in geographic atrophy associated with age-related macular degeneration. Invest Ophthalmol Vis Sci. 2008;49:4137–4144. [DOI] [PubMed] [Google Scholar]
- 26.Yehoshua Z, de Amorim Garcia Filho CA, Nunes RP, et al. Comparison of geographic atrophy growth rates using different imaging modalities in the COMPLETE Study. Ophthalmic Surg Lasers Imaging Retina. 2015;46:413–422. [DOI] [PubMed] [Google Scholar]
- 27.Hu Z, Medioni GG, Hernandez M, et al. Segmentation of the geographic atrophy in spectral-domain optical coherence tomography and fundus autofluorescence images. Invest Ophthalmol Vis Sci. 2013;54:8375–8383. [DOI] [PubMed] [Google Scholar]
- 28.Lujan BJ, Rosenfeld PJ, Gregori G, et al. Spectral domain optical coherence tomographic imaging of geographic atrophy. Ophthalmic Surg Lasers Imaging. 2009;40:96–101. [DOI] [PubMed] [Google Scholar]
- 29.Yehoshua Z, Rosenfeld PJ, Gregori G, et al. Progression of geographic atrophy in age-related macular degeneration imaged with spectral domain optical coherence tomography. Ophthalmology. 2011;118:679–686. [DOI] [PMC free article] [PubMed] [Google Scholar]
- 30.Schaal KB, Gregori G, Rosenfeld PJ. En face optical coherence tomography imaging for the detection of nascent geographic atrophy. Am J Ophthalmol. 2017;174:145–154. [DOI] [PubMed] [Google Scholar]
- 31.Giocanti-Auregan A, Tadayoni R, Fajnkuchen F, et al. Predictive value of outer retina en face OCT imaging for geographic atrophy progression. Invest Ophthalmol Vis Sci. 2015;56:8325–8330. [DOI] [PubMed] [Google Scholar]
- 32.Wu Z, Luu CD, Ayton LN, et al. Optical coherence tomography-defined changes preceding the development of drusen-associated atrophy in age-related macular degeneration. Ophthalmology. 2014;121:2415–2422. [DOI] [PubMed] [Google Scholar]
- 33.Csaky KG, Richman EA, Ferris FL 3rd. Report from the NEI/FDA Ophthalmic Clinical Trial Design and Endpoints Symposium. Invest Ophthalmol Vis Sci. 2008;49:479–489. [DOI] [PubMed] [Google Scholar]
- 34.Spaide RF. Outer retinal atrophy after regression of subretinal drusenoid deposits as a newly recognized form of late age-related macular degeneration. Retina. 2013;33:1800–1808. [DOI] [PubMed] [Google Scholar]
- 35.Abdelfattah NS, Al-Sheikh M, Pitetta S, et al. Macular atrophy in neovascular age-related macular degeneration with monthly versus treat-and-extend ranibizumab: findings from the TREX-AMD Trial. Ophthalmology. 2017;124(2):215–223. [DOI] [PubMed] [Google Scholar]
- 36.Bhisitkul RB, Mendes TS, Rofagha S, et al. Macular atrophy progression and 7-year vision outcomes in subjects from the ANCHOR, MARINA and HORIZON studies (SEVEN-UP Study). Am J Ophthalmol. 2015;159:915–924. [DOI] [PubMed] [Google Scholar]
- 37.Pilotto E, Convento E, Guidolin F, et al. Microperimetry features of geographic atrophy identified with en face optical coherence tomography. JAMA Ophthalmol. 2016;134:873–879. [DOI] [PubMed] [Google Scholar]
- 38.Grunwald JE, Pistilli M, Ying GS, et al. Growth of geographic atrophy in the comparison of age-related macular degeneration treatments trials. Ophthalmology. 2015;122:809–816. [DOI] [PMC free article] [PubMed] [Google Scholar]
- 39.Grunwald JE, Pistilli M, Daniel E, et al. Incidence and growth of geographic atrophy during 5 years of Comparison of Age-Related Macular Degeneration Treatments Trials. Ophthalmology. 2017;124:97–104. [DOI] [PMC free article] [PubMed] [Google Scholar]
- 40.Staurenghi G, Sadda S, Chakravarthy U, Spaide RF. Proposed lexicon for anatomic landmarks in normal posterior segment spectral-domain optical coherence tomography: the IN*OCT consensus. Ophthalmology. 2014;121:1572–1578. [DOI] [PubMed] [Google Scholar]
- 41.Holz FG, Sadda SR, Staurenghi G, et al. Imaging protocols in clinical studies in advanced age-related macular degeneration: recommendations from Classification of Atrophy Consensus Meetings. Ophthalmology. 2017;124:464–478. [DOI] [PubMed] [Google Scholar]
- 42.Zanzottera EC, Messinger JD, Ach T, et al. The Project MACULA retinal pigment epithelium grading system for histology and optical coherence tomography in age-related macular degeneration. Invest Ophthalmol Vis Sci. 2015;56:3253–3268. [DOI] [PMC free article] [PubMed] [Google Scholar]
- 43.Curcio CA, Messinger JD, Sloan KR, et al. Subretinal drusenoid deposits in non-neovascular age-related macular degeneration: morphology, prevalence, topography, and biogenesis model. Retina. 2013;33:265–276. [DOI] [PMC free article] [PubMed] [Google Scholar]
- 44.Polyak SL. The Retina. Chicago: The University of Chicago Press; 1941. [Google Scholar]
- 45.Ooto S, Vongkulsiri S, Sato T, et al. Outer retinal corrugations in age-related macular degeneration. JAMA Ophthalmol. 2014;132:806–813. [DOI] [PubMed] [Google Scholar]
- 46.Tan ACS, Astroz P, Dansingani KK, et al. The evolution of the plateau, an optical coherence tomography signature seen in geographic atrophy. Invest Ophthalmol Vis Sci. 2017;58:2349–2358. [DOI] [PMC free article] [PubMed] [Google Scholar]
- 47.Green WR, Enger C. Age-related macular degeneration histopathologic studies. The 1992 Lorenz E. Zimmerman Lecture. Ophthalmology. 1993;100:1519–1535. [DOI] [PubMed] [Google Scholar]
- 48.Schaal KB, Rosenfeld PJ, Gregori G, et al. Anatomic clinical trial endpoints for nonexudative age-related macular degeneration. Ophthalmology. 2016;123:1060–1079. [DOI] [PubMed] [Google Scholar]
- 49.Lek JJ, Brassington KH, Luu CD, et al. Subthreshold nano-second laser intervention in intermediate age-related macular degeneration. Ophthalmol Retina. 2017;1:227–239. [DOI] [PubMed] [Google Scholar]
- 50.Danis RP, Domalpally A, Chew EY, et al. Methods and reproducibility of grading optimized digital color fundus photographs in the Age-Related Eye Disease Study 2 (AREDS2 report number 2). Invest Ophthalmol Vis Sci. 2013; 54:4548–1554. [DOI] [PMC free article] [PubMed] [Google Scholar]
Associated Data
This section collects any data citations, data availability statements, or supplementary materials included in this article.